_________________________________ 1
Faculdade de Agronomia, Universidade de Alfenas/UNIFENAS, adelia.miranda@unifenas.br. 2
Departamento de Engenharia Rural, FCAV/UNESP, Câmpus de Jaboticabal, jlucas@fcav.unesp.br. 3
Departamento de Zootecnia, FCAV/UNESP, Câmpus de Jaboticabal, thomaz@fcav.unesp.br. 4
Departamento de Ciências Exatas, FCAV/UNESP, Câmpus de Jaboticabal, genertp@fcav.unesp.br. 5
BITA - Busca Inteligente em Tecnologia Animal, ellen@bita.vet.br. Recebido pelo Conselho Editorial em: 16-2-2011
Aprovado pelo Conselho Editorial em: 21-9-2011
FINISHING STAGES FED WITH DIETS FORMULATED WITH CORN OR SORGHUM
ADÉLIA P. MIRANDA1, JORGE DE LUCAS JUNIOR2, MARIA C. THOMAZ3,
GENER T. PEREIRA4, ELLEN H. FUKAYAMA5
ABSTRACT: The objective of this study was to evaluate the quality and the production of biogas and biofertilizer obtained from biodigester supplied with pig feces in the initial, growing and finishing stages, fed with diets formulated based on corn or sorghum. Twenty bench biodigesters were used with hydraulic retention time of 30 days and daily loads that contained 4 to 6% of total solids (TS) and 3.6 to 5.2% of volatile solids (VS). In the effluent of the biodigesters, mean levels of TS were observed ranging between 1.6 and 2.0% and of VS between 1.2 and 1.6%. The mean reductions of TS were 57.7 to 64.7% and of VS from 61.7 to 69.0%, and there was only difference in the finishing phase, in which the major averages reductions were produced by the biodigesters supplied with feces from animals fed with diets based on corn. In biodigesters supplied with feces from animals in the initial and growing stages fed with diets based on corn, were observed higher average productions of biogas and the greatest average potentials of biogas production. The average potentials obtained were 0.033; 0.181; 0.685; 0.788 and 1.132 m3 per kg of affluent, manure, TS added, VS added and VS reduced, respectively. No differences were found on the average content of methane in the biogas between diets and stages. The average concentrations of nutrients N, P, K, Ca, Mg, Na, Fe, Mn, Zn and Cu in the biodigester affluent and effluent, ranged between diets and stages.
KEYWORDS: biodigesters, biogas, pig feces, environmental impact.
BIODIGESTÃO ANAERÓBIA DE DEJETOS DE SUÍNOS NAS DIFERENTES FASES ALIMENTADOS COM DIETAS FORMULADAS COM MILHO OU SORGO
RESUMO: Objetivou-se avaliar a produção e a qualidade do biogás e do biofertilizante obtidos em biodigestores abastecidos com dejetos de suínos, nas fases inicial, crescimento e terminação, alimentados com dietas formuladas à base de milho ou sorgo. Foram utilizados 20 biodigestores de bancada, com tempo de retenção hidráulica de 30 dias, e cargas diárias que continham 4,0 a 6,0% de sólidos totais (ST) e 3,6 a 5,2% de sólidos voláteis (SV). Nos efluentes dos biodigestores, foram verificados teores médios de ST variando de 1,6 a 2,0% e de SV entre 1,2 e 1,6%. As reduções médias de ST foram de 57,7 a 64,7% e de SV de 61,7 a 69,0%, sendo que houve diferença somente na fase de terminação, na qual as maiores reduções médias foram para biodigestores abastecidos com dejetos de animais alimentados com dietas à base de milho. Nos biodigestores abastecidos com dejetos de animais em fase inicial e de crescimento, alimentados com dietas formuladas à base de milho, foram verificadas maiores produções médias de biogás e os maiores potenciais médios de produção de biogás. Os potenciais médios obtidos foram 0,033; 0,181; 0,685; 0,788 e 1,132 m3 por kg de afluente, estrume, ST adicionados, SV adicionados e SV reduzidos, respectivamente. Não foram verificadas diferenças quanto ao teor médio de metano no biogás entre dietas e fases. As concentrações médias dos nutrientes N, P, K, Ca, Mg, Na, Fe, Mn, Zn e Cu no afluente e efluente dos biodigestores variaram entre as dietas e fases.
INTRODUCTION
The pig activity stands out for its technical quality and high productivity, generating good economic relations in industry, commerce and services. However, the viability of the activity is threatened when it comes to the environment and it is considered by the environmental control agencies of high pollution potential (CAMPOS, 2005).
According to KONZEN & ALVARENGA (2008), agricultural systems lead to various types of organic waste, which, properly managed and used, provide nutrients for food production and improve the physical, chemical and biological soil condition.
Several alternatives are sought in an attempt to treat feces and harness the potential fertilizer or energy generation. The use of biodigesters is a way that feces become a source of energy, since from the anaerobic digestion of organic matter; biogas is obtained with high energy power. The biofertilizer, stabilized material in the biodigester, represents stimulus to agriculture, because it consists of several nutrients that are important in the fertilization of cultures. Therefore, the anaerobic digestion of feces generated in rural areas provides three benefits: sanitation in rural areas, attainment to the energy demand, and use of biodegradable materials as biofertilizer.
In addition, the development of animal nutrition using modern concepts in feed formulation and applying knowledge related to metabolism and nutritional evaluation of ingredients, allows the provision of adequate diets for each animal category, which improves the efficiency of utilization of nutrients from food, resulting in improved animal performance and reduced nutrient excretion to the environment. As an example, the reduction of crude protein in the diet is mentioned (ZANGERÔNIMO et al., 2006), and also nutritional additives and enzymes that when added to diets formulated for pigs have been proven effective in reducing the excretion of nitrogen, phosphorus, calcium and other nutrients (VEUM et al., 2006), thus contributing to reduce diet costs and to reduce environmental impact.
Therefore, combined with new concepts of nutrition, seeking for lower costs for animal feeding and, in this sense, researches on new ingredients processing or searches for alternative foods are conducted. Considering that the production of sorghum has increased significantly in Brazil, it becomes feasible to use in animal feed, since it has good nutritional value and can be substitute of corn for non-ruminants, in order to not compromise the performance of pigs at different stages (DEAN et al., 2000) and similar values obtained in assessments of nutrient digestibility (FIALHO et al., 2002).
Given the above, this study was conducted to evaluate the production and quality of biogas produced from swine manure in different stages fed with diets formulated based on corn or sorghum, as well as the composition of biofertilizer in biodigesters.
MATERIAL AND METHODS
The anaerobic biodigestion experiment was performed at the Laboratory of Biomass and Anaerobic Digestion of the Agricultural Engineering Department, and the feces were collected by the Division of Swine Production, of the Department of Animal Science, both located in the Agriculture and Veterinary Sciences College, at São Paulo State University, UNESP - Jaboticabal.
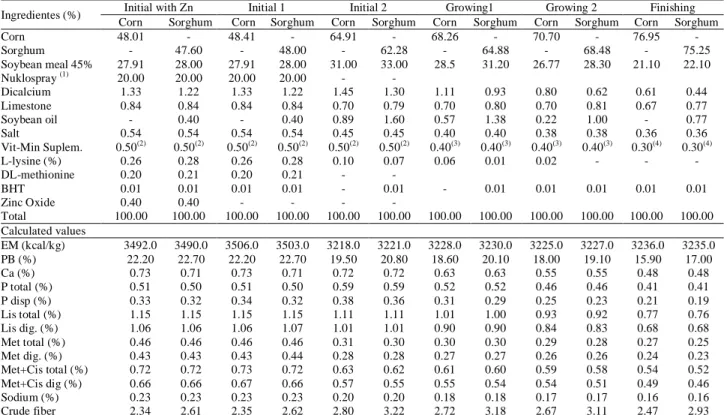
TABLE 1. Food and nutritional composition of diets formulated with corn or sorghum for pigs in the initial, growing and finishing phases.
Ingredientes (%) Initial with Zn Initial 1 Initial 2 Growing1 Growing 2 Finishing Corn Sorghum Corn Sorghum Corn Sorghum Corn Sorghum Corn Sorghum Corn Sorghum Corn 48.01 - 48.41 - 64.91 - 68.26 - 70.70 - 76.95 - Sorghum - 47.60 - 48.00 - 62.28 - 64.88 - 68.48 - 75.25 Soybean meal 45% 27.91 28.00 27.91 28.00 31.00 33.00 28.5 31.20 26.77 28.30 21.10 22.10 Nuklospray (1) 20.00 20.00 20.00 20.00 - -
Dicalcium 1.33 1.22 1.33 1.22 1.45 1.30 1.11 0.93 0.80 0.62 0.61 0.44 Limestone 0.84 0.84 0.84 0.84 0.70 0.79 0.70 0.80 0.70 0.81 0.67 0.77 Soybean oil - 0.40 - 0.40 0.89 1.60 0.57 1.38 0.22 1.00 - 0.77 Salt 0.54 0.54 0.54 0.54 0.45 0.45 0.40 0.40 0.38 0.38 0.36 0.36 Vit-Min Suplem. 0.50(2) 0.50(2) 0.50(2) 0.50(2) 0.50(2) 0.50(2) 0.40(3) 0.40(3) 0.40(3) 0.40(3) 0.30(4) 0.30(4) L-lysine (%) 0.26 0.28 0.26 0.28 0.10 0.07 0.06 0.01 0.02 - - - DL-methionine 0.20 0.21 0.20 0.21 - -
BHT 0.01 0.01 0.01 0.01 - 0.01 - 0.01 0.01 0.01 0.01 0.01 Zinc Oxide 0.40 0.40 - - - -
Total 100.00 100.00 100.00 100.00 100.00 100.00 100.00 100.00 100.00 100.00 100.00 100.00 Calculated values
EM (kcal/kg) 3492.0 3490.0 3506.0 3503.0 3218.0 3221.0 3228.0 3230.0 3225.0 3227.0 3236.0 3235.0 PB (%) 22.20 22.70 22.20 22.70 19.50 20.80 18.60 20.10 18.00 19.10 15.90 17.00 Ca (%) 0.73 0.71 0.73 0.71 0.72 0.72 0.63 0.63 0.55 0.55 0.48 0.48 P total (%) 0.51 0.50 0.51 0.50 0.59 0.59 0.52 0.52 0.46 0.46 0.41 0.41 P disp (%) 0.33 0.32 0.34 0.32 0.38 0.36 0.31 0.29 0.25 0.23 0.21 0.19 Lis total (%) 1.15 1.15 1.15 1.15 1.11 1.11 1.01 1.00 0.93 0.92 0.77 0.76 Lis dig. (%) 1.06 1.06 1.06 1.07 1.01 1.01 0.90 0.90 0.84 0.83 0.68 0.68 Met total (%) 0.46 0.46 0.46 0.46 0.31 0.30 0.30 0.30 0.29 0.28 0.27 0.25 Met dig. (%) 0.43 0.43 0.43 0.44 0.28 0.28 0.27 0.27 0.26 0.26 0.24 0.23 Met+Cis total (%) 0.72 0.72 0.73 0.72 0.63 0.62 0.61 0.60 0.59 0.58 0.54 0.52 Met+Cis dig (%) 0.66 0.66 0.67 0.66 0.57 0.55 0.55 0.54 0.54 0.51 0.49 0.46 Sodium (%) 0.23 0.23 0.23 0.23 0.20 0.20 0.18 0.18 0.17 0.17 0.16 0.16 Crude fiber 2.34 2.61 2.35 2.62 2.80 3.22 2.72 3.18 2.67 3.11 2.47 2.93 (1)
Levels of product warranty: humidity (max) 3.5%, crude protein (min) 28.0%, ether extract (min) 20.0%, lactose (min) 38,5%, mineral matter (max) 5.5%, fibrous matter (max) 0.2%, metabolizable energy 5045 kcal/kg. (2) Levels of warranty by kg feed: vit. A 17500 UI, vit. D3 2500 UI, vit. E 25 mg, vit. K3 5 mg, vit. B1 2 mg, vit. B2 8 mg, vit. B6 2,5 mg, vit. B12 55 mcg, calcium pantothenate 30 mg, folic acid 1.75 mg, Biotin 0.05 mg, niacin 70 mg, iron 240 mg, cobalt 0.625 mg, copper 45 mg, manganese 125 mg, zinc 240 mg, iodine 0.625 mg, selenium 75. Suplement used: POLIMIX® (Fatec). (3) Levels of warranty by kg feed: vit. A 14000 UI, vit. D3 2000 UI, vit. E 20 mg, vit. K3 4 mg, vit. B1 1.6 mg, vit. B2 6.4 mg, vit. B6 2.0 mg, vit. B12 44 mcg, calcium pantothenate 24 mg, folic acid 1.4 mg, biotin 0.04 mg, niacin 56, iron 192 mg, cobalt 0.5 mg, copper 36 mg, manganese 100 mg, zinc 192 mg, iodine 0.5 mg, selenium 0.3. (4) Levels of warranty by kg feed: vit. A 10500 UI, vit. D3 1500 UI, vit. E 15 mg, vit. K3 3 mg, vit. B1 1.2 mg, vit. B2 4.8 mg, vit. B6 1.5 mg, vit. B12 33 mcg, calcium pantothenate 18 mg, folic acid 1.05 mg, biotin 0.03 mg, niacin 42, iron 144 mg, cobalt 0.375 mg, copper 27 mg, manganese 75 mg, zinc 144 mg, iodine 0.375 mg, selenium 0.225.
Twenty bench biodigesters were used made of PVC and previously described by HARDOIM (1999). These were installed in three boxes of cement with 500 L capacity, with a volume of water necessary for uniform heating of the substrate at 35 °C, which is done by means of electric heaters, temperature control by thermostats and water mixture heated by water pump.
The biodigesters had independent gasometers, sized to hold 15 L of biogas, built on a small scale, whose purpose was to store and allow the quantification of the biogas produced by means of a graduated scale attached externally. All the gasometers were immersed in a cement box with 1000 L capacity, containing 750 L of water and a layer of mineral oil used in hydraulic forming consisting of a sheet of 5 mm thick. The oil was added to prevent the absorption of the CO2 produced by
water.
For the supply of the biodigesters, the feces were scraped daily in experimental stalls where the pigs were housed individually. Under each type of feces generated, it could be split into two test digestion treatments, considering the diets of the pigs: M - Biodigesters filled with feces generated by animals fed with diet containing corn, S - Biodigesters filled with feces generated by animals fed with diets containing sorghum.
It was used a randomized design to compare the two diets, i.e., maize and sorghum, and the initial, growing and finishing stages, considering 10 repetitions (biodigesters).
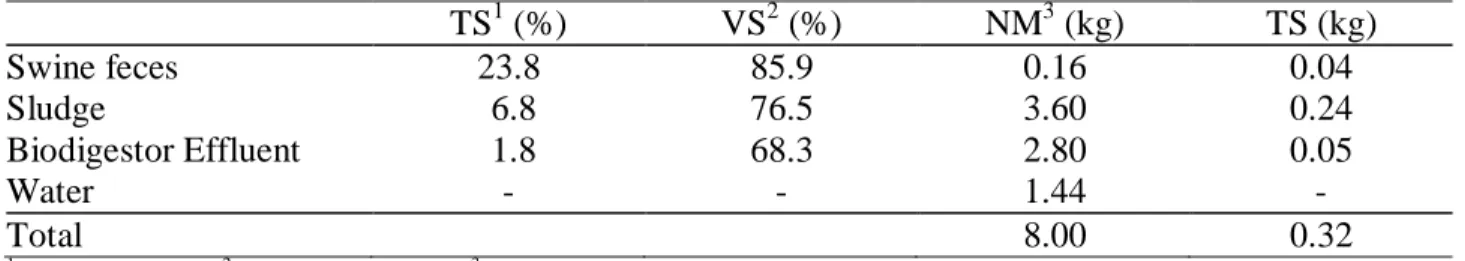
inside the biodigesters. Each digester was initially stocked with eight kilos of affluent with a TS content of 4.0%, while 74.6% were volatile solids (VS). The components of the substrate for initial supply and their respective amounts are shown in Table 2.
TABLE 2. Characterization of the components of the affluent for the initial supply of biodigesters.
1
TS - Total Solids; 2 VS - Volatile Solids; 3 NM - Natural Material
After calculating the amounts described of swine manure, anaerobic sludge reactor UASB, effluent obtained from the biodigester supplied with swine manure and water, the mixture was homogenized with the use of industrial blender, giving greater fermentation conditions inside the biodigesters.
After the initial supply, the digesters were supplied every three days, being the affluent composed of water and swine manure obtained by scraping the collective stalls and posterior manual homogenization in plastic buckets. The quantities of feces used to supply the digesters were calculated from the levels of feces in TS. Based on the concentration of total solids, the feces were mixed with water needed to form affluent with TS content of around 6% (LUCAS JUNIOR, 1994). Ten supplies of 267 mL were made, whose average content of TS was 4.12%, of which 85.97% were volatile. These supplies were conducted during the initial 30 days, and this was necessary to happen the adaptation of the biodigesters concerning to the bacteria and the biogas production stability.
After 30 days of charges for adaptation, the daily loads of feces of initial pigs fed with diets based on corn or sorghum began. It was adopted the hydraulic retention time (HRT) of 30 days, and this refers to the permanence of the material inside the biodigester, i.e., time spent from the inlet to the outlet of the material to be digested by the biodigester. The biodigesters were supplied during 149 days. In the first 36 days, animal feces of initial stage were used; in the 66 days following, animal feces of growing stage; and in the last 47 days, animal feces of finishing stage. Table 3 presents the average quantities of feces and water that made up the affluent for each biodigester.
TABLE 3. Average amounts of feces from pigs fed with diets based on corn or sorghum in the initial, growing and finishing stages, used in the affluents of the biodigesters.
Diets Stages Feces (g) Water (g)
Corn
Initial 49.2 217.8
Growing 58.1 208.9
Finishing 55.0 212.0
Sorghum
Initial 55.2 211.8
Growing 67.0 200.0
Finishing 65.2 201.8
The contents of the TS of feces used each week allowed the calculation of the quantities of feces and water to compose the affluents of the biodigesters, and daily samples were taken of each type of affluent, i.e., those composed of feces from animals fed with diets formulated based on corn or sorghum. As for the effluent, samples were taken daily from each of the 20 biodigesters.
The samples were dried in an oven and directed for the analysis of TS, VS, and ground in an IKA® A11 basic mill for analysis of nutrients, according to the methods described in APHA
TS1 (%) VS2 (%) NM3 (kg) TS (kg)
Swine feces 23.8 85.9 0.16 0.04
Sludge 6.8 76.5 3.60 0.24
Biodigestor Effluent 1.8 68.3 2.80 0.05
Water - - 1.44 -
(1998). The nitrogen was determined by Micro-Kjeldahl method described by SILVA & QUEIROZ (2002). For the determination of other nutrients, the samples were subjected to nitric-perchloric digestion, and the extract obtained from the digestion were used to determine the levels of phosphorus (P), potassium (K), calcium (Ca), magnesium (Mg), sodium (Na) , iron (Fe), manganese (Mn), zinc (Zn) and copper (Cu) according to BATAGLIA (1983). The phosphorus levels were determined by colorimetric method using HACH spectrophotometer model DR-2010 (HACH, 1991). The standards were prepared according to the method described by MALAVOLTA et al. (1989). The concentrations of potassium (K), calcium (Ca), magnesium (Mg), sodium (Na), iron (Fe), manganese (Mn), zinc (Zn) and copper (Cu) were determined by the spectrophotometer of atomic absorption, flame type, GBC 932 AA model.
In order to quantify the potential for biogas production, production data were selected from each biodigester for a period of 30 days. These 30 days were those in which the biogas production showed minor oscillation in volume, i.e., values over this period were more homogeneous when compared with all the data over the 149 days of experiment. The volume of biogas was determined by multiplying the displacement height of the gasometer by the area of the internal cross-section (0.30887 m2). After each daily reading, the gasometers were evacuated until they reach zero.
At the same time, the ambient temperature of the laboratory was measured, using a glass thermometer (range 0 to 110 °C and resolution of 0.1 °C) for posterior correction in the volume of biogas for 1 atm and 20 °C, according to the methodology used by CAETANO (1985), where by the compression factor (Z), biogas showed behavior close to ideal.
To assess the composition of biogas, it was analyzed the levels of methane (CH4) and carbon
dioxide (CO2). Weekly samples of biogas were collected from each of the gasometers, using plastic
syringes of 50 mL volume. For the determinations, it was used gas chromatograph, FINNINGAN GC 2001 brand, equipped with Porapack Q columns, molecular sieve 5A, and a thermal conductivity detector, using hydrogen as the carrier gas.
The data obtained in the experiment of anaerobic digestion allows the analysis of reductions of TS and VS after the digestion process, potential for biogas production, methane content in biogas, and quantity of nutrients in the biodigester affluent and effluent. These were subjected to analysis of variance for repeated measures, considering one factor among animals (feces generated by different diets, with two levels) and a factor inside the animals (stages, with 3 levels). There were ten biodigesters in each diet (ZAR, 1999). It was used the statistical program SISVAR 4.6. (FERREIRA, 2000), and the comparisons of means were performed by Tukey test (5%).
RESULTS AND DISCUSSION
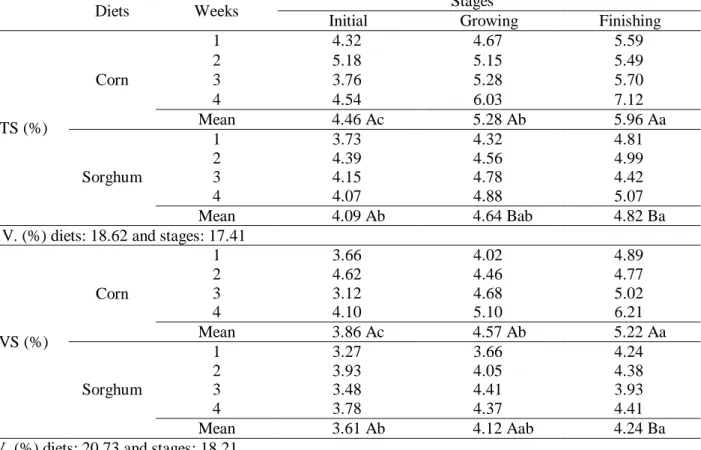
The average content of total and volatile solids of the biodigester affluents and effluents are presented in Tables 4 and 5, respectively for affluent and effluent. Mean values are related to the weeks in which the biogas production data were collected at each growing stage.
The average levels of total solids (TS) and volatile solids (VS) in the biodigester affluents differ (P <0.05) according to the composition of feces used for affluents and stages, and the highest values observed in the affluent consisting of feces from pigs fed with diet based on corn obtained from animals in the finishing stage (Table 4).
The mean levels of TS and VS in biodigester effluents showed differences (P <0.05) only in feces obtained from growing pigs, and the highest mean levels (P <0.05) observed in biodigester effluents supplied with feces from pigs fed with diets based on corn. Comparing the stages, it appears that effluent obtained from biodigesters supplied with feces from pigs in the finishing phase had higher mean levels of TS and VS (P <0.05) (Table 5).
TABLE 4. Mean levels of total solids (TS) and volatile solids (VS), in %, of biodigester affluents supplied with feces of pigs fed with diets based on corn or sorghum in different stages.
Diets Weeks Stages
Initial Growing Finishing
TS (%)
Corn
1 4.32 4.67 5.59
2 5.18 5.15 5.49
3 3.76 5.28 5.70
4 4.54 6.03 7.12
Mean 4.46 Ac 5.28 Ab 5.96 Aa
Sorghum
1 3.73 4.32 4.81
2 4.39 4.56 4.99
3 4.15 4.78 4.42
4 4.07 4.88 5.07
Mean 4.09 Ab 4.64 Bab 4.82 Ba
*C.V. (%) diets: 18.62 and stages: 17.41
VS (%)
Corn
1 3.66 4.02 4.89
2 4.62 4.46 4.77
3 3.12 4.68 5.02
4 4.10 5.10 6.21
Mean 3.86 Ac 4.57 Ab 5.22 Aa
Sorghum
1 3.27 3.66 4.24
2 3.93 4.05 4.38
3 3.48 4.41 3.93
4 3.78 4.37 4.41
Mean 3.61 Ab 4.12 Aab 4.24 Ba
C.V. (%) diets: 20.73 and stages: 18.21
* Coefficient of variation. Means followed by the same uppercase letters in columns and lowercase in the rows do not differ (Tukey, 5%).
TABLE 5. Mean levels of total solids (TS) and volatile solids (VS), in %, of biodigester effluents supplied with feces of pigs fed with diets based on corn or sorghum in different stages.
Diets Weeks Stages
Initial Growing Finishing
TS (%)
Corn
1 1.99 1.95 1.77
2 1.68 1.82 1.57
3 1.59 1.96 2.52
4 1.52 2.03 2.37
Mean 1.69 Ab 1.94 Aa 2.06 Aa
Sorghum
1 1.80 1.74 1.96
2 1.32 1.68 1.53
3 1.67 1.78 2.21
4 1.82 1.79 2.44
Mean 1.64 Ab 1.75 Bb 2.03 Aa
*C.V. (%) diets: 12.79 and stages: 9.70
VS (%)
Corn
1 1.41 1.46 1.36
2 1.20 1.36 1.23
3 1.12 1.47 1.99
4 1.11 1.53 1.80
Mean 1.22 Ab 1.45 Aa 1.59 Aa
Sorghum
1 1.29 1.33 1.56
2 1.00 1.28 1.21
3 1.15 1.36 1.76
4 1.31 1.34 1.94
Mean 1.18 Ab 1.33 Bb 1.62 Aa
C.V. (%) diets: 13.56 and stages: 10.22
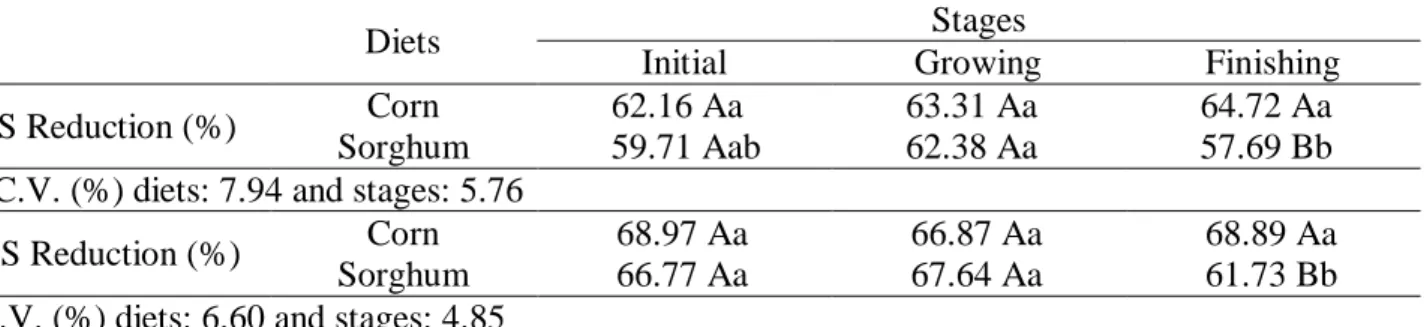
The percentages of reduction of TS and VS after passage of the affluents consisting of feces from pigs fed with different diets by the biodigesters are shown in Table 6. In the finishing stage, diets offered to pigs interfered in the reduction of solid with the highest reduction means of TS and VS (P<0.05) observed in biodigesters filled with feces from pigs fed with corn-based diet. In relation to the stages, there were no significant differences (P>0.05) in TS and VS reductions in biodigesters filled with feces from animals fed with diets containing corn. However, in the biodigesters whose affluents were composed of feces from animals fed with diets based on sorghum, there is difference in mean reductions of TS between the growing and finishing stages, and both do not differ from the initial stage. Regarding VS, the lowest mean reductions (P<0.05) occurred in the biodigesters with feces from animals at termination.
TABLE 6. Mean reductions of total solids (TS) and volatile solids (VS), in %, of biodigesters supplied with feces of pigs fed with diets based on corn or sorghum in different stages.
Diets Stages
Initial Growing Finishing
TS Reduction (%) Corn 62.16 Aa 63.31 Aa 64.72 Aa
Sorghum 59.71 Aab 62.38 Aa 57.69 Bb
*C.V. (%) diets: 7.94 and stages: 5.76
VS Reduction (%) Corn 68.97 Aa 66.87 Aa 68.89 Aa
Sorghum 66.77 Aa 67.64 Aa 61.73 Bb
C.V. (%) diets: 6.60 and stages: 4.85
*Coefficient of variation. Means followed the same uppercase letters in columns and lowercase in the rows do not differ (Tukey, 5%).
The solid reduction values were lower than those obtained by ORRICO JUNIOR (2008) when assessing the performance of bench biodigesters filled with swine feces operating at HRT of 29 days. The values obtained by that author were from a 66.77% reduction in TS and 70.82% reduction in VS. ZHANG et al. (1990), however, when evaluating anaerobic digesters operated with HRT of 15 days, had reduced VC value of 66%, which is similar to those obtained in this work.
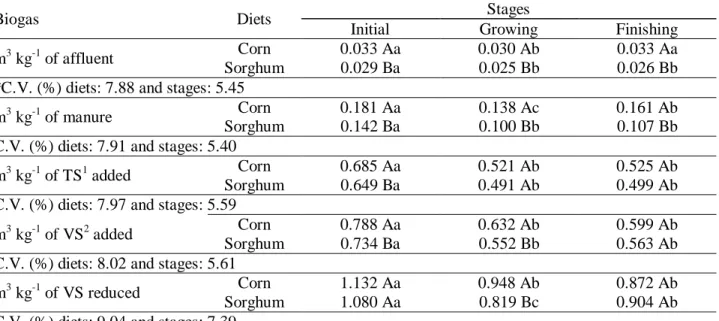
The mean potentials of biogas production are presented in Table 7. The highest mean potentials of biogas production (P<0.05) were found in biodigesters filled with feces from pigs fed with diets based on corn at all stages, considering the variables m3 per kg of affluent and of manure, in the initial and growing stages for the variable m3 per kg of TS added, in the initial and growing stages for the variable m3 per kg of VS added, in the growing stage for the variable m3 per kg of VS reduced. Comparing the feces produced at different stages, we observed higher mean potentials of biogas production (P<0.05) in the feces obtained in the initial stage in both diets.
The mean daily production of biogas and the mean production potentials were lower for feces from pigs fed with diets based on sorghum. Although no conclusive explication for the facts, it is suggested that there has been a deleterious effect of the presence of tannins in sorghum on the methanogenic Archaea, corroborating the statement of SCALBERT (1991), in which catechin, a component of tannin, when in the oxidized form, is a strong inhibitor agent of methanogenic
Archaea.
The highest potentials for biogas production obtained in the initial stage of creation should be the differences in the formulation of diets, in which it has the inclusion of richer and easier degraded ingredients when intended for young animals.
TABLE 7. Mean potentials of biogas production, in biodigesters supplied with feces of pigs fed with diets based on corn or sorghum in different stages.
Biogas Diets Stages
Initial Growing Finishing
m3 kg-1 of affluent Corn 0.033 Aa 0.030 Ab 0.033 Aa
Sorghum 0.029 Ba 0.025 Bb 0.026 Bb
*C.V. (%) diets: 7.88 and stages: 5.45
m3 kg-1 of manure Corn 0.181 Aa 0.138 Ac 0.161 Ab
Sorghum 0.142 Ba 0.100 Bb 0.107 Bb
C.V. (%) diets: 7.91 and stages: 5.40
m3 kg-1 of TS1 added Corn 0.685 Aa 0.521 Ab 0.525 Ab
Sorghum 0.649 Ba 0.491 Ab 0.499 Ab
C.V. (%) diets: 7.97 and stages: 5.59
m3 kg-1 of VS2 added Corn 0.788 Aa 0.632 Ab 0.599 Ab
Sorghum 0.734 Ba 0.552 Bb 0.563 Ab
C.V. (%) diets: 8.02 and stages: 5.61
m3 kg-1 of VS reduced Corn 1.132 Aa 0.948 Ab 0.872 Ab
Sorghum 1.080 Aa 0.819 Bc 0.904 Ab
C.V. (%) diets: 9.04 and stages: 7.39
*Coefficient of variation. 1Total Solids; 2Volatile Solids. Means followed the same uppercase letters in columns and lowercase in the rows do not differ (Tukey, 5%).
It is emphasized that the cited works on biogas production potentials from swine feces did not contain information on the diet used by animals. It is believed that they were formulated with corn and soybean meal as main ingredients, since these are the ingredients used for pig feeding in Brazil.
Knowing that the mean daily production of feces per animal housed in individual stalls where the feces were collected for the composition of the affluents of the digesters was 0.321, 0.622 and 0.902 kg of feces from pigs fed with diets containing corn and 0.348, 0.900 and 1.119 kg from animals fed with diets formulated based on sorghum, in the initial, growing and finishing stages, respectively, and knowing the mean potentials of biogas production per kg of manure, it was possible to relate the production of biogas and the amount of feces generated daily by pigs in different stages and submitted to two experimental diets (Table 8).
The mean daily production of biogas related to mean daily production of feces differ between diets in the finishing stage, in which the highest mean production (P<0.05) was of feces of pigs fed with diets formulated based on corn.
The feces obtained from pigs undergoing finishing stage provided the greatest mean productions of biogas (P<0.05) considering both diets provided. This happened due to the increase in the mean amount of feces generated daily, leading to an increase in mean daily production of biogas.
TABLE 8. Relation of mean daily production of biogas (m3) and mean daily production of feces (kg) of pigs fed with diets based on corn or sorghum in different stages.
Diets Stages
Initial Growing Finishing
Corn 0.055 Ac 0.081 Ab 0.146 Aa
Sorghum 0.050 Ac 0.089 Ab 0.119 Ba
*C.V. (%) diets: 24.73 and stages: 22.78
*Coefficient of variation. Means followed the same uppercase letters in columns and lowercase in the rows do not differ (Tuke y, 5%).
TABLE 9. Mean levels of methane (%) in biogas produced of feces from pigs fed with diets based on corn or sorghum in different stages.
Diets Stages
Initial Growing Finishing
Corn 66.99 64.65 65.50
Sorghum 67.42 65.19 67.32
*C.V. (%) diets: 3.89 and stages: 3.84
*Coefficient of variation. Means do not differ (Tukey, 5%).
Comparing the results with the mean content of methane in biogas generated in biodigesters installed in pig farming in state of Santa Catarina, Brazil, by the PNMA II (National Environmental Program II) cited by OLIVEIRA & HIGARASHI (2006), observe that the mean levels of methane were also close, because the percentage of CH4 in those biodigesters remained almost constant at
69%.
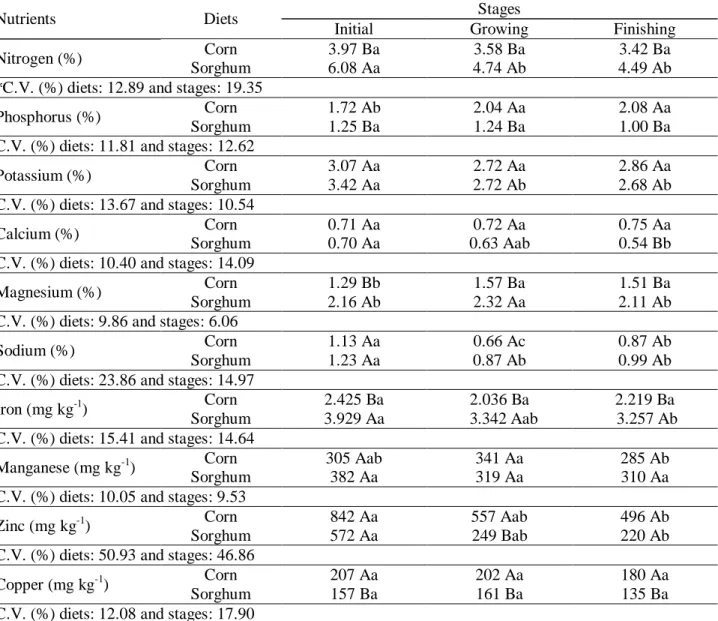
The mean concentrations of nutrients present in the biodigester affluents and effluents, respectively, are presented in tables 10 and 11. The different diets and stages of animals interfered (P<0.05) in mean concentrations of macro and micronutrients in the biodigester affluents.
TABLE 10. Mean concentrations of macronutrients (% of dry matter) and micronutrients (mg kg-1 of dry matter) in biodigester affluents supplied with feces from pigs fed with diets based on corn or sorghum in different stages.
Nutrients Diets Stages
Initial Growing Finishing
Nitrogen (%) Corn 3.97 Ba 3.58 Ba 3.42 Ba
Sorghum 6.08 Aa 4.74 Ab 4.49 Ab
*C.V. (%) diets: 12.89 and stages: 19.35
Phosphorus (%) Corn 1.72 Ab 2.04 Aa 2.08 Aa
Sorghum 1.25 Ba 1.24 Ba 1.00 Ba
C.V. (%) diets: 11.81 and stages: 12.62
Potassium (%) Corn 3.07 Aa 2.72 Aa 2.86 Aa
Sorghum 3.42 Aa 2.72 Ab 2.68 Ab
C.V. (%) diets: 13.67 and stages: 10.54
Calcium (%) Corn 0.71 Aa 0.72 Aa 0.75 Aa
Sorghum 0.70 Aa 0.63 Aab 0.54 Bb
C.V. (%) diets: 10.40 and stages: 14.09
Magnesium (%) Corn 1.29 Bb 1.57 Ba 1.51 Ba
Sorghum 2.16 Ab 2.32 Aa 2.11 Ab
C.V. (%) diets: 9.86 and stages: 6.06
Sodium (%) Corn 1.13 Aa 0.66 Ac 0.87 Ab
Sorghum 1.23 Aa 0.87 Ab 0.99 Ab
C.V. (%) diets: 23.86 and stages: 14.97
Iron (mg kg-1) Corn 2.425 Ba 2.036 Ba 2.219 Ba
Sorghum 3.929 Aa 3.342 Aab 3.257 Ab
C.V. (%) diets: 15.41 and stages: 14.64
Manganese (mg kg-1) Corn 305 Aab 341 Aa 285 Ab
Sorghum 382 Aa 319 Aa 310 Aa
C.V. (%) diets: 10.05 and stages: 9.53
Zinc (mg kg-1) Corn 842 Aa 557 Aab 496 Ab
Sorghum 572 Aa 249 Bab 220 Ab
C.V. (%) diets: 50.93 and stages: 46.86
Copper (mg kg-1) Corn 207 Aa 202 Aa 180 Aa
Sorghum 157 Ba 161 Ba 135 Ba
C.V. (%) diets: 12.08 and stages: 17.90
ORRICO JUNIOR (2008) filled bench biodigesters with affluent composed by swine feces and observed mean concentrations of 3.74% of nitrogen (N); 2.05% of phosphorus (P); 2.32% of potassium (K); 1.16% of calcium (Ca); 0.59% of magnesium (Mg); and 0.66% of sodium (Na), in% of dry matter. The mean concentration of N was similar to those obtained in affluents containing feces from pigs fed with corn-based diet. The mean concentrations of P and Ca were higher, while the values of K, Mg and Na were lower than those obtained in this study.
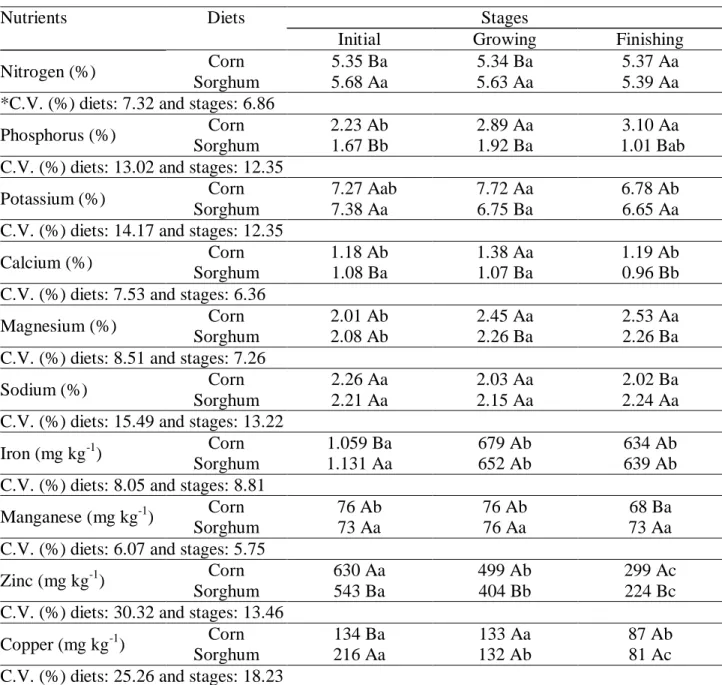
The mean concentrations of nutrients in biodigesters effluents are shown in Table 11. It is observed that the mean concentrations of nutrients in the effluent differed (P<0.05) between the biodigesters filled with feces from pigs in different stages and fed with different diets.
TABLE 11. Mean concentrations of macronutrients (% of dry matter) and micronutrients (mg kg-1 of dry matter) in biodigester effluents supplied with feces from pigs fed with diets based on corn or sorghum in different stages.
Nutrients Diets Stages
Initial Growing Finishing
Nitrogen (%) Corn 5.35 Ba 5.34 Ba 5.37 Aa
Sorghum 5.68 Aa 5.63 Aa 5.39 Aa
*C.V. (%) diets: 7.32 and stages: 6.86
Phosphorus (%) Corn 2.23 Ab 2.89 Aa 3.10 Aa
Sorghum 1.67 Bb 1.92 Ba 1.01 Bab
C.V. (%) diets: 13.02 and stages: 12.35
Potassium (%) Corn 7.27 Aab 7.72 Aa 6.78 Ab
Sorghum 7.38 Aa 6.75 Ba 6.65 Aa
C.V. (%) diets: 14.17 and stages: 12.35
Calcium (%) Corn 1.18 Ab 1.38 Aa 1.19 Ab
Sorghum 1.08 Ba 1.07 Ba 0.96 Bb
C.V. (%) diets: 7.53 and stages: 6.36
Magnesium (%) Corn 2.01 Ab 2.45 Aa 2.53 Aa
Sorghum 2.08 Ab 2.26 Ba 2.26 Ba
C.V. (%) diets: 8.51 and stages: 7.26
Sodium (%) Corn 2.26 Aa 2.03 Aa 2.02 Ba
Sorghum 2.21 Aa 2.15 Aa 2.24 Aa
C.V. (%) diets: 15.49 and stages: 13.22
Iron (mg kg-1) Corn 1.059 Ba 679 Ab 634 Ab
Sorghum 1.131 Aa 652 Ab 639 Ab
C.V. (%) diets: 8.05 and stages: 8.81
Manganese (mg kg-1) Corn 76 Ab 76 Ab 68 Ba
Sorghum 73 Aa 76 Aa 73 Aa
C.V. (%) diets: 6.07 and stages: 5.75
Zinc (mg kg-1) Corn 630 Aa 499 Ab 299 Ac
Sorghum 543 Ba 404 Bb 224 Bc
C.V. (%) diets: 30.32 and stages: 13.46
Copper (mg kg-1) Corn 134 Ba 133 Aa 87 Ab
Sorghum 216 Aa 132 Ab 81 Ac
C.V. (%) diets: 25.26 and stages: 18.23
*Coefficient of variation. Means followed the same uppercase letters in columns and lowercase in the rows do not differ (Tuke y, 5%).
according to MAKKAR (2003), the presence of tannins in sorghum causes partition of N, making higher excretions via feces to occur due to binding of N to tannins presents on them, and a smaller proportion is excreted in the urine.
Overall, there were increases in the concentrations of nutrients, based on dry matter, when comparing the affluents values with the effluents values. It should be noted that the increases do not occur in mass, but occurs in concentration, mainly due to loss of carbon-rich compounds, such as CO2 and CH4.
CONCLUSIONS
The largest potentials of biogas production were found in biodigesters filled with feces from pigs fed with diets formulated based on corn in the initial stage. The potentials of biogas production were 0.033, 0.181, 0.685, 0.788 and 1.132 m3 of biogas per kg of affluent, manure, TS and VS added and VS reduced, respectively.
The percentage of methane in the biogas generated from feces of pigs fed with diets containing corn or sorghum ranged from 64 to 67%.
Nutrient concentrations in the biodigester affluents and effluents varied according to the swine diets and stages.
REFERENCES
APHA - AMERICAN PUBLIC HEALTH ASSOCIATION. Standard methods for the examination
of water and wastewater. 19th ed. Washington, 1998.
BATAGLIA, O. G. Métodos de análises químicas de plantas. Campinas: Instituto Agronômico, 1983. 48 p. (Boletim Técnico).
CAETANO, L. Proposição de um sistema modificado para quantificação de biogás. 1985. 75 f. Dissertação (Mestrado em Energia na Agricultura) - Faculdade de Ciências Agronômicas, Universidade Estadual Paulista, Botucatu, 1985.
CAMPOS, C.M.M.; MOCHIZUKI, E.T.; DAMASCENO, L.H.S.; BOTELHO, C.G. Avaliação do potencial de produção de biogás e da eficiência de tratamento do reator anaeróbio de manta de lodo (UASB) alimentado com dejetos de suínos. Ciência e Agrotecnologia, Lavras, v.29, n.4, p.848-856, 2005.
DEAN, D.W.; HANCOCK, J. D.; HINES, R. H.; McKINNEY, L. J.; BEHNKE, K. C.; LEE, D. J. Food-grade sorghum in diets for nursery pigs. Journal of Animal Science, Champaign, v.78, p.60, 2000. Supplement. Abst. 162.
FERREIRA, D.F. Análise estatística por meio do SISVAR para Windows versão 4.0. In:
REUNIÃO BRASILEIRA DA SOCIEDADE INTERNACIONAL DE BIOMETRIA, 45., 2000, São Carlos. Programas e Resumos... São Carlos: UFSCar, 2000. p.235.
FIALHO, E.T.; LIMA, J.A.F.; OLIVEIRA, V.; SILVA, H.O. Substituição do milho pelo sorgo sem tanino em rações de leitões: digestibilidade dos nutrientes e desempenho animal. Revista Brasileira
Milho e Sorgo, Sete Lagoas, v.1, n.1, p.105-111, 2002.
HACH COMPANY. DR2010. Spectrophotometer Handbook, Loverland, 1991. p.631-691.
HARDOIM, P.C. Efeito da temperatura de operação e da agitação mecânica na eficiência da
biodigestão anaeróbia de dejetos de bovinos. 1999. 88 f. Tese (Doutorado em Produção Animal) -
Faculdade de Ciências Agrárias e Veterinárias, Universidade Estadual Paulista, Jaboticabal, 1999.
CULTURA DO MILHO, 5., 2007, Videira. Disponível em:
<http://www.cnpms.embrapa.br/publicacoes/milho/feroranica.htm>. Acesso em: out 2008.
LUCAS JUNIOR, J. Algumas considerações sobre o uso do estrume de suínos como substrato para
três sistemas de biodigestores anaeróbios. 1994. 137 f. Tese (Livre - Docência em Construções
Rurais) - Faculdade de Ciências Agrárias e Veterinárias, Universidade Estadual Paulista, Jaboticabal, 1994.
MAKKAR, H.P.S. Effect and fate of tannins in ruminant animals, adaptation to tannins, and strategies to overcome detrimental effects of feeding tannin-rich feeds. Small Ruminant Research, Amsterdam, v.49, p.241-256, 2003.
MALAVOLTA, E.; VITTI, G.C.; OLIVEIRA, S.A. Avaliação do estado nutricional das plantas: princípios e aplicações. Piracicaba. Associação Brasileira para Pesquisa da Potassa e do Fosfato, 1989. 193 p.
MIRANDA, A.P.; LUCAS JUNIOR, J.; AMARAL, L.A. Produção de biogás a partir de dejetos de suínos influenciada por diferentes temperaturas e tempos de retenção hidráulica In: CONGRESSO BRASILEIRO DE VETERINÁRIOS ESPECIALISTAS EM SUÍNOS, 12., 2005, Fortaleza.
Anais... Fortaleza: ABRAVES, 2005. v.2, p.508-509.
NAGAE, R.; DAMASCENO, S.; RICHARD, A. Caracterização do dejeto de suínos em
crescimento e terminação criados no sistema de lâmina d’água submetido a dois manejos de
higienização. In: ABES - Associação Brasileira de Engenharia Sanitária e Ambiental. Saneamento
ambiental brasileiro: utopia ou realidade? Rio de Janeiro: ABES, 2005. p.1-6.
NATIONAL RESEARCH COUNCIL. NRC. Nutrient requeriments of swine. 10th rev. ed.
Washington: National Academy Press, 1998. 189 p.
OLIVEIRA, P.A.V.; HIGARASHI, M.M. Geração e utilização de biogás em unidades de produção
de suínos. Concórdia: Embrapa Suínos e Aves, 2006. 42 p. (Documentos, 115).
ORRICO JUNIOR, M.A.P. Biodigestão anaeróbia e compostagem de dejetos de suínos, com e sem
separação de sólidos. 2008. 93 f. Dissertação (Mestrado em Zootecnia) - Faculdade de Ciências
Agrárias e Veterinárias, Universidade Estadual Paulista, Jaboticabal, 2008.
ROSTAGNO, H.S.; ALBINO, L.F.T.; DONZELE, J.L.; GOMES, P.C.; OLIVEIRA, R.F.; LOPES, D.C.; FERREIRA, A.S.; BARRETO, S.L.T. Tabelas brasileiras para aves e suínos: composição de alimentos e exigências nutricionais. 2.ed. Viçosa: Imprensa Universitária/UFV, 2005. 186 p.
SCALBERT, A. Antimicrobial properties of tannins. Phytochemistry, Oxford, v.30, n.12, p.3875-3883, 1991.
SILVA, D. J.; QUEIRÓZ, A. C. Análise de alimentos: métodos químicos e biológicos. 3.ed. Viçosa: UFV, 2002. p.57-76.
SILVA, F.M. Utilização do biogás como combustível. In: CONGRESSO BRASILEIRO DE ENGENHARIA AGRÍCOLA, 27., 1998, Lavras. Anais... Lavras: UFLA/SBEA, 1998. p.96-125.
VEUM, T.L.; BOLLINGER, D.W.; BUFF, C.E.; BEDFORD, M.R. A genetically engineered Escherichia coli phytase improves nutrient utilization, growth performance and bone strength of young swine fed diets deficient in available phosphorus. Journal of Animal Science, Champaign, v.84, n.5, p.1147-1158, 2006.
ZANGERONIMO, M.G.; FIALHO, E.T.; LIMA, J.A.F.; RODRIGUES, P.B.; MURGAS, L.D.S. Redução do nível de proteína bruta da ração suplementada com aminoácidos sintéticos para leitões na fase inicial. Revista Brasileira de Zootecnia, Viçosa, v.35, n.3, p.849-856, 2006.