Amélia Augusta de Lima Friche
A Utilização de Indicadores de Contexto na Análise de
Eventos de Saúde
Universidade Federal de Minas Gerais Programa de Pós-Graduação em Saúde Pública
Belo Horizonte - MG Belo Horizonte
Amélia Augusta de Lima Friche
A Utilização de Indicadores de Contexto na Análise de
Eventos de Saúde
Tese apresentada ao Programa de Pós-Graduação em Saúde Pública da Faculdade de Medicina da Universidade Federal de Minas Gerais, como requisito parcial para obtenção do título de Doutor em Saúde Pública - área de concentração em Epidemiologia
Orientadora: Profª. Waleska Teixeira Caiaffa Co-orientadores: Profª. Cibele Comini César Prof. Fernando Augusto Proietti
Universidade Federal de Minas Gerais
Reitor
Prof. Clélio Campolina Vice-reitora
Profª. Rocksane de Carvalho Norton Pró-Reitor de Pós-Graduação Ricardo Santiago Gomez Pró-Reitor de Pesquisa Renato de Lima Santos
Faculdade de Medicina Diretor
Prof. Francisco José Pena
Chefe do Departamento de Medicina Preventiva e Social Prof. Prof. Antônio Leite Alves Radicchi
Programa de Pós-Graduação em Saúde Pública Coordenador
Prof. Mark Drew Crosland Guimarães Sub-Coordenador
Profª. Ada Ávila Assunção
Colegiado do Programa de Pós-Graduação em Saúde Pública Profª. Eli Iola Gurgel de Andrade
Prof. Fernando Augusto Proietti Profª. Mariângela Leal Cherchiglia Profª. Sandhi Maria Barreto
Cibele Comini César Carla Jorge Machado
Maria Fernanda Furtado de Lima Costa Tarcísio Márcio Magalhães Pinheiro Soraya Almeida Belisário
Para Ana Carolina e William que deixaram como legado a sua determinação e indignação frente as iniquidades
Para Euder meu grande amor
Agradecimentos
À Waleska, pela confiança, disponibilidade e pelo aprendizado. Pela amizade fraterna e pelos muitos bons momentos; pelas viagens e batalhas;
À Cibele, pelo aprendizado, pela disponibilidade, pelo tempo compartilhado;
Ao Fernando Proietti, pela confiança e aprendizado;
À Ana Diez-Roux, pela acolhida carinhosa, aprendizado e pelo exemplo de profissionalismo; Aos membros da banca, Celeste Rodrigues de Souza, Davidson Pires Lima, Maria Isabel Toulson Davisson Correia e Simone Synamon Cohen, pela disponibilidade e pelas valorosas contribuições;
A toda equipe do OSUBH/GPE, em especial à Aline, à Marcela e ao Vitor, sempre prontos a me ajudar;
Às colegas do departamento de Fonoaudiologia, em especial à Stela, à Andréa e à Laélia e aos meus alunos, que souberam compreender a minha correria pelos corredores;
Aos professores e colegas do Programa de Pós-Graduação em Saúde Pública da UFMG e à CAPES, pela concessão da bolsa sanduíche;
Aos todos os meus amigos, pelo carinho e pela alegria;
Aos amigos Vânia e Cid, aos meus irmãos Afraninho e Hamilton, à Waleska e ao Felipe, que tornaram possível a nossa estadia em Ann Arbor; à Ana, Pepe Gabriela e Amanda, meu anjo da guarda americano, pelos bons momentos que passamos lá;
À minha sogra e às minhas cunhadas pela confiança e incentivo;
Aos meus irmãos queridos, cunhados e sobrinhos, por acreditarem no meu sucesso; Às minhas queridas irmãs, que compartilham comigo angústias e alegrias;
À minha querida mamãe, Lourdes, que compreende às minhas ausências e se orgulha incondicionalmente de mim;
À Lídia, à Nina e à Beatriz, pelo carinho e por me propiciarem por algum tempo, a oportunidade de ser mãe de quatro filhas;
Ao Pablo, pela doçura e pela inteligência, ao Luís, pela cumplicidade e pela música e à Iara, pela alegria e determinação. Obrigada por terem me escolhido como mãe;
Ao Euder, pelo amor, pelo movimento e pela intensidade da vida; por ter se dedicado intensa e amorosamente aos cuidados com a Iara e com a casa, aqui e em AA; por compreender as ausências, as angústias, os medos; por abrir mão do cinema e das viagens; por ser meu parceiro de alma.
“Os olhos não vêem coisas, mas figuras de coisas que significam outras coisas... Vejo duas cidades. Uma do rato e outra da andorinha...
...ambas mudam com o tempo,
mas não muda a relação entre elas:
a segunda é a que está para se libertar da primeira.” Ítalo Calvino: As cidades invisíveis
Resumo da Tese
Introdução: A idéia de que o lugar em que se vive contribui para os desfechos e manutenção da saúde para além das características individuais, tem motivado a realização de muitos estudos epidemiológicos. Nesta perspectiva, torna-se fundamental entender mais profundamente quais as dimensões do contexto afetam a saúde e ainda, como os eventos de saúde se comportam e são influenciados por cada uma dessas dimensões. Muitos estudos têm utilizado diferentes fontes de informações para caracterizar o contexto: censos nacionais ou locais; observação social sistemática do local de moradia; sistemas de informações geográficas; e ainda as informações sobre as percepções dos indivíduos sobre o seu local de moradia. No entanto, a mensuração do contexto é complexa e apresenta-se como um desafio. Objetivo: O objetivo geral dessa tese foi avaliar o comportamento de diferentes indicadores de contexto em Belo Horizonte e sua associação com eventos relacionados à saúde, sob a perspectiva da Saúde Urbana. Métodos: Como fonte de informações individuais foram utilizados dois inquéritos de saúde realizados em Belo Horizonte, o ―Inquérito Domiciliar
sobre Comportamentos de Risco e Morbidade Referida de Doenças e Agravos não
Transmissíveis‖ (InqDANT) e o ―Estudo Saúde em Beagá‖. Os indicadores de contexto
agregado. A análise preliminar utilizando as escalas como indicadores de contexto na análise multinível dos fatores relacionados à limitação para atividades habituais mostrou associações significantes com as escalas de serviços públicos, ambiente para caminhada, violência, desordens físicas e problemas na vizinhança. Conclusão: O presente estudo apresentou avanços ao identificar e avaliar a utilização de indicadores de contexto disponíveis no município de Belo Horizonte. O IQVU e o IVS apresentaram-se como bons indicadores de contexto na avaliação da limitação para execução de atividades habituais. As escalas desenvolvidas poderão ser usadas como indicadores de contexto na análise multinível de eventos relacionados à saúde do "Estudo em Saúde Beagá" e em outros estudos desenvolvidos em Belo Horizonte. A compreensão das relações entre vizinhança e saúde pode contribuir para subsidiar intervenções que visem à melhoria da saúde das populações que vivem em centros urbanos.
Abstract
showed significant associations with the scales of public services, environment, violence, physical disorders and problems in the neighborhood. Conclusion: This study showed progress in identifying and evaluating the use of context indicators available in the city of Belo Horizonte. The IVS and the IQVU presented themselves as good context indicators in the assessment of functional limitation. The scale developed can be used as indicators of multilevel analysis in the context of events related to the "Saúde em Beagá Study." Understanding the relationships between neighborhoods and health, can contribute to support interventions aimed at improving the health of populations living in urban centers
SUMÁRIO
1- CONSIDERAÇÕES INICIAIS ... 17
2- OBJETIVOS ... 25
3- ARTIGO ORIGINAL 1: Quality of Urban Life and Health: individual and contextual factors associated with self-rated health, chronic diseases and functional limitation ... 27
Resumo ... 28
Abstract ... 29
Introdução ... 30
Métodos ... 31
Resultados ... 36
Discussão ... 39
Referências ... 43
Tabelas e figuras ... 46
4- ARTIGO ORIGINAL 2: Fatores associados à Limitação de Atividades Habituais na população de Belo Horizonte, MG, Inquérito Domiciliar sobre Comportamentos de Risco e Morbidade Referida de Doenças e Agravos não Transmissíveis (InqDANT), 2003... 51
Resumo ... 54
Abstract ... 54
Introdução ... 55
Métodos ... 57
Resultados ... 60
Discussão ... 61
Referências ... 65
Tabelas e figuras ... 68
5- ARTIGO ORIGINAL 3: Vulnerabilidade à Saúde e Limitação de Atividades habituais: uma análise multinível ... 71
Resumo ... 73
Abstract ... 74
Introdução ... 75
Métodos ... 77
Resultados ... 81
Discussão ... 82
6- ARTIGO ORIGINAL 4: Assessing the Psychometric and Ecometric Properties of Neighborhood Scales in Developing Countries: Saúde em Beagá Study, Belo Horizonte, Brazil, 2008-2009 ………...
93
Abstract ... 95
Introdução ... 96
Métodos ... 98
Resultados ... 101
Discussão ... 103
Referências ... 108
Tabelas e figuras ... 112
7- CONSIDERAÇÕES FINAIS ... 118
8- ANEXOS ... ... 122
Anexo 1: Aprovação dos Inquéritos pelos Comitês de Ética em Pesquisa ... 122
17 Considerações Iniciais
O crescente processo de urbanização somado à rápida transição demográfica observada especialmente nos países em desenvolvimento tem acarretado importantes mudanças no modo de vida, nas condições de saúde e de adoecimento das populações. Em 2008, metade da população mundial já vivia em centros urbanos e estima-se que em 2030, dois terços da população residirá nessas áreas, especialmente naquelas com um milhão ou menos de habitantes. Os impactos dessas mudanças são ainda pouco conhecidos, demandando a realização de estudos com grupos populacionais que levem em conta, não só as questões individuais relacionadas à saúde, mas também e principalmente às relacionadas ao lugar onde se vive, especialmente nos centros urbanos1.
A idéia de que o contexto em que se vive tem influência sobre a saúde dos indivíduos não é nova e tem suas raízes na visão holística da tradicional medicina hipocrática2. Entretanto, particularmente a partir dos anos 90 é que se observou a expansão de estudos teóricos e empíricos investigando o papel dos fatores contextuais nos resultados de saúde2,3. O pressuposto de que o lugar em que se vive, para além das características individuais, contribui para os desfechos e manutenção da saúde parece ter surgido simultâneamente na sociologia, na geografia e na epidemiologia e desde então, vários investigadores dessas disciplinas fizeram contribuições significativas para o desenvolvimento de conhecimento neste campo2-5.
Segundo Diez Roux2, no campo da saúde pública e da epidemiologia, algumas tendências
contribuiram para a retomada dessa idéia. A primeira diz respeito à constatação de que as explicações baseadas no nível individual não capturavam importantes determinantes da saúde e portanto, eram insuficientes para a compreensão dos mecanismos causais envolvidos no processo saúde-doença.
1Caiaffa WT, Ferreira FR, Ferreira AD, Oliveira CDL, Camargos VP, Proietti FA. Saúde urbana: ―a cidade é uma estranha senhora, que hoje sorri e amanhã te devora‖. Ciência Saúde Coletiva. 2008;13(6):1785-96.
2Diez-Roux AV, Mair C. Neighborhoods and health. Ann. NY Acad. Sci. 2010, 1186:125-45.
3Pickett KE, Pearl M. Multilevel analyses of neighbourhood socioeconomic context and health outcomes: a critical review. J Epidemiol Community Health 2001;55: 111–122.
4 Macintyre S, Ellaway A, Cummins S. Place effects on health: how can we conceptualise, operationalise and measure them? Soc Sci Med
2002;55: 125–139.
5Cummins S, Curtis S, Diez-Roux AV, Macintyre S. Understanding and representing ‗place‘ in health research: A relational approach. Soc
18 A segunda tendência tem sido motivada pelo revitalizado interesse na compreensão sobre o impacto das desigualdades soc e diferenças raciais e étnicas na saúde.Considerando que o lugar de residência é fortemente modelado por esses fatores, as características da vizinhança podem fornecer informações importantes para a compreensão dessas desigualdades. A terceira tendência relaciona-se a percepção de que os esforços para a prevenção de doenças deveriam considerar os efeitos das políticas de saúde que não são tradicionalmente consideradas como políticas de saúde, mas que poderiam ter importantes implicações para a saúde, como políticas de habitação e de planejamento urbano. A quarta tendência foi estimulada pelo aumento da disponibilidade e popularidade de métodos especialmente adaptados aos estudos sobre o efeito da vizinhança sobre a saúde, como as técnicas de análise multinível e, mais recentemente, o desenvolvimento dos Sistemas de Informação Geográfica (GIS) e técnicas de análise espacial, que possibilitaram explorar o espaço de uma forma muito mais detalhada e sofisticada.
De fato, vários estudos têm relatado a associação entre os resultados de saúde e características da vizinhança, incluindo doenças cardiovasculares6, saúde mental7, atividade física8, percepção da saúde9, entre outros. Essas associações são observáveis mesmo após o controle pelas características individuais, confirmando o efetio independente do contexto de moradia nos eventos estudados.
Nesta perspectiva, torna-se fundamental entender mais profundamente, quais as dimensões do contexto afetam a saúde e ainda, como os eventos de saúde se comportam e são influenciados por cada uma dessas dimensões.
Entretanto, a utilização de indicadores de contexto não é tarefa simples.
Considerando que o contexto de moradia é permeado não só pelas características físicas e sociais, mas também pelas relações que se estabelecem entre o lugar e as pessoas, e entre as próprias pessoas que moram em um determinado lugar, mensurar o contexto torna-se um desafio.
6Daniel Kim, Ana V. Diez Roux, Catarina I. Kiefe, Ichiro Kawachi, and Kiang LiuDo Neighborhood Socioeconomic Deprivation and Low
Social Cohesion Predict Coronary Calcification? The CARDIA study. Am J Epidemiol 2010;172:288–298
7Mair, C., A.V. Roux & S. Galea. Are neighbourhood characteristics associated with depressive symptoms? A review of evidence. J. Epidemiol. Community Health 2008;62: 940–946, 948
8Kim, D., S. Subramanian & I. Kawachi. 2008. Social capital and physical health: as systematic review of the literature. In Social Capital and Health. Kawachi, I., S.Subramanian & D. Kim, Eds: 139–190. Springer. New York.
9Subramanian SV, Kawachi I. Whose health is affected by income inequality? A multilevel interaction analysis of contemporaneous and
19 Alguns indicadores de contexto advindos de diferentes fontes de dados têm sido utilizados na tentativa de elucidar a relação entre estas dimensões e a saúde.
Muitos estudos têm utilizado informações baseadas em censos nacionais ou locais, construídos por meio da agregação de características socioeconômicas dos residentes como proxy das características da vizinhança. Embora úteis, o uso de informações do censo tem limitações importantes, sendo a principal a dificuldade em se fazer inferências causais sobre os efeitos da vizinhança sobre a saúde, devido à confusão residual e dificuldade de extrapolação dos dados. Outra limitação é que, em algumas circunstâncias, as características socioeconômicas da vizinhança obtidas por dados censitários podem ser insuficientes para representar as características específicas de interesse para o estudo de determinado evento,
resultando em inferências incorretas10.
Na tentativa de medir atributos mais específicos para caracterizar a vizinhança física e social, algumas estratégias de mensuração têm sido propostas. Uma dessas abordagens é o uso da Observação Social Sistemática (OSS) da área de estudo, o que possibilita medir os atributos físicos e sociais que não são capturados de forma válida e confiável por informações censitárias ou por outros macro-indicadores11.
Outra técnica que tem sido útil é a utilização dos sistemas de informação geográfica (SIG) para a construção de medidas de disponibilidade e acessibilidade a uma variedade de recursos12. Estudos têm utilizado indicadores de oferta e qualidade de serviços, indicadores de vulnerabilidade social e econômica e indicadores locais de vulnerabilidade à saúde construídos com base em SIG.
Apesar de mais específicos, esses indicadores parecem não capturar atributos específicos da vizinhança, especialmente aqueles relacionados ao ambiente social, como capital social, coesão social e controle social.
Assim, outros estudos têm utilizado as informações sobre as percepções dos indivíduos sobre o seu local de moradia. Essas informações são geralmente obtidas em inquéritos populacionais, a partir de questionários aplicados aos moradores de determinada área e são utilizadas para analisar a relação da vizinhança com os resultados de saúde10. Esta técnica tem
se mostrado uma forma eficiente para caracterizar as condições da vizinhança,
10Echeverria Sandra E., Ana V. Diez-Roux, and Bruce G. Link. Reliability of self-reported neighborhood characteristics. Journal of Urban
Health: Bulletin of the New York Academy of Medicine, 2004 Vol. 81, No. 4,682-701.
11 Proietti FA, Oliveira CDL, Ferreira FR, Ferreira AD, Caiaffa WT. Unidade de contexto e observação social sistemática em saúde -
Conceitos e métodos. Physis 2008;18(3):469-482.
12 Moore, L.V., A.V.Diez Roux & S. Brines. Comparing perception-based and geographic information system (GIS)-based characterizations
20 especialmente quando a amostra é grande o suficiente para permitir a agregação dos entrevistados em áreas delimitadas, por meio de métodos apropriados10. Este processo de agregação sobre as percepções individuais pode resultar em uma medida mais válida das condições da vizinhança e permite avaliar construtos como a coesão social, que não podem ser medidos por meio de outras técnicas.
Outro desafio que se apresenta diz respeito à escolha de técnicas adequadas de análise para a avaliação da associação entre as características de contexto e eventos relacionados à saúde. Uma opção que tem sido cada vez mais utilizada na área da saúde é a análise contextual ou multinível, originalmente utilizada nas ciências sociais, demografia e economia. Tal metodologia permite a avaliação simultânea das características do ambiente e dos indivíduos, entre e dentro de áreas geográficas definidas, e a compreensão dos fatores proximais e/ou distais que interagem para produzir resultados adversos em saúde. Desse modo, pode-se discutir se as variações encontradas são resultantes de fenômenos ecológicos (características contextuais comuns a um conjunto de indivíduos que moram em um determinado lugar), e/ou se relacionam com efeitos composicionais (características dos indivíduos que compõem o conjunto de pessoas que vivem em uma determinada área)13.
O objetivo geral dessa tese foi avaliar o comportamento de diferentes indicadores de contexto em Belo Horizonte e sua associação com eventos relacionados à saúde, sob a perspectiva da Saúde Urbana.
A Saúde urbana é ramo da saúde pública que estuda os fatores de riscos das cidades, seus efeitos sobre a saúde e as relações sociais urbanas1.
O modelo conceitual aqui adotado é o proposto por Caiaffa et al (2008)1 adaptado de Galea & Vlahov14,que considera o ambiente urbano como um contexto amplo, incluindo, além dos
ambientes físico e social, as influências políticas e econômicas. Tem como ponto central o fato de que o ambiente social e o ambiente físico definem o contexto urbano e são modulados por fatores proximais - aqueles relacionados às condições urbanas de moradia e trabalho - e por fatores distais - influências mundiais, nacionais e municipais - operando em uma rede interligada. De acordo com o modelo, a influência de cada componente sobre o processo saúde-doença não é linear, ou seja, os fatores interagem entre si, mas também podem ter um efeito independente no resultado do processo1. (Figura 1)
21
Fonte: Caiaffa et al, 20084
Para os artigos desenvolvidos nessa tese, utilizaram-se como fonte de informações dois
inquéritos de saúde realizados em Belo Horizonte: o ―Inquérito Domiciliar sobre
Comportamentos de Risco e Morbidade Referida de Doenças e Agravos não Transmissíveis‖
(InqDANT) realizado no período de 2002-2003, pelo Instituto Nacional do Câncer (INCA) em parceria com a Secretaria de Vigilância em Saúde do Ministério da Saúde/Brasil (SVS) e
o ―Estudo Saúde em Beagá‖, desenvolvido pelo Observatório de Saúde Urbana de Belo
Horizonte, no período de 2008-200915.
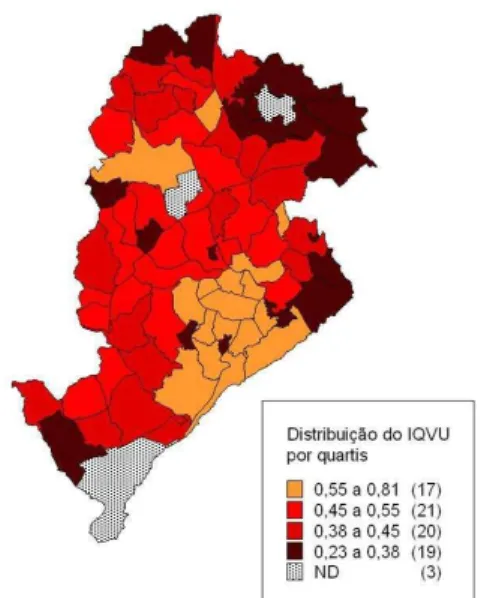
Como indicadores de contexto foram utilizados três diferentes fontes. A primeira foi o Índice de Qualidade de Vida Urbana de Belo Horizonte (IQVU), um indicador composto que visa dimensionar a oferta e qualidade de serviços e equipamentos públicos e privados no espaço intra-urbano, e assim, mensurar a qualidade de vida da população. Para construção do índice, informações sobre abastecimento, cultura, educação, habitação, infra-estrutura urbana, meio ambiente, serviços urbanos e segurança foram geocodificadas e agregadas nas 80 Unidades de Planejamento (UP) do município. A pontuação final do IQVU varia entre 0,0 e 1,0 sendo a maior pontuação correspondente à UP com uma melhor qualidade de vida urbana16. (Figura 2)
14Galea S, Vlahov D. Handbook of urban health: populations,methods, and practice. New York: Springer; 2005.
15Ministério da Saúde. Instituto Nacional do Câncer. Inquérito Domiciliar sobre Comportamentos de Risco e Morbidade Referida de Agravos
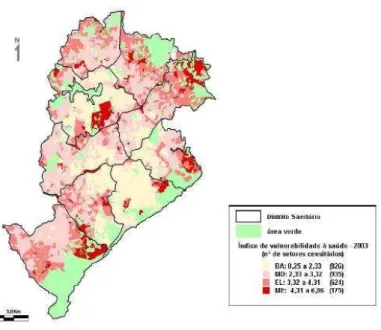
22 A segunda fonte informações utilizada como indicador de contexto foi o Índice de Vulnerabilidade à Saúde (IVS) da Secretaria Municipal de Saúde de Belo Horizonte16. O IVS também é um indicador composto que foi criado com o objetivo de identificar as desigualdades no perfil epidemiológico de grupos sociais distintos. Utiliza a metodologia GIS para geocodificar os indicadores saneamento, habitação, educação, renda, e indicadores sociais e de saúde nos setores censitários.
O índice é expresso em um escore final que varia entre 0,25 e 6,86, com os maiores valores correspondendo aos setores censitários com maior vulnerabilidade à saúde. A categorização do escore final segundo a pontuação média e o desvio-padrão, permitiu a identificação de quatro categorias de vulnerabilidade a saúde: risco baixo, risco moderado, risco elevado e risco muito elevado16.
A terceira fonte de informações de contexto foi criada a partir das informações sobre a percepção dos indivíduos sobre a sua vizinhança, utilizando-se a base de dados do ―Estudo Saúde em Beagá‖ e será apresentada como resultado dessa tese.
16Caiaffa WT, Nabuco AL, Friche AAL, Proietti FA. Urban Health and Governance Model in Belo Horizonte, Brazil. In: Vlahov D,
23 No intuito de explorar as diferentes representações do contexto, foram desenvolvidos quatro artigos.
O primeiro artigo teve como objetivo avaliar a associação entre o Índice de Qualidade de Vida Urbana de Belo Horizonte e três diferentes eventos relacionados à saúde – auto-avaliação de saúde, doenças crônicas e limitação funcional, utilizando informações do InqDANT. Apesar de diferentes, a escolha se deu pelo fato desses eventos terem em comum a já reconhecida associação com fatores ambientais. Este artigo foi submetido aos Cadernos de Saúde Pública e encontra-se em fase de avaliação.
O segundo artigo foi desenvolvido no sentido de descrever a variável resposta limitação para execução de atividades habituais (LAH -sinônimo de Limitação Funcional, utilizada no primeiro artigo) (InqDANT) – selecionada a partir dos resultados obtidos no primeiro artigo por ter sido mais associada ao indicador de contexto – e verificar sua associação com características individuais e com o Índice de Vulnerabilidade à Saúde de Belo Horizonte. Este artigo, aceito para publicação na Revista Médica de Minas Gerais, encontra-se no anexo desse volume (Anexo 3).
Como o segundo artigo foi exploratório e utilizou metodologia de análise bivariada, optou-se por desenvolver o terceiro artigo, que teve como objetivo avaliar a associação entre o Índice de Vulnerabilidade à Saúde e a variável resposta LAH (InqDANT), utilizando análise multinível. Nesse estudo foram calculadas duas medidas adequadas para modelos logísticos
24 multiníveis, que, no nosso conhecimento são inéditas em estudos brasileiros: a mediana do Odds Ratio (MOR) e o Intervalo de 80% do Odds Ratio (IOR-80%). Esse artigo será submetido à Revista de Saúde Pública.
A utilização da percepção dos indivíduos sobre a sua vizinhança motivou a realização do
quarto artigo, que foi desenvolvido com os dados do ―Estudo Saúde em Beagá‖. Os objetivos
desse artigo foram desenvolver medidas válidas e confiáveis do contexto, avaliar suas propriedades psicométricas e ecométricas e examinar os preditores individuais e de contexto, a partir da percepção dos indivíduos sobre a sua vizinhança. Esse artigo foi delinado e desenvolvido durante o período de estágio de doutorado na Universidade de Michigan, Ann Arbor, EUA, sob a supervisão da Dra. Ana V. Diez-Roux e será submetido ao Journal of Epidemiology and Community Health.
Nesse volume serão apresentados ainda os resultados preliminares de um quinto artigo, que utiliza as medidas desenvolvidas no quarto artigo – escalas que representam diferentes dimensões da vizinhança – para avaliar a associação com a variável LAH, utilizando dados do
25 Objetivos
Objetivo Geral
Avaliar a utilização e a adequação de indicadores de contexto na análise de eventos de saúde
Objetivos específicos
1. Avaliar a utilização do Índice de Qualidade de Vida Urbana (IQVU) como indicador de contexto e verificar a sua associação com Limitação Funcional, Auto-percepção de saúde e Doenças Crônicas em Belo Horizonte;
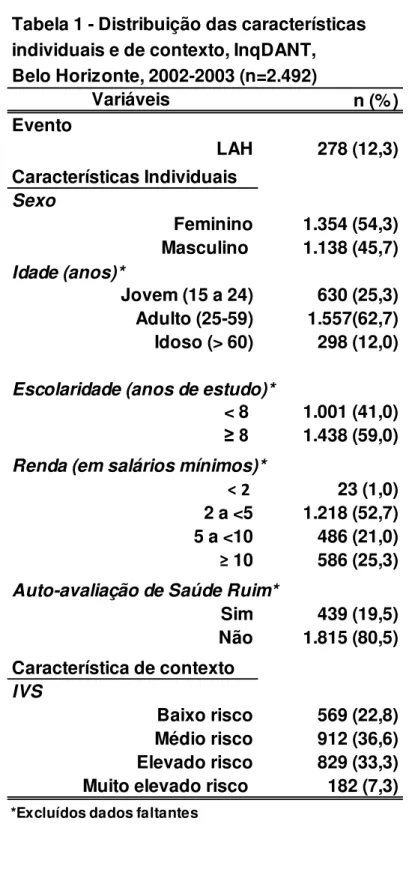
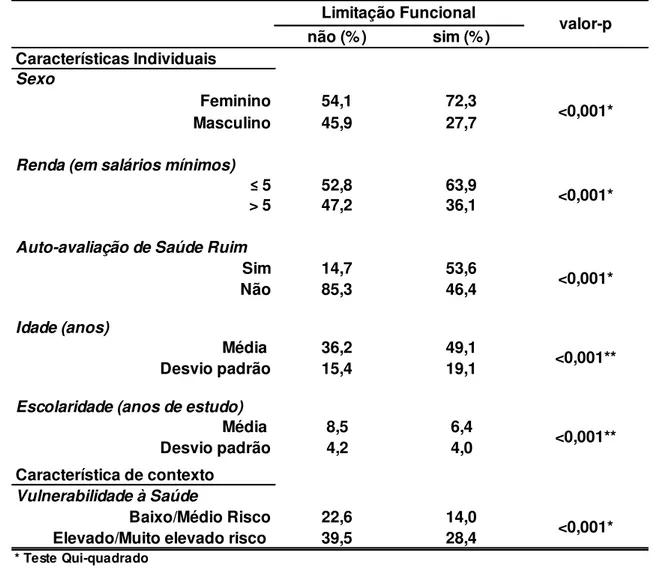
2. Descrever a prevalência de limitação para atividades habituais (LAH) em Belo Horizonte, sua associação com características individuais e sua distribuição segundo o Índice de Vulnerabilidade à Saúde (IVS).
3. Avaliar a utilização do Índice de Vulnerabilidade à Saúde (IVS) como indicador de contexto e verificar a sua associação com limitação para atividades habituais (LAH) 4. Desenvolver indicadores de contexto a partir da auto-percepção dos indivíduos sobre a
sua vizinhança, avaliar suas propriedades psicométricas e ecométricas e examinar os preditores individuais e de contexto associados à essas medidas;
27 Quality of Urban Life and Health: individual and contextual factors associated with self-rated health, chronic diseases and functional limitation.
Qualidade de Vida Urbana e Saúde: características individuais e de contexto associadas á auto-avaliação de saúde, doenças crônicas e limitação funcional
Amélia Augusta de Lima Friche1,2, Cibele Comini César1,2, Fernando Augusto Proietti1,2, Waleska Teixeira Caiaffa1,2
1 Graduate Program of Public Health, School of Medicine, Federal University of Minas
Gerais, Brazil
2 Belo Horizonte Observatory for Urban Health/ Federal University of Minas Gerais, Brazil
28 Resumo
Vários estudos têm relacionado a saúde humana aos fatores contextuais da vizinhança, mas poucos tem sido realizados em grandes cidades de países em desenvolvimento. O objetivo desse estudo foi avaliar os fatores individuais e de contexto associados à presença de Limitação Funcional, Auto-avaliação de Saúde e Doenças Crônicas na cidade de Belo Horizonte, à luz do IQVU.
Analisaram-se dados do inquérito domiciliar (2002-2003) sobre fatores de risco para doenças crônicas e morbidade referida e informações sobre disponibilidade de serviços e equipamentos urbanos – IQVU de Belo Horizonte (2006). Foram analisados três eventos –
limitação funcional, auto-percepção de saúde e doenças crônicas e sua associação com o IQVU por meio de regressão logística multinível múltipla
Dos 2255 indivíduos 56,3% eram mulheres, com idade média de 35,0+16,5 anos. As prevalências de limitação funcional, auto-percepção de saúde ruim e de doenças crônicas foi de respectivamente, 12,34% (IC95%:10,44-14,23), 19,23% (IC95%: 16,77-21,76) e 34,1%
[(95% CI: 31,0 – 37,3). Os três eventos foram associados aos menores scores do IQVU (1º. Quartil) na análise bivariada. Entretanto, após ajuste pelas variáveis individuais, somente a limitação funcional permaneceu associada ao IQVU (OR adjusted- 2.71 95% CI1.35-5.43). Nossos resultados sugerem que na população estudada, a Limitação Funcional pode ser mais afetada pelas barreiras ambientais do que a Auto-avaliação de saúde ruim e as Doenças Crônicas, afetando a performance dos indivíduos para a realização das atividades de vida diária.
29 ABSTRACT
A number of studies have related human health to contextual neighborhood factors but few have done this in large cities of developing or middle income countries. The aim of this project was to evaluate the individual and contextual factors associated with functional limitation, self-rated health and chronic diseases in the city of Belo Horizonte, in the light of the Quality of Urban Life Index (QULI). We analyzed data from the INCA household survey (2002-2003) on risk factors for chronic diseases and contextual information as captured by the QUIL in Belo Horizonte (2006). Three outcomes were studied: functional limitation, self-rated health and chronic disease. Multilevel logistic regression was used to assess association of these outcomes with the individual and contextual characteristics. Of the 2,255 subjects, 56.3% were women, with mean age of 35.0 ±16.5 years. The weighted prevalences for functional limitation, self-rated poor health and chronic diseases were, respectively, 12.34% (95% CI:10.44 -14.23), 19.23% (95% CI: 16.77-21.76) and 34.1% [(95% CI: 31.0 – 37.3). In bivariate analyses these three outcomes were associated with the lower scores of IQVU. However, after adjusting for individual variables, only functional limitation remained associated with worse IQVU (OR adjusted- 2.71 95% CI1.35-5.43). Our results suggest that in this population functional limitation may be most affected by environmental barriers affecting the performance of daily living activities.
30 INTRODUCTION
Increasing urbanization, combined with the rapid demographic transitions seen particularly in developing countries, has led to important changes in the way of life, including the health conditions and the illnesses of these urban populations1, 2.
As societies evolve new health problems emerge. From an era when contagious infectious diseases predominated, there has been a shift toward a preponderance of chronic diseases and
external causes. We‘ve gone from often lethal acute illnesses to pathologies of insidious
onset and long duration, whose course is often marked by a progressive reduction in functional capacity1,3,4.
Given this new paradigm, it is clear that the factors affecting human health include not only individual-level characteristics but also various contextual features of the environments where individuals live and work, including both physical and social environments as well as the availability of and access to essential services. Recognizing that individuals shape the communities where they live, and that the community also shapes the individuals, it becomes useful to understand which contextual dimensions may affect health directly or indirectly, as well as how health events behave and are influenced by each of these dimensions2,5,6,7.
The influences of physical and social environments on health can be divided into five neighborhood dimensions: physical conditions of the environment; availability of healthy environments for housing, work, and recreation; public and private services needed for daily activities (e.g. grocery shopping, public transportation); social and cultural resources; and the impression residents and public officials about their community, which we might call its
―reputation‖8,9.
31 Due to the complexity of the topic, challenges remain, among them the dearth of indicators which adequately measure the physical and social environment, and the difficulty in choosing data analysis techniques which are able to assess in a thorough fashion the possible associations between environment and health9,20-23.
Thus the aim of this work was to evaluate the individual and contextual factors associated with self-rated health, chronic diseases and functional limitations, in Belo Horizonte, Brazil, using the Quality of Urban Life Index (QULI) as a summary measure of contextual factors.
METHODS
This is a cross-sectional observational study based on data on the population living in the city of Belo Horizonte (BH), Minas Gerais state, Brazil, obtained as part of a national household survey conducted in 2002-2003. Information on local urban services and facilities captured by the Quality of Urban Life Index (QULI) was also used.
Data sources
Location of the study
The study was carried out in Belo Horizonte, the capital of the State of Minas Gerais, located in the Southeastern region of Brazil. In 2010, it had an estimated population of 2,375,444 inhabitants distributed in an area of 331 km2, giving it a population density of 7,176 inhabitants per km2. Belo Horizonte (B.H.) is Brazil‘s sixth most populous city, and between 1991 and 2006 it was the fourth fastest growing (16%) city (among the cities with more than 100,000 inhabitants). In 2010 Gross National Product (GNP) per capita was US$ 6,050 (R$ 13,636) and the Human Development Index (HDI) was high (0.839), even when compared to Brazil overall (HDI=0.699). The main economic activities are commerce and services (80%) and industry (20%). Although this, there are great inequalities in the distribution of education, health and wealth24,25.
32 the Brazilian Institute of Geography and Statistics (IBGE) 24. PUs are the geographical areas used for gathering socio-spatial data to support urban management and planning efforts like the Participatory Budgeting (PB) program, and for calculating indices such as the Quality of Urban Life Index (QULI) and Social Vulnerability Index (SVI) 25.
Individual level
Individual level data were obtained from the ―Household Survey of Risk Behavior and
Morbidity attributed to Noncommunicable Diseases‖ (InqDANT in Portuguese)26 carried out
in the 2002-2003 by the National Cancer Institute (abbreviated INCA in Portuguese) and the
Ministry of Health‘s Secretariat for Disease Surveillance. The InqDANT survey was a
multicity cross-sectional population-based study conducted in 15 Brazilian state capitals and the Federal District. The survey, registered as number 1053/2000, was approved by the National Ethics and Research Commission (CONEP).
The general objective of the InqDANT was to estimate the prevalence of exposure to behaviors and risk factors for noncommunicable diseases (NCDs), the prevalence of self-reported hypertension and diabetes, and the percentage of women who had access to early detection screening for breast and cervical cancer26.
The sample consisted of 23,457 subjects age 15 and older residing in the 16 cities. In each city, self-weighted cluster samples were obtained in two stages. The primary sampling units were the census tracts, with households the secondary sampling units. All members of the household age 15 or older were eligible, provided that they could respond to the questionnaire. Data was collected during face-to-face interviews which included questions addressing demographic and socio-economic characteristics of the household and questions administered to each member of the household aggregated into the following domains: occupational situation and exposure, physical activity, diet, smoking, alcohol consumption, perception of health and self-reported morbidity, quality of life and functional status, among others26.The questionnaire was developed based on instruments that were validated and tested in pilot studies. A detailed description of the sampling procedures is available at
33 For the present study, InqDANT data collected in the city of Belo Horizonte was used. According to the sampling process, 1,214 households distributed in 79 census tracts were considered eligible. Of these, 995 (82.0%) households – representing 52 of the city‘s 81
Planning Units – were visited and completed the household part of the survey. Of 2,492 eligible members of these households, 2,255 (90.5%) responded to the individual part of the questionnaire. (Figure 1)
Contextual-level
Data regarding the context was obtained from the Belo Horizonte Quality of Urban Life Index (QULI) for 2006. Since 1993, the Belo Horizonte City Planning Department, in partnership with the Pontifical Catholic University of Minas Gerais, has engaged in the iterative development of the index; necessary data was collected and the indices were calculated for 1994, 1996, 2000 and 2006.24 The QULI aims to gauge the quality of life for the population of
each Planning Unit by measuring the supply and quality of public and private services and facilities in the intra-urban space based on geocoded data25.
The QULI has been used by the municipal governments since 2000 as an important tool for management and allocation of resources, as for example, for the definition of criteria for distribution of financial resource of the Participatory Budget (PB).25
The index is expressed as a final score ranging between 0.25 and 0.81; higher scores means those PUs have a better quality of urban life25. The distribution of the QULI scores from
lowest to highest for 51 of the city‘s 81 Planning Units can be seen in Figure 2.
The latest (2006) version of the QULI consists of the following variables: supply, culture, education, housing, urban infra-structure, environment, health, urban services and security. Variables and their weights, components and indicators are shown in Figure 3.
Study Variables
34 The variable self-rated health was obtained by asking the question from the ―Perception of
one‘s health and self-reported morbidity‖ module of the household survey: ―Generally, in
comparison to people the same age as you, how do you consider your own health status?‖ Possible responses were ―Excellent‖, ―Very Good‖, ―Good‖, ―Average‖, ―Poor‖, ―Don‘t
know/Did not answer‖. Responses ―Excellent‖, ―Very Good‖ and ―Good‖ were grouped as
self-rated good health and responses ―Average‖ and ―Poor‖ were grouped as self-rated poor health.
The variable chronic diseases was formulated by combining the answers to the following
questions (each limited to a ―yes‖ or ―no‖ response), s: a) “Has any doctor told you that you
have or had one of the following diseases?”. 1. ―heart attack/myocardial infarction‖ and 2.
―angina or coronary artery disease‖; b) ―Has any doctor, nurse or community health worker
told you that you have high blood pressure?”; c) ―Has any doctor told you that you have diabetes?‖; and d) Has any doctor told you that you have cancer?‖
Individual responded ―yes‖ to one or more of these questions were classified as ―having a
chronic disease”. Those answering ―no‖ to all questions were classified as ―no chronic
disease”. The selection of chronic diseases was based on WHO criteria27.
The variable functional limitation was obtained by asking the question from the ―Quality of
Life and Functional Condition‖ module of the household survey: ―Do you have any limitation
or difficulty performing your usual tasks because of some health or disability-related
problem?‖ The answers were codified as ―no‖ (absence of functional limitation) and ―yes‖
(presence of functional limitation).
Due to characteristics of the sample and the methodology of administering the questionnaire, the number of individuals who responded was different for each outcome variable. Questions related to the variables self-rated health and functional limitations, were administered to all interviewees (age 15 and older) and those pertaining to chronic diseases, were administered to those individuals 25 years and older.
The following explanatory variables were used at the individual level (level 1): a) age:
categorized in three age groups: young (15 to 24), adult (25 to 59), and elderly (≥60); b)
35 to WHO criteria28: ―no‖ (not at risk – consumption ≤1 dose/day for women and ≤2 doses/day
for men) and ―yes‖ (at risk – consumption >1 dose/day for women and >2 doses/day for
men); e) number of individuals per bedroom: derived from data on the number of individuals in each household divided by the number of bedrooms, obtained by asking the question: How many rooms are functioning permanently as bedrooms? This variable was used as proxy for socio-economic status of individuals.
For all variables used at level 1, those who responded ―don‘t know‖ or who did not answer, as
well as missing data, were treated as unknown data and these cases were dropped.
At contextual level (level 2), the synthesis index for 2006 QULI was used and stratified into quartiles. The four groups obtained were classified as follows: Q1 –percentile ≤ 25, QULI <
0.38; Q2 – percentile 25-50, QULI between 0.38 and 0.45; Q3 – percentile 50-75, QULI between 0.45 and 0.54, and Q4 – percentile > 75, QULI > 0.54. The Q1 quartile corresponds to the worst quality of urban life and Q4 quartile to the best quality of urban life (Figure 2).
Analysis
All analyses were performed using STATA 10.0 software29. A descriptive analysis of all study variables was performed through measurement of central tendency and dispersion for all continuous variables and distribution of frequencies and percentages for all categorical variables.
Bivariate analysis was performed between each one of the dependent variables (self-rated health, chronic diseases, and functional limitation) and the explanatory variables (gender, age, schooling, alcohol consumption, number of individuals per bedroom, and QULI). The Chi-square test and t-test were used to verify the association between the variables at a 5% significance level and for 95% confidence intervals. All individual explanatory variables with a statistically significant association in the bivariate analysis with one of the outcomes were retained in the final models.
Next, multilevel multiple logistic regression analyses were performed30 for each outcome variable, in the following sequence:
36 2. Fit the model with a level 2 variable (QULI categorized in 4 groups);
3. Fit the complete model adding level 1 variables (individual level);
4. Comparison of models for each outcome variable using the likelihood ratio tests;
5. and residual analysis to assess the normality of level 2 error30.
Entry of individual level variables into the models was organized in three groups: demographic (gender, age) socio-economic (schooling, number of individuals per bedroom), and risk behavior (alcohol consumption).
Q4 (highest QULI scores), female gender, and 15-24-years age group (young) were considered the references for the functional limitation and self-rated health models. For the chronic diseases model the reference for age was the adult group (age 25-59).
RESULTS
Sample Characteristics
In 995 participating households distributed among 52 PUs in the city of Belo Horizonte, 2,255 individuals responded to the InqDANT survey. After linking both data sources, and excluding the data on 53 individuals who resided in a PU for which no QULI data was available, the sample had 2,202 individuals in 51 PUs.
Of these, 56.4% were females between 15 and 100 years old, with a mean age of 38.0 years (95% CI: 37.0 – 39.0), with schooling ranging from zero to 17 years of study, with a mean of 8.3 years (95% CI: 7.7 – 8.9), and living in households whose number of individuals per bedroom ranged from 0.5 to 6.0, with mean of 1.9 (95% CI: 1.8 – 2.0).
37 In this way, the self-rated health model had 2,146 individuals (56, or 2.5% had missing data), the chronic disease model had 1160 individuals (117, or 9.2%, had missing data) and the functional limitations model had 2,145 individuals (57, or 2.6%, had missing data).
Self-rated Health
The self-rated poor health was reported by 19.2% of the respondents [(95% CI: 16.8 – 21.8); n = 2,144], with mean age of 42.8 (95% CI: 40.9 – 44.8) and mean education of 6.26 years (95% CI: 5.60 – 6.92). The number of individuals per bedroom ranged between 1.0 and 6.0, with mean of 2.1 (95% CI: 1.89 – 2.21).
Poor self-rated health was associated, among individual characteristics, with female gender, advanced age (>= 60 years old), and less school (<8 years of study), and at the contextual level with the lowest QULI scores (Table 1).
The logistic multilevel regression analysis showed a statistically significant relationship between poor self-rated health and the QULI scores: Q1 (OR = 2.8; 95% CI: 1.7 - 4.8), Q2 (OR = 1.8; 95% CI: 1.1 - 2.9) and Q3 (OR = 1.9; 95% CI: 1.1 - 3.1) in the unadjusted model. However, in the adjusted model, this association disappeared. Several individual level variables remained associated with poor self-rated health: adult (OR = 1.4; 95% CI: 1.0 – 1.8) and elderly (OR = 1.9; 95% CI: 1.2 – 2.9) age groups, male gender (OR = 0.7; 95% CI: 0.6 –
0.9), greater schooling (OR = 0.9; 95% CI: 0.8 – 0.9), and higher number of individuals per bedroom (OR = 1.6; 95% CI: 1.0 – 1.3). (Table 2)
With the null model as the reference, there was a 33.3% reduction in the variance of the contextual level as individual level variables were introduced (composition effect) and a 17.2% reduction in the variance as the context variable was introduced (context effects). (Table 2)
Chronic Diseases
The prevalence of chronic diseases was 34.1% [(95% CI: 31.0 – 37.3); n=1,160], with a mean age of 55.6 (95% C: 54.0 – 57.1) and the mean years of schooling 7.3 years (95% CI: 6.0 –
38 In the bivariate analysis, the presence of chronic diseases was strongly associated with the following characteristics: female gender, older age group, and less schooling (<8 years of study) and with lowest QULI scores. (Table 1)
The unadjusted logistic regression model also revealed a statistically significant association between the presence of chronic diseases and the lowest QULI values (OR = 1.71; 95% CI: 1.08 – 2.67), but only the individual characteristics remained associated with chronic disease: the elderly (OR = 3.88; 95% CI: 2.75 – 5.47) and greater schooling (OR = 0.91/ 95% CI: 0.88 -0.95) remained associated in the adjusted model (Table 2).
In the model of chronic diseases, the inclusion of individual variables explained all of the association between the observations within the same context, and thus there was no residual intra-class correlation. (Table 2)
Functional Limitations
The prevalence of functional limitations was 12.3% [(95% CI: 10.4 -14.2), n=2,145], with mean age of 49.5 years (95% CI: 46.7 – 52.4) and mean education of 6.41 years (95% CI: 5.78 – 7.03). The number of individuals per bedroom ranged between 0.7 and 6.0, with a mean of 1.8 (95% CI: 1.7 – 2.0).
In the bivariate analysis the presence of a functional limitation was associated with female gender, older age group, less schooling (<8 years of study) and alcohol consumption considered risky, and with the QULI. (Table 1)
In the multilevel analysis, the unadjusted model showed significant association (OR = 2.8; 95% CI: 1.5 - 5.1) between functional limitation and first quartile (Q1) of the QULI. This association remained significant (OR = 2.7; 95% CI: 1.4 - 4.8), in the model adjusted by individual characteristics. The age groups adult (OR = 2.9; 95% CI: 1.8 – 4.6) and elderly (OR = 8.3; 95% CI: 4.7 – 14.5), male gender (OR = 0.5; 95% CI: 0.4 – 0.7) and greater schooling (OR = 0.9; 95% CI: 0.9 – 0.9) were the individual characteristics associated to functional limitations. (Table 2)
39 level 2 variance as individual level variable were introduced (composition effect) and a reduction of 34.2% as the contextual variable was introduced (context effect). (Table
DISCUSSION
The present study analysed the individual and contextual characteristics related to self-rated health, chronic diseases and functional limitations. Different results were found for each one of these events in terms of associations with the characteristics of the individuals and their quality of urban life. Differences between the units of analysis were explained not solely by the composition effect of the individuals, but also by the variability of the QULI.
The presence of chronic diseases and poorer self-rated health were both significantly associated with contextual characteristics only in the bivariate analysis. However, in the multivariate analysis, when individual characteristics were controlled these associations disappeared, leaving each solely (and independently) related to individual characteristics. Nevertheless, the presence of functional limitation was associated with contextual characteristics, both in the bivariate analysis and in the multivariate analysis.
In analyzing the multilevel models, it was observed that in the functional limitation model, most of the variation observed among Planning Units was explained by the contextual characteristics. On the other hand, the variation of the contextual level of the chronic diseases model was completely explained by individual characteristics without any contribution of compounding effects, nor of context effects. Thus the variation among the units of context in the self-rated health model can be explained by the characteristics resulting from the composition effect as well as the context effect.
Different findings for different outcomes suggest that individual health conditions need to be measured by multiple indicators, since each one has its own theoretical significance. Recent studies have found that socio-economical, physical and psychosocial characteristics have been increasingly associated with health outcomes, beyond the individual characteristics11,19,31,32.
40 spatial, social and environmental features and which measures the equity of access to goods and services25.
The QULI highlights the barriers that individuals face in their daily life in the urban environment, that transcend their individual characteristics. Therefore, the IQVU seems to relate more ―intrinsically‖ to the definition of functional limitation adopted here, than with self-rated health and chronic diseases, which justified the results found in the present study.
Limitations of functional capacity may have an important impact on the performance of usual tasks – both basic (those regarding self-care such as feeding, dressing, sleeping, etc.) and instrumental daily activities (skills to live in the environment such as going to the bank, shopping, etc)32,33.
According to the conceptual framework proposed by the International Classification of Functioning, Disability and Health (ICF), functional capacity is the result of a complex and
dynamic relationship between the individual‘s state of health and his or her personal, social
and environmental factors34.
In fact, studies assessing the presence of a functional limitation and its relationship with physical characteristics of the context have found an association between this event and adverse housing characteristics such as excessive noise, intense traffic, precarious public illumination and transportation, socio-economic conditions of the community, and the availability of services and resources18,32,33,35.
On the other hand, self-rated health is considered a good predictor of mortality and other
health outcomes, and reflects an individual‘s integrated perception about their health and
includes both biological and psychosocial dimensions.15 Several studies that used multilevel modelling and which evaluated the association of physical and psychosocial characteristics of the environment with self-rated poor health, found significant correlations with limited social support, poor social capital, feeble social cohesion, weak ties with the neighborhood, and low political engagement9,15,19,32.
41 incorporates more physical characteristics and services available in the PUs than psychosocial characteristics.
The absence of an association between chronic disease and the QULI suggests that these events are more related to the individual characteristics than to the neighborhood context, here represented by the availability and access to good and services. The lack of variability in the prevalence of chronic diseases, among and within the units of analysis also confirms the influence of individual characteristics associated with these outcomes, corroborating the findings of other studies16,18,27. Nevertheless, despite being heavily influenced by individual habits and behaviors, chronic diseases are preventable and modifiable based on interventions in the physical and social environment that can foster the adoption of healthy habits and behaviors27.
The use of the QULI appears to have been insufficient to distinguish the contextual characteristics that were relevant for chronic diseases, highlighting the need to conduct further studies to evaluate the association with other more specific measures of context.
Our findings should be considered in light of several limitations of our study. The first, concerns the use of PUs as cluster units (aggregates of census tracks), different than the units of the sample design of the InqDANT household survey, which used census tracts. This regrouping may have in some way influenced the analysis, not ensuring representativeness of the PUs.
The second limitation is the lack of temporal synchronicity of the data related to individuals collected in the 2002-2003 household survey, and the B.H. QULI contextual data gathered in 2006, which may have influenced the results.
The third limitation pertains to the variable chronic diseases. In addition to grouping four chronic diseases – cardiac diseases, diabetes, hypertension, and cancer – into a single variable, the number of individuals who responded to the InqDANT questions on chronic diseases and self-reported morbidity was about half the number who responded to the modules for the other two outcomes. This may have influenced the associations found.
While the presence of chronic diseases reflects a physical status, and self-rated health is a
42 behavioral obstacles that have an impact on the performance of activities of daily living (ADLs), which in turn, are affected by characteristics of the community in which you live10.
In this study, the worst quality urban life – represented by the first quartile of the QULI – was associated with the presence of a functional limitation, which, in turn is a direct indicator of how daily tasks and social activities can be shaped by adverse circumstances.
Self-rated health, on the other hand, reflects a subjective evaluation of how the environment can influence health and needs to be assessed considering the psychosocial characteristics of the context9,35.
The presence of chronic diseases proves to be a more distal indicator of the impact that context can have on health. It is noteworthy that, although they have chronic diseases, the individuals may not have functional limitations and are able successfully perform their ADLs. Therefore, the influence of the context may be more difficult to measure and demonstrate.
These findings reinforce the relevance of the construct represented by the QULI as a measure of physical dimensions, the availability of healthy environments, and the public and private services related to daily activities8,9,25.
Given this, one can conclude that the presence of a functional limitation seems to have a close relationship with lifestyle, with access to urban resources, and with the quality of urban life.
Considering that many of these limitations are permanent and require specialized care, their impact on quality of life can vary dramatically among the different population groups36,37. Nevertheless, functional capacity is a very subjective and complex issue, and beyond the conceptual questions and theoretical models still under development, the measurement and classification of these limitations is still tenuous36,38.
43 References
1. Vlahov D, Galea S, Gibble E, Freudenberg N. Perspectives on urban conditions and population health. Cad. Saúde Pública. 2005; 21(3):949-57.
2. Caiaffa WT, Ferreira FR, Ferreira AD, Oliveira CDL, Camargos VP, Proietti FA. Saúde
urbana: ―a cidade é uma estranha senhora, que hoje sorri e amanhã te devora‖. Ciência Saúde
Coletiva. 2008; 13(6):1785-96.
3. Vlahov D, Galea S. Urbanization, urbanicity, and health. J Urban Health. 2002; 79(4 Suppl 1):S1–S12.
4. Vlahov D, Freudenberg N, Proietti F, Ompad D, Quinn A, Nandi V, et al. Urban as a Determinant of Health. Journal of Urban Health: Bulletin of the New York Academy of Medicine. 2007; 84(Suppl 1):16–26.
5. Diez-Roux AV. Multilevel analysis in public health research. Annu Rev Public Health. 2000; (21):171-92.
6. Diez-Roux AV, Mair C. Neighborhoods and health. Ann N Y Acad Sci 2010; 1186:125–145 7. Diez Roux AV. Commentary: Estimating neighborhood health effects: the challenges of
causal inference in a complex world. Social Science & Medicine 2004a; 58:1953–60.
8. Macintyre S, Maciver S, Sooman A. Area, class and health: should we be focusing on places or people? J Soc Policy 1993; 22:213-34.
9. Santos SM, Chor D, Werneck GL, Coutinho ESF. Associação entre fatores contextuais e auto-avaliação de saúde: uma revisão sistemática de estudos multinível. Cad Saúde Pública. 2007; 23(11):2533-2554.
10. Li YS, Chuang YC. Neighborhood effects on an individual‘s health using neighborhood
measurements developed by factor analysis and cluster analysis. J Urban Health. 2008; 86(1):5-18.
11. Belbeisi A, Zindah M, Walke HT, Jarrar B, Mokdad AH. Health related quality of life measures by demographics and common health risks, Jordan 2004. Int J Public Health. 2009; 54:S1–S5.
12. Caiaffa WT, Almeida MCM, Oliveira CL, Friche AAL, Matos SG, Dias MAS, et al. O Urbano sob o Olhar da Saúde: o Caso de Belo Horizonte, Minas Gerais, Brasil. Cad Saúde Publica. 2005; 21(3):958-67.
44 14. Fan AZ, Strine TW, Muppidi SR, Greenlund KJ, Croft JB, Berry JT, et al. Psychological distress associated with self-reported high blood pressure and high blood cholesterol in U.S. adults, 2007. Int J Public Health. 2009; 54:S1–S6.
15. Kawachi I, Kennedy BP, Glass R. Social capital and self-rated health: A contextual analysis. American Journal of Public Health. 1999; 89(8):1187.
16. Li C, Ford ES, Zhao G, Strine TW, Dhingra S, Barker L, et al. Association between diagnosed diabetes and serious psychological distress among U.S. adults: the Behavioral Risk Factor Surveillance System 2007. Int J Public Health. 2009; 54:S1–S9.
17. McGuire LC, Strine TW, Vachirasudlekha S, Anderson LA, Berry JT, Mokdad AH. Modifiable characteristics of a healthy lifestyle and chronic health conditions in older adults with or without serious psychological distress, 2007 Behavioral Risk Factor Surveillance System. Int J Public Health. 2009; 54:S1–S10.
18. Strine TW, Chapman DP, Balluz LS, Moriarty DG, Mokdad AH. The Associations Between Life Satisfaction and Health related Quality of Life, Chronic Illness, and Health Behaviors among U.S. Community-dwelling Adults. J Community Health. 2008b; 33:40–50.
19. Subramanian SV, Kawachi I. Whose health is affected by income inequality? A multilevel interaction analysis of contemporaneous and lagged effects of state income inequality on individual self-rated health in the United States. Health Place. 2006; 12:141-56.
20. Diez Roux AV. Bringing context back into epidemiology: variables and fallacies in multilevel analysis. American Journal of Public Health. 1998; 88(2):216-22.
21. Proietti FA, Caiaffa WT. Editorial Fórum de Saúde Urbana: What is urban health? Cad Saúde Pública. 2005; 21(3):940-1.
22. Diez Roux AV. The Study of Group-Level Factors in Epidemiology: Rethinking Variables, Study Designs, and Analytical Approaches. Epidemiol Rev. 2004b; 26:104–11.
23. Auchincloss A H, Diez-Roux A V. A New Toll for Epidemiology:The Usefullness of dynamic-agent models in understanding place effects on health. Am J Epidemiol 2008; 168:1–8.
24. Instituto Brasileiro de Geografia e Estatística (IBGE). Cidades @ 2010; Available at:
http://www.ibge.gov.br/cidadesat/topwindow.htm?1 Accessed December 15, 2010.
45 26. Ministério da Saúde. Instituto Nacional do Câncer. Inquérito Domiciliar sobre Comportamentos de Risco e Morbidade Referida de Agravos não Transmissíveis. Brasília: Secretaria de Vigilância em Saúde; 2003. Disponível em <http://www.inca.gov.br/inquerito/>. Accessed 07 March 7. 2009.
27. World Health Organization. Preventing chronic diseases: a vital investment. WHO global report. Geneva: World Health Organization; 2005. 182p.
28. World Health Organization. International guide for monitoring alcohol consumption and related harm. Geneva: WHO, 2000.
29. Stata Corporation. Stata statistical software, release 9. College Station, TX: Stata Corporation; 2005.
30. Twisk JWR. Practical Guides to Biostatistics and Epidemiology: Applied Multilevel Analysis. New York: Cambridge University Press; 2007.
31. Glass TA, Baulfour JL. Neighborhood, aging and functional limitations. In: Kawachi I, Berkman LF. Neighborhood and health. New York : Oxford University Press; 2003. p. 303-335.
32. Szwarcwald CL, Souza-Júnior PRB, Esteves MAP, Damascena GN, Viacava F. Determinantes sóciodemográficos da auto-avaliação da saúde no Brasil. Cad Saúde Pública 2005; 21(Suppl 1):S54-64.
33. Brownson RC, Haire-Joshu D, Luke DA. Shaping the context of health: A Review of Environmental and Policy Approaches in the Prevention of Chronic Diseases. Annu. Rev. Public Health. 2006; 27:341–70.
34. World Health Organization Page. International Classification of functioning, disability and health: ICF. World Health Organization 2001.
35. Alazraqui M, Diez-Roux AV, Fleisher N, Spinelli H. Salud auto-referida y desigualdades sociales, ciudad de Buenos Aires, Argentina, 2005. Cad Saúde Pública 2009; 25(9):1990-2000.
36. Clarke P, Ailshire J A, Bader M, Morenoff J D, House J S. Mobility disability and Urban Built Environment. Am J Epidemiol 2008; 168:506–513.
37. Ferreira F R, César C C, Camargos V P, Lima-Costa M F, Proietti F A. Aging and Urbanization: The Neighborhood Perception and Functional Performance of Elderly Persons in Belo Horizonte Metropolitan Area—Brazil. J Urban Health 2009; 87(1):54-66.
46
Figure 1. Distribution of households and individuals of the sample, according to their situation in the study in Belo Horizonte, 2002-2003 Households Selected 1214 Households with Occupants 1069 (88.1%) Vacant Households 125 (10.3%) Nonexistent Households 20 (1.7%) Household Declined 48 (4.5%)
Didn‘t participate for some other
reason 26 (2.4%)
Participating Households
995 (93.1%)
Eligible Individuals
2492
Individual Participants
2255 (90.5%) Didn‘t participate for
some other reason
136 (5.5%) Individual
Declined
47
48 Figure 3 – Quality of Urban Life Index and its components, weights and data sources, Belo Horizonte, 2006
Indicators Weight Data Sources
Supply
0.08 . area in m2 of:
supermarkets/population
butcher shops and similar establishments/population restaurants and similar establishments/ population
Culture
0.03 . circulation of local publications/population X 1000 inhabitants . number of registered landmarks
. number of cultural facilities/population X 1000 inhabitants
. area in m2 of book stores and stationery stores/population x 1000 inhabitants
Education
0.13 . % of students in 6 to 15 age group enrolled in primary schooling . number of students in primary schooling/ number of sessions . % of students in 14 to 17 age group enrolled in high school . number of students in high school / number of sessions . % of promoted students
Housing 0.19 . m
2 of adequate area/population
. score for medium standard of housing in relation to the classification of Urban Building and Property Tax – IPTU
Urban Infrastructure
0.17 . % of households with: potable water, sewage system , electric energy, telephone line
. % of paved roads
. number of vehicles/population . average age of the fleet of vehicles
Environment 0.07 . number of noise occurrences registered by the Military Police of Minas Gerais/population x 100
Health
0.14 . number of :
hospital beds/population x 1000 health centers/population x 1000
other health equipment/population x 1000 dental equipment/population x 1000 Urban
Services
0.11 . number of:
bank branches/population x 1000 newsstands /population x 1000 public telephones /population x 1000
Urban Safety
0.08 .maximum value of:
homicides in the city – value of homicides in PU/population x 1000
attempted homicides in the city – value in PU/population x 1000
instances of theft or robbery in the city – value in PU/population x 1000
incidents of theft of vehicles – value in PU/population x 1000