www.hydrol-earth-syst-sci.net/20/3777/2016/ doi:10.5194/hess-20-3777-2016
© Author(s) 2016. CC Attribution 3.0 License.
Spatio-temporal trends in the hydroclimate of Turkey for the last
decades based on two reanalysis datasets
Mustafa Gokmen1,2
1The Ministry of Environment and Urbanization, Ankara, Turkey
2The Research Association of Rural Environment and Forestry, Ankara, Turkey
Correspondence to:Mustafa Gokmen (mustaf.gokmen@gmail.com)
Received: 14 January 2016 – Published in Hydrol. Earth Syst. Sci. Discuss.: 19 February 2016 Revised: 30 June 2016 – Accepted: 22 August 2016 – Published: 13 September 2016
Abstract. We present a regional assessment of the spa-tiotemporal trends in several hydro-climate variables from 1979 to 2010 in Turkey, one of the countries of the eastern Mediterranean vulnerable to climate change, using the two reanalysis products of the ECMWF: Interim and ERA-Interim/Land. The trend analysis revealed that an average warming of 1.26◦C [0.8–1.8] occurred in Turkey from 1979
to 2010, with high confidence intervals (95–99 %, mostly). Geographically, the largest warming (up to 1.8◦C) occurred
in the western coastal areas next to the Aegean Sea and in the southeastern regions. The air temperature trends were gener-ally confirmed by the in situ data from about 100 weather stations around the country, though in situ data indicated slightly higher trends ranging from 1 to 2.5◦. With respect
to the regional trends in hydrological variables, ERA-Interim and ERA-Interim/Land revealed quite different pictures: the ERA-Interim dataset indicated that there have been signif-icant decreasing trends of precipitation, snow water equiv-alent (SWE) and runoff in some parts of inner/southeastern Anatolia (a total decrease of up to 250 mm in the upstream of the Euphrates, Kizilirmak and Seyhan basins), while ERA-Interim/Land showed no or minor trends in the same ar-eas. Based on the extensive comparisons with precipitation and SWE gauge data, we can suggest that the hydrologi-cal trends shown by the ERA-Interim/Land dataset, which is said to be a model improvement, are relatively closer to the observations. From the hydrological trends revealed by the ERA-Interim/Land dataset, we can conclude that, despite the strong warming trends over Turkey from 1979 to 2010, there have been no widespread and strong hydrological trends for the same period throughout the country. In this regard, we can suggest that the impacts of global warming on the water
cycle are not straightforward, especially at the regional scale, and future climate simulations indicating considerable reduc-tions in precipitation along with the significant increases in temperatures throughout the Mediterranean and the Middle East by the end of the twenty-first century need to be dealt with cautiously.
1 Introduction
The future climate simulations show that the Mediterranean region is one of the most vulnerable zones in the world. The climate models consistently predict that Mediterranean basin will be affected adversely by climate change in the future (Giorgi and Lionello, 2008; Lelieveld et al., 2012; Ozturk et al., 2014; Önol et al., 2014; Önol and Semazzi, 2009; Türke¸s et al., 2011), while IPCC reports (2007, 2014) indicating sig-nificant increases in temperatures besides considerable re-ductions in precipitation throughout Mediterranean and the Middle East by the end of the twenty-first century. Obser-vational records and climate projections provide abundant evidence that freshwater resources are vulnerable and have the potential to be strongly impacted by climate change, with wide-ranging consequences for human societies and ecosys-tems (Yucel et al., 2014). Milly et al. (2005) report 10–30 % reductions in runoff in the Middle East by the year 2050.
mis-sion, Voss et al. (2013) indicated an alarming rate of decrease in total water storage in the northern–central Middle East from 2003 to 2009. Yucel et al. (2014) investigated the re-gional trends in hydroclimatic variables in eastern Anatolia, Turkey, between 1970 and 2010 based on the streamflow and meteorological point measurements. The seasonal snowmelt runoff in the mountainous basins of eastern Turkey has ex-perienced changes over the past several decades (Sen et al., 2011; Sönmez et al., 2014). Sen et al. (2011) indicate that streamflow timings of the Euphrates and Tigris rivers shifted to the earlier days between two consecutive 17-year periods (i.e., 1972–1988 and 1990–2006).
Detection of trends and their significance with confidence generally requires consistent and long-term records of vari-ables considered, especially in the case of detecting climate-change-driven trends (Gokmen et al., 2013a). As stated by Leroy et al. (2008), it is obvious that the longer the time series, the easier it should be to distinguish a trend from natural variability (and measurement uncertainty), because shorter periods of record generally have small signal-to-noise (S / N) ratios (Allen et al., 1994). Based on a hypo-thetical data set with certain statistical characteristics, Leroy et al. (2008) determined the minimum detection time as about 33 years for detecting a global warming signal of 0.2 K decade−1. Similarly, assessing the trend consistency
over a range of timescales (from 10 to 32 years), Santer et al. (2011) state that multi-decadal records are required to identify the human effect on the climate variables (e.g., tem-perature) with high statistical confidence.
The time series of temperature data from meteorological stations are widely used to assess the historical trends; how-ever, as highlighted by Sen et al. (2011), point measurements of temperature come with important shortcomings such as inadequate representation of mountainous areas and contam-ination by urban heat island effects, as most stations are lo-cated in cities (e.g., Ezber et al., 2007).
Reanalysis products provide invaluable temporally and spatially continuous information on various atmospheric variables ranging from near-surface temperature, wind and solar radiation components to hydrological parameters in-cluding precipitation, evapotranspiration and runoff. Besides the weather forecast services, one of the primary aims of the reanalysis product by the European Centre for Medium-Range Weather Forecasts (ECMWF) is stated to construct a long-term homogeneous record of the atmosphere, which is achieved by systematic assessment, inter-calibration, and integration of the observational record in the context of physical models (Dee et al., 2011). Simmons et al. (2010) show that surface temperature and humidity trends from 45-year ECMWF Re-Analysis (Era-40; Uppala et al., 2005) and ERA-Interim are in excellent agreement with estimates ob-tained from climatological land station data from the Hadley Centre. Balsamo et al. (2010) evaluated the suitability of ERA-Interim precipitation estimates for land applications at various timescales from daily to annual over the
contermi-nous USA. Decker et al. (2012) showed that the land sur-face evaporation of ERA-Interim compared favorably with the flux tower observations and with other reanalysis. The results of the studies based on reanalysis were also used in the 5th Assessment Report (IPCC, 2014), which state that adequacy of trend detection using reanalysis data depends on the variable under consideration, the time period and the region of interest. For example, surface air temperature and humidity trends over land in the ERA-Interim reanalysis compare well with observations (Simmons et al., 2010), but polar tropospheric temperature trends in ERA-40 disagree with trends derived from radiosonde and satellite observa-tions (Bitz and Fu, 2008; Grant et al., 2008; Graversen et al., 2008; Screen and Simmonds, 2011). Recently, ECMWF has introduced a new product, namely ERA-Interim/Land, which incorporates the up-to-date land model developments by combining near-surface meteorological fields from ERA-Interim with the latest version of the HTESSEL land surface model (Hydrological Tiled ECMWF Scheme for Surface Ex-changes over Land), which is an extension of the TESSEL scheme (van den Hurk et al., 2000) used in ERA-Interim. Balsamo et al. (2015) state the added-value components of ERA-Interim/Land as soil, snow and vegetation description upgrades, as well as a bias correction of the ERA-Interim monthly accumulated precipitation based on GPCP v2.1.
In this study, we utilized reanalysis datasets of ECMWF (both ERA-Interim and ERA-Interim/Land) to analyze the spatiotemporal trends in several hydro-climate variables (i.e., near-surface air temperature, precipitation, snow wa-ter equivalent, runoff and evapotranspiration) at the regional scale. More specifically, this study aims at
– determining the significance and magnitude of the hydro-climatic trends over the last decades (from 1979 to 2010) in a spatially distributed manner,
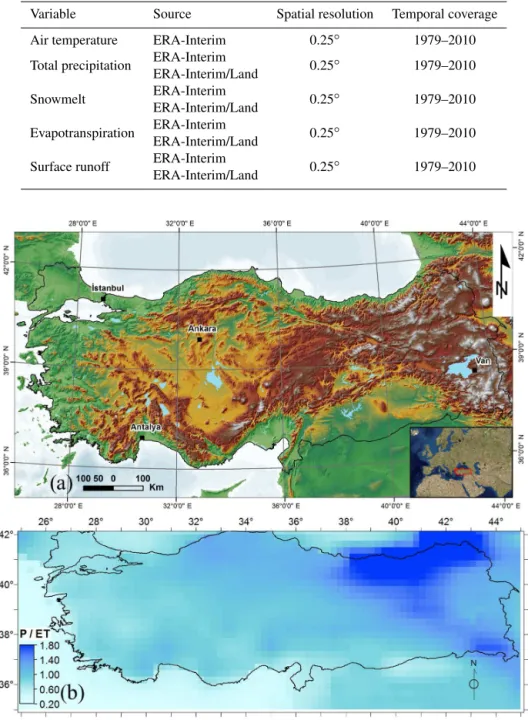
Table 1.The summary of the reanalysis data used in the study.
Variable Source Spatial resolution Temporal coverage
Air temperature ERA-Interim 0.25◦ 1979–2010
Total precipitation ERA-Interim 0.25◦ 1979–2010
ERA-Interim/Land
Snowmelt ERA-Interim 0.25◦ 1979–2010
ERA-Interim/Land
Evapotranspiration ERA-Interim 0.25◦ 1979–2010
ERA-Interim/Land
Surface runoff ERA-Interim 0.25◦ 1979–2010
ERA-Interim/Land
Figure 1. (a)The geographic location and the topography of the study area and(b)the distribution of the average of the precipitation to evapotranspiration ratio as estimated from the ERA-Interim/Land dataset for the 1979–2010 period.
2 Materials and methods 2.1 The study area
Turkey is situated in Anatolia (97 %) and the Balkans (3 %), bordered by the Black Sea in the north, and the Aegean Sea and the Mediterranean Sea in the west and the south (Fig. 1a). Due to its complex terrain and the long land–sea boundary in-teractions, the climate of the country varies from the Mediter-ranean (in the coastal areas in the west and south) to the
in the Aegean and Mediterranean coasts, while the eastern coast of the Black Sea receives the greatest amount, with over 2000 mm annual rainfall (Bozkurt and Sen, 2011).
2.2 Methods
The time series of temperature and all the hydrologic variables were analyzed using the Mann–Kendall non-parametric test for detecting the significance and the direc-tion of the trend. Mann (1945) originally used this test and Kendall (1975) subsequently derived the test statistic distri-bution. The Mann–Kendall test has two parameters that are of importance for trend detection: the significance level that indicates the trend’s strength (pvalue) and the slope magni-tude (Kendall’s tau) estimate that indicates the direction as well as the magnitude of the trend. After detecting the signif-icance level and the direction of trends by the Mann–Kendall test, the magnitudes (slopes) of trends were determined using linear models.
In order to apply the trend analysis in a spatially dis-tributed manner, the Mann–Kendall test was applied using the R software and the Kendall package for R (http://cran. r-project.org/web/packages/Kendall/Kendall.pdf).
2.3 Data
In this study, we used two different reanalysis products by ECMWF: ERA-Interim and ERA-Interim/Land (which will be referred to as Interim/Land from here on). Table 1 pro-vides a summary of the variables that were considered for the trend analyses.
The ERA-Interim atmospheric reanalysis is built upon a consistent assimilation of an extensive set of observations (typically tens of millions daily) distributed worldwide (from satellite remote sensing, in situ, radio sounding, profilers, etc). Besides ERA-Interim, we also used a new product by ECMWF, namely Interim/Land. Balsamo et al. (2015) in-dicate that Interim/Land is produced by combining near-surface meteorological fields from ERA-Interim with the lat-est version of the HTESSEL land surface model. HTESSEL is an extension of the TESSEL scheme (van den Hurk et al., 2000) used in ERA-Interim. HTESSEL includes an im-proved soil hydrology (Balsamo et al., 2009), a new snow scheme (Dutra et al., 2010), a multiyear satellite-based veg-etation climatology (Boussetta et al., 2013), and revised bare soil evaporation (Balsamo et al., 2011; Albergel et al., 2012). The original ERA-Interim is produced at T255 spectral resolution (about 80 km) and covers the period from Jan-uary 1979 to the present, while Interim/Land covers the period between 1979 and 2010. To allow comparison, we used 1979–2010 as the study period for both datasets. Also, we used a spatially rescaled version (0.25×0.25◦) of the
datasets as provided by ECMWF.
In addition to the reanalysis datasets, in situ data of air temperature from nearly 100 meteo-stations (unpublished
Figure 2.The comparison of the(a)presence of the significant air temperature trends at different levels of statistical significance and (b)the magnitudes of 32-year total air temperature trends between the ERA-Interim dataset and the meteo-stations. In(a)upward tri-angles/circles indicate the presence/absence of increasing trends by the stations, while the colors indicate the degree of the significance.
data from the Turkish Meteorological Service), precipitation from nearly 80 rain gauges (unpublished data from the Turk-ish Meteorological Service) and snow measurements from six stations (unpublished data from State Hydraulic Works, DSI) were used for necessary comparisons. The details of calculating snow water equivalent (SWE) from in situ snow measurements are described in Gokmen et al. (2013b).
3 Hydro-climate trends 3.1 Air temperature
As the Interim/Land product mainly focused on model up-dates related to the hydrological variables and did not in-clude an air temperature output, here only the results from ERA-Interim are presented, together with the in situ data dis-tributed over the country. Figure 2a shows that, apart from the eastern region, Turkey has experienced significant increases in air temperature from 1979 to 2010, whose distribution is generally confirmed by the trends detected for the in situ measurements. The significance level for the increasing tem-perature trends was high (p< 0.01–0.05) in most of the coun-try. The non-significant trend region in eastern Anatolia cor-responds to the relatively high-altitude region of the country with complex topography (Fig. 1a).
Figure 3. (a) The comparison of the average yearly temperature between (all) the stations (shown in Fig. 2) and the corresponding grids from the ERA-Interim dataset.(b)The comparison of the total 32-year increase in temperatures by the meteo-stations and the cor-responding grids from the ERA-Interim with respect to elevation.
(western coastal areas and in the southeastern regions), as shown in Fig. 2b. While the in situ data from weather stations generally agree with the distribution of the total warming, the increase was slightly higher, ranging from 1 to 2.5◦.
Showing the comparison of the yearly average air temper-ature of (all) the stations with the average of the correspond-ing grids from ERA-Interim, Fig. 3a indicates systematically higher temperatures by in situ measurements (about 1.8◦),
but a similar rate of increase is confirmed by the slope of the fitted trend lines for both in situ data and ERA-Interim. The higher yearly average temperature of the stations can gen-erally be attributed to the fact that the in situ measurements not only represent the local environment at lower altitudes inside a grid (as the stations are usually installed at lower al-titudes for ease of maintenance) compared to the 80 km orig-inal resolution of ERA-Interim, but that they are also more prone to urban heating effects. Assessing the total tempera-ture increases by the meteo-stations and the corresponding ERA-Interim grids with respect to elevation, Fig. 3b shows that the temperature increases are higher in the lowlands and relatively lower at the higher altitudes, as indicated by both
the ERA-Interim and meteo-stations, apart from the gener-ally higher total increase by the in situ data.
3.2 Total precipitation
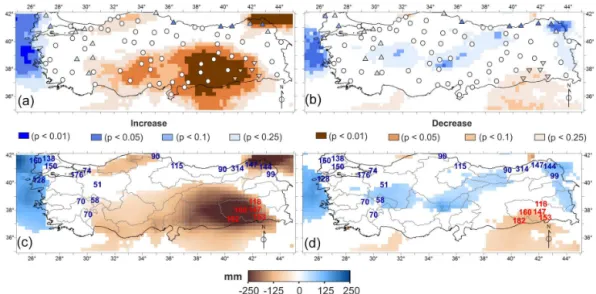
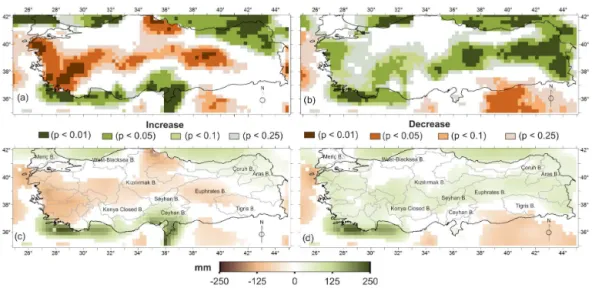
In ECMWF Reanalysis, total precipitation, which includes rain and snow, is estimated as the sum of convective pre-cipitation and large-scale prepre-cipitation. With respect to total precipitation trends, ERA-Interim (Fig. 4a) and Interim/Land (Fig. 4b) reveal quite different pictures: except for the west-ern part and some of the southeastwest-ern regions, the signifi-cance and direction of the precipitation trends are indicated as highly different by ERA-Interim and Interim/Land in most of the study area. When these trends are compared with the in situ measurements, the trends of the in situ data are rela-tively closer to the precipitation trends of Interim/Land rather than ERA-Interim. Especially the widely decreasing trends indicated by ERA-Interim in the southern/southeastern and northeastern regions are not confirmed by the non-significant trends indicated by the stations (Fig. 4a). For these regions there is a general agreement between Interim/Land and the stations (Fig. 4b). The only region where ERA-Interim and Interim/Land both indicate significant increasing precipita-tion trends is the western region, which is confirmed by in situ data, especially in the northwest.
In terms of the magnitude of trends (Fig. 4c and d), while the in situ data indicate a range of 50–150 mm total in-crease/decrease in precipitation (1979–2010 period) at the significant trend locations (except for a 314 mm increase at Rize station in the northeast), ERA-Interim indicated a total decrease in precipitation of as high as 250 mm in some parts of the southeast and northeast (Fig. 4c), and Interim/Land showed a decrease of up to 120 mm in the southeast and a 50– 150 mm total increase in the areas with significant increasing trends.
Figure 4.The comparison of the presence of the significant total precipitation trends by(a)ERA-Interim vs. in situ data and(b)Interim/Land vs. in situ data. The comparison of the magnitudes of 32-year total precipitation trends by (c)ERA-Interim vs. in situ data and(d) In-terim/Land vs. in situ data. In (a)and (b), the upward/downward triangles indicate the significant increasing/decreasing trends, circles indicate no trend and the colors indicate the degree of the significance. In(c)and(d), the numbers indicate the total increasing/decreasing trends observed at the stations that have significant trends. The polygons in(c)and(d)delineate the 26 water basins in the country.
Figure 5.The magnitudes of the total precipitation trends (32-year total) by ERA-Interim for(a)winter,(b)spring,(c)summer and(d) au-tumn. Only the areas with significant trends (p< 0.1) are shown on each map. The polygons in each figure delineate the 26 water basins in the country.
3.3 Snow water equivalent
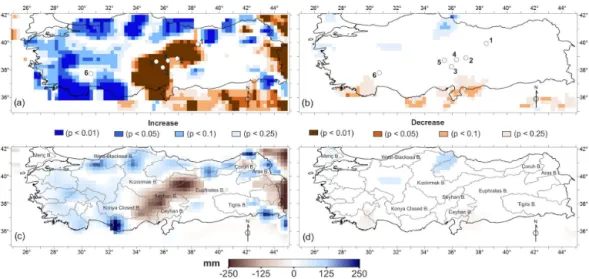
Runoff from snowmelt-dominated basins in the mountainous and semi-arid regions of eastern Turkey accounts for 60– 70 % of the total annual runoff for the region (DSI, 2009). Therefore, inter-annual changes in snowfall quantities are especially important for the mountainous regions in east-ern Anatolia. According to the ERA-Interim dataset (Fig. 7a and c), there have been highly significant decreasing trends (p< 0.01) of snow water equivalent (SWE) in the upstream parts of the Euphrates, Kizilirmak and Seyhan basins: up to 250 mm decrease in total for the 32-year study period. Apart
in-Figure 6.The magnitudes of the total precipitation trends (32-year total) by Interim/Land for(a)winter,(b)spring,(c)summer and(d) au-tumn. Only the areas with significant trends (p< 0.1) are shown on each map. The polygons in each figure delineate the 26 water basins in the country.
Figure 7.The distribution of the presence and the direction of snow water equivalent (SWE) trends by(a)ERA-Interim and(b)Interim/Land. The magnitudes of 32-year total SWE trends by(c)ERA-Interim and(d)Interim/Land. The circles with the numbers indicated the locations of snow-gauge stations. The polygons in(c)and(d)delineate the 26 water basins in the country.
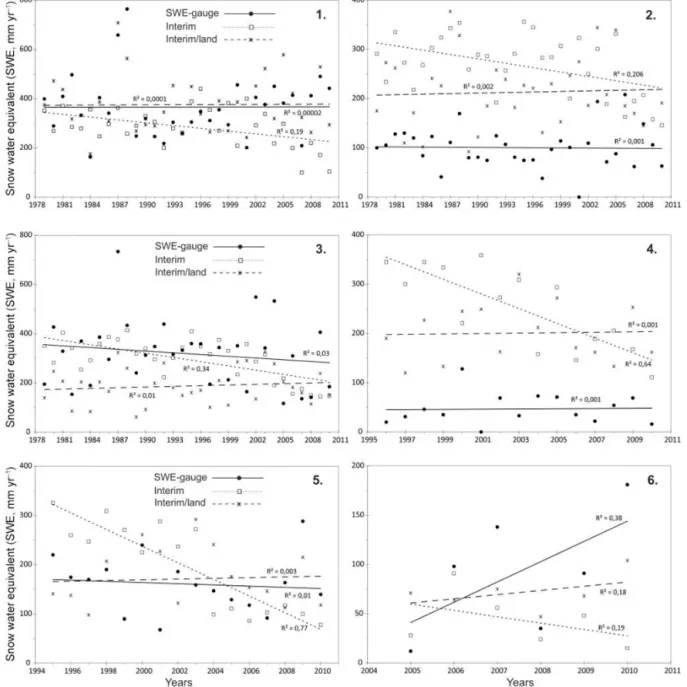
creasing trend (Fig. 8), the time series is too short for trend detection. In Fig. 8, the ERA-Interim dataset generally shows significant decreasing trends of SWE for the same locations.
3.4 Evapotranspiration
With respect to evapotranspiration (ET) trends, while both ERA-Interim and ERA-Interim/Land show similar trends over the Mediterranean, Aegean and Black seas and some areas in the southeast, the two datasets indicate rather con-tradicting trends over the land along the Anatolian penin-sula (Fig. 9a and b). Such a general pattern of consistent ET trends over the sea and non-consistent trends over the land between ERA-Interim and ERA-Interim/Land can possibly be attributed to the different controlling mechanisms of ET
Figure 8.Plots 1–6 indicate the comparison of the yearly SWE from the snow gauges with the corresponding grids from ERA-Interim and Interim/Land. While the time series of SWE covered the whole study period for stations 1–3, the station data were available for a much shorter period for 4–6. The locations of the stations are shown in Fig. 7a, b.
the highest increasing ET trends (up to 250 mm in total) oc-curred over the Mediterranean coast in the southwest, where the highest rates of temperature increase were experienced too, as shown in Fig. 2b.
3.5 Runoff
Similar to precipitation and SWE trends, runoff trends were revealed differently by two reanalysis datasets: while ERA-Interim revealed significantly decreasing trends of runoff in certain regions of Anatolia (Fig. 10a), Interim/Land indicated only minor increasing trends in some limited areas in central
Figure 9.The distribution of the presence and the direction of evapotranspiration (ET) trends by(a)ERA-Interim and(b)Interim/Land. The magnitudes of 32-year total ET trends by(c)ERA-Interim and(d)Interim/Land. The polygons in(c)and(d)delineate the 26 water basins in the country.
Figure 10.The distribution of the presence and the direction of runoff trends by(a)ERA-Interim and(b)Interim/Land. The magnitudes of 32-year total runoff trends by(c)ERA-Interim and(d)Interim/Land. The polygons in(c)and(d)delineate the 26 water basins in the country.
situ data can be assumed to be valid for runoff data as well. Indeed, analyzing the streamflow trends in eastern Anatolia, Yucel et al. (2014) found that only 2 of the streamflow sta-tions out of 15 showed evidence of significant change (both decreasing trends) in the total annual river discharges be-tween 1970 and 2010.
4 Discussion and conclusions
In this study, we assessed the spatiotemporal trends in several hydro-climate variables from 1979 to 2010 in Turkey, one of the countries of the eastern Mediterranean vulnerable to cli-mate change, using the two reanalysis products of ECMWF: ERA-Interim and Interim/Land.
With respect to air temperature, the ERA-Interim reanal-ysis dataset revealed highly significant increasing trends (95–99 % confidence intervals) with an average warming of 1.26◦C [0.8–1.8] in Turkey from 1979 to 2010 (Fig. 2a and
b), which is relatively high compared to the globally aver-aged increase of 0.72◦C over the period 1951–2012
accord-ing to the 5th Assessment Report (IPCC, 2014). The distri-bution of the significance and the magnitude of the air tem-perature trends were generally confirmed by the in situ data from about 100 weather stations around the country, though in situ data indicated slightly higher trends ranging from 1 to 2.5◦. The increased exposure of the stations to the urban heat
Figure 11. The correlation between total precipitation and runoff fora)ERA-Interim andb)Interim/Land.
Geographically, the highest warming (up to 1.8◦C)
oc-curred in the western coastal areas next to the Aegean Sea and in the southeastern regions (and in other Middle East countries including Iraq and Syria), which is also expressed by Sen et al. (2011), who indicated that the largest warm-ing (over 2◦C) occurred over the Aegean Sea and western
Turkey, due to the propagation of warmer air from over the Balkans and Aegean Sea toward eastern Anatolia after about 25 February based on the assessment of 850 hPa temperature differences between the 1990–2006 and 1972–1988 periods. Yucel et al. (2014) detected an increasing trend of 1.3◦C
be-tween 1970 and 2010 (0.33◦C decade−1) in eastern
Anato-lia, where our study also indicated relatively lower warming (about 0.3◦C decade−1) or even non-significant changes in
some parts. Eastern Anatolia is the mountainous region of the country (Fig. 1a), with a terrestrial climate of shorter sum-mers and longer winters. Considering the relatively lower density of population and the non-significant changes in the snow dynamics (Fig. 7) in the region, the relatively stationary snow–albedo feedbacks and the lower contribution of the di-rect land-use changes to the temperature increase are among the possible explanations for the lower and/or non-significant warming in eastern Anatolia.
With respect to the regional trends in hydrological vari-ables, the ERA-Interim and Interim/Land datasets revealed quite different pictures: while the ERA-Interim dataset dicated significant decreasing trends of precipitation in in-ner/southeastern and northeastern Anatolia, Interim/Land showed none or minor decreasing trends in the
southeast-ern and increasing trends in the northeastsoutheast-ern parts (Fig. 4). When these trends are compared with the rain-gauge data, the trends of Interim/Land are relatively closer to the precip-itation trends of in situ data, confirming the minor decreas-ing precipitation trends in the southeast and some increasdecreas-ing trends in the northeast. The only region where ERA-Interim and Interim/Land both indicate significant increasing precip-itation trends is the western region, which is also confirmed by in situ data, especially in the northwest.
Similar to precipitation, SWE and runoff trends were re-vealed differently by the two reanalysis datasets: while ERA-Interim indicated significant and highly decreasing trends of SWE and runoff in the upstream of the Euphrates, Sey-han and Kizilirmak basins (Figs. 7c and 10c), Interim/Land showed no or only minor trends in some limited areas in central Anatolia and the southeastern regions (Figs. 7d and 10d). A comparison with data from six SWE gauge stations showed that SWE trends from the Interim/Land dataset are quite similar to the in situ data (Fig. 8): both indicate no significant trends despite the differences in terms of SWE magnitudes. Although Sönmez et al. (2014) indicated dom-inantly negative trends for the snow cover over Turkey, the study period was relatively short (2004–2012) for a reli-able trend analysis. Although the validation of the runoff trends could not be carried out with in situ data, a correlation analysis showed that runoff and precipitation are positively correlated extensively for both reanalysis datasets (Fig. 11), implying the validation of precipitation would be valid for runoff as well. Indeed, assessing the river discharge trends in the mountainous eastern region, Yucel et al. (2014) also indicated that there are generally no statistically meaning-ful trends in the river discharges (only 2 of the 15 stations showed evidence of a decreasing trend) over the study period (1970–2010), while the timing of spring streamflow signifi-cantly shifted earlier in the year.
Anatolian peninsula from west to east (Fig. 9a and b). Al-though there are global ET datasets available (e.g., Chen et al., 2014, among others), a comparison with these indepen-dent ET datasets could not be carried out because the tempo-ral coverage of freely available datasets does not match with the period of this study.
Although it should be noted that verification of the grid-based reanalysis data with the point-grid-based station data prone to certain errors as stations may not be representative of a large area, especially in mountainous complex terrains, we can still suggest that, based on the extended comparisons with precipitation and SWE gauge data, the hydrological trends from 1979 to 2010 in Turkey revealed by the In-terim/Land dataset are closer to the observations. Indeed, compared to ERA-Interim, Interim/Land is said to be a model improvement that includes an improved soil hydrology (Bal-samo et al., 2009), a new snow scheme (Dutra et al., 2010), a multiyear satellite-based vegetation climatology (Boussetta et al., 2013), and a revised bare soil evaporation (Balsamo et al., 2011; Albergel et al., 2012).
Finally, considering that the Interim/Land dataset revealed no clear and strong hydrological trends over Turkey from 1979 to 2010 despite the strong warming (ERA-Interim) for the same period throughout the country, we can suggest that the impacts of global warming on the water cycle are not straightforward, especially at the regional scale. In this re-gard, the sections of the IPCC reports (2007, 2014) indicat-ing considerable reductions in precipitation along with the significant increases in temperatures throughout the Mediter-ranean and the Middle East by the end of the twenty-first century need to be dealt with cautiously. Indeed, the 5th As-sessment Report also declares low confidence for detecting long-term positive or negative trends in the hydrological cy-cle over different latitudinal zones due to data quality, data completeness or disagreement amongst available estimates.
5 Data availability
The Reanalysis data sets used in this study are freely avail-able and can be downloaded from the ECMWF’s data portal: http://www.ecmwf.int/en/research/climate-reanalysis/ browse-reanalysis-datasets.
The in situ data used for validation can be accessed and downloaded from: https://drive.google.com/folderview?id= 0BwahP5fV3XOFd2RGTVBELUh3Ync&usp=sharing.
Acknowledgements. I thank Faize Saris from Canakkale 18 Mart University for providing the temperature data from weather stations distributed all over the country.
I also thank Yucel Kaya from the State Hydraulic Works (DSI) for providing the snow observation data.
Finally, I thank to the editor handling the manuscript and the five anonymous reviewers for their constructive comments to improve this paper.
Edited by: B. Su
Reviewed by: five anonymous referees
References
Albergel, C., Balsamo, G., de Rosnay, P., Muñoz-Sabater, J., and Boussetta, S.: A bare ground evaporation revision in the ECMWF land-surface scheme: evaluation of its impact using ground soil moisture and satellite microwave data, Hydrol. Earth Syst. Sci., 16, 3607–3620, doi:10.5194/hess-16-3607-2012, 2012. Allen, M. R., Mutlow, C. T., Blumberg, G. M. C., Christy, J. R.,
McNider, R. T., and Llewellyn-Jones, D. T.: Global change de-tection, Nature, 370, 24–25, 1994.
Balsamo, G., Beljaars, A., Scipal, K., Viterbo, P., van den Hurk, B., Hirschi, M., and Betts, A. K.: A revised hydrology for the ECMWF model: Verification from field site to terrestrial water storage and impact in the Integrated Forecast System, J. Hydrom-eteorol., 10, 623–643, 2009.
Balsamo, G., Boussetta, S., Lopez, P., and Ferranti, L.: Evaluation of ERA-Interim and ERA-Interim-GPCP-rescaled precipitation over the U.S.A., ERA Report Series No. 5, ECMWF, Reading, UK, 10 pp., 2010.
Balsamo, G., Boussetta, S., Dutra, E., Beljaars, A., Viterbo, P., and van den Hurk, B.: Evolution of land surface processes in the IFS, ECMWF Newslett., 127, 17–22, 2011.
Balsamo, G., Albergel, C., Beljaars, A., Boussetta, S., Brun, E., Cloke, H., Dee, D., Dutra, E., Muñoz-Sabater, J., Pappen-berger, F., de Rosnay, P., Stockdale, T., and Vitart, F.: ERA-Interim/Land: a global land surface reanalysis data set, Hydrol. Earth Syst. Sci., 19, 389–407, doi:10.5194/hess-19-389-2015, 2015.
Bitz, C. M. and Fu, Q.: Arctic warming aloft is data set dependent, Nature, 455, E3–E4, 2008.
Boussetta, S., Balsamo, G., Beljaars, A., and Jarlan, J.: Impact of a satellite-derived Leaf Area Index monthly climatology in a global Numerical Weather Prediction model, Int. J. Remote Sens., 34, 3520–3542, 2013.
Bozkurt, D. and Sen, O. L.: Precipitation in the Anatolian Penin-sula: sensitivity to increased SSTs in the surrounding seas, Clim. Dynam., 36, 711–726, 2011.
Chen, X., Su, Z., Ma, Y., Liu, S., Yu, Q., and Xu, Z.: Development of a 10-year (2001–2010) 0.1◦data set of land-surface energy
balance for mainland China, Atmos. Chem. Phys., 14, 13097– 13117, doi:10.5194/acp-14-13097-2014, 2014.
data assimilation system, Q. J. Roy. Meteor. Soc., 137, 553–597, doi:10.1002/qj.828, 2011.
DSI: Turkey Water Report, Republic of Turkey, http://www.dsi.gov. tr (last access: 13 January 2016), 2009.
Dutra, E., Balsamo, G., Viterbo, P., Miranda, P. M. A., Beljaars, A., Schär, C., and Elderet, K.: An improved snow scheme for the ECMWF land surface model: description and offline validation, J. Hydrometeorol., 11, 899–916, 2010.
Ezber, Y., Sen, O. L., Kindap, T., and Karaca, M.: Climatic effects of urbanization in Istanbul: a statistical and modeling analysis, Int. J. Climatol., 27, 667–679, 2007.
Giorgi, F. and Lionello, P.: Climate change projections for the Mediterranean region, Global Planet. Change, 63, 90–104, 2008. Gokmen, M., Vekerdy, Z., Verhoef, W., and Batelaan, O.: Satellite-based analysis of recent trends in the ecohydrology of a semi-arid region, Hydrol. Earth Syst. Sci., 17, 3779–3794, doi:10.5194/hess-17-3779-2013, 2013a.
Gokmen, M., Vekerdy, Z., Lubczynski, M. W., Timmermans, J., Batelaan, O., and Verhoef, W.: Assessing Groundwater Storage Changes Using Remote Sensing–Based Evapotranspiration and Precipitation at a Large Semiarid Basin Scale, J. Hydrometeo-rol., 14, 1733–1753, 2013b.
Grant, A. N., Brönnimann, S., and Haimberger, L.: Recent Arctic warming vertical structure contested, Nature, 455, E2–E3, 2008. Graversen, R. G., Mauritsen, T., Tjernström, M., Källén, E., and Svensson, G.: Vertical structure of recent Arctic warming, Na-ture, 451, 53–56, 2008.
IPCC: Climate Change 2007: Impacts, Adaptation, and Vulnerabil-ity, edited by: Parry, M. L., Canziani, O. F., Palutikof, J. P., van der Linden, P. J., and Hanson, C. E., Cambridge University Press, Cambridge, UK, 976 pp., 2007.
IPCC: Climate Change 2014: Synthesis Report, Contribution of Working Groups I, II and III to the Fifth Assessment Report of the Intergovernmental Panel on Climate Change, edited by: Core Writing Team, Pachauri, R. K., and Meyer, L. A., IPCC, Geneva, Switzerland, 151 pp., 2014.
Kendall, M. G.: Rank Correlation Methods, London, 160 pp., Charles Griffin, 1975.
Lelieveld, J., Hadjinicolaou, P., Kostopoulou, E., Chenoweth, J., Maayar, M., Giannakopoulos, C., Hannides, C., Lange, M. A., Tanarhte, M., Tyrlis, E., and Xoplaki, E.: Climate change and impacts in the Eastern Mediterranean and the Middle East, Clim. Change, 114, 667–687, 2012.
Leroy, S. S., Anderson, J. G., and Ohring, G.: Climate Sig-nal Detection Times and Constraints on Climate Bench-mark Accuracy Requirements, J. Climate, 21, 841–846, doi:10.1175/2007JCLI1946.1, 2008.
Mann, H. B.: Nonparametric Tests against Trend, Econometrica, 13, 245–259, 1945.
Milly, P. C. D., Dunne, K. A., and Vecchia, A. V.: Global pattern of trends in streamflow and water availability in a changing climate, Nature, 438, 347–350, 2005.
Önol, B. and Semazzi, F. H. M.: Regionalization of Climate Change Simulations over the Eastern Mediterranean, J. Climate, 22, 1944–1961, 2009.
Önol, B., Bozkurt, D., Turuncoglu, U. U., Sen, O. L., and Dalfes, H. N.: Evaluation of the twenty-first century RCM simulations driven by multiple GCMs over the Eastern Mediterranean–Black Sea region, Clim. Dynam., 42, 1949–1965, 2014.
Ozturk, T., Türke¸s, M., and Kurnaz, M. L.: Analysing projected changes in future air temperature and precipitation climatology of Turkey by using RegCM4.3.5 climate simulations, Aegean Geograph. J., 20, 17–27, 2014.
Santer, B. D., Mears, C., Doutriaux, C., Caldwell, P., Gleckler, P. J., Wigley, T. M. L., Solomon, S., Gillett, N. P., Ivanova, D., Karl, T. R., Lanzante, J. R., Meehl, G. A., Stott, P. A., Taylor, K. E., Thorne, P. W., Wehner, M. F., and Wentz, F. J.: Sep-arating signal and noise in atmospheric temperature changes: The importance of timescale, J. Geophys. Res., 116, D22105, doi:10.1029/2011JD016263, 2011.
Screen, J. A. and Simmonds, I.: Erroneous Arctic temperature trends in the ERA-40 reanalysis: A closer look, J. Climate, 24, 2620–2627, 2011.
Sen, O. L., Unal, A., Bozkurt, D., and Kindap, T.: Temporal changes in the Euphrates and Tigris discharges and teleconnections, Env-iron. Res. Lett., 6, 1–9, 2011.
Seneviratne, S. I., Corti, T., Davin, E. L., Hirschi, M., Jaeger, E. B., Lehner, I., Orlowsky, B., and Teuling, A. J.: Investigating soil moisture–climate interactions in a changing climate: A review, Earth-Sci. Rev., 99, 125–161, 2010.
Simmons, A. J., Willett, K. M., Jones, P. D., Thorne, P. W., and Dee, D. P.: Low-frequency variations in surface atmospheric humidity, temperature and precipitation: Inferences from reanalyses and monthly gridded observational datasets, J. Geophys. Res., 115, 1–21, doi:10.1029/2009JD012442, 2010.
Sönmez, I., Tekeli, A. E., and Erdi, E.: Snow cover trend analy-sis using Interactive Multisensor Snow and Ice Mapping System data over Turkey, Int. J. Climatol., 34, 2349–2361, 2014. Türke¸s, M., Kurnaz, M. L., Öztürk, T., and Altınsoy, H.: Climate
changes versus ‘security and peace’ in the Mediterranean macro climate region: are they correlated?, in: Proceedings of Inter-national Human Security Conference on Human Security: New Challenges, New Perspectives, CPRS Turkey, Istanbul, 27–28 October 2011, 625–639, 2011.
Uppala, S. M., Kållberg, P. W., Simmons, A. J., Andrae, U., Bech-told, V. Da Costa, Fiorino, M., Gibson, J. K., Haseler, J., Her-nandez, A., Kelly, G. A., Li, X., Onogi, K., Saarinen, S., Sokka, N., Allan, R. P., Andersson, E., Arpe, K., Balmaseda, M. A., Beljaars, A. C. M., Berg, L. Van De, Bidlot, J., Bormann, N., Caires, S., Chevallier, F., Dethof, A., Dragosavac, M., Fisher, M., Fuentes, M., Hagemann, S., Hólm, E., Hoskins, B. J., Isaksen, L., Janssen, P. A. E. M., Jenne, R., McNally, A. P., Mahfouf, J.-F., Morcrette, J. J., Rayner, N. A., Saunders, R. W., Simon, P., Sterl, A., Trenberth, K. E., Untch, A., Vasiljevic, D., Viterbo, P., and Woollen, J.: The ERA-40 re-analysis, Q. J. Roy. Meteor. Soc., 131, 2961–3012, 2005.
van den Hurk, B., Viterbo, P., Beljaars, A., and Betts, A. K.: Offline validation of the ERA-40 surface scheme, ECMWF Tech. Memo. No. 295, ECMWF, Reading, UK, 2000.
Voss, K. A., Famiglietti, J. S., Lo, M., Linage, C., Rodell, M., and Swenson, S. C.: Groundwater depletion in the Middle East from GRACE with implications for transboundary water management in the Tigris-Euphrates-Western Iran region, Water Resour. Res., 49, 904–914, 2013.