Inferring regional sources and sinks of atmospheric CO<sub>2</sub> from GOSAT <i>X</i>CO<sub>2</sub> data
Texto
Imagem


Documentos relacionados
For AIRS, we used the averaging kernels for each CO retrieval (AIRS data version 5, http://disc.sci.gsfc.nasa.gov/AIRS; McMillan et al., 2005), and averaged the resulting CO
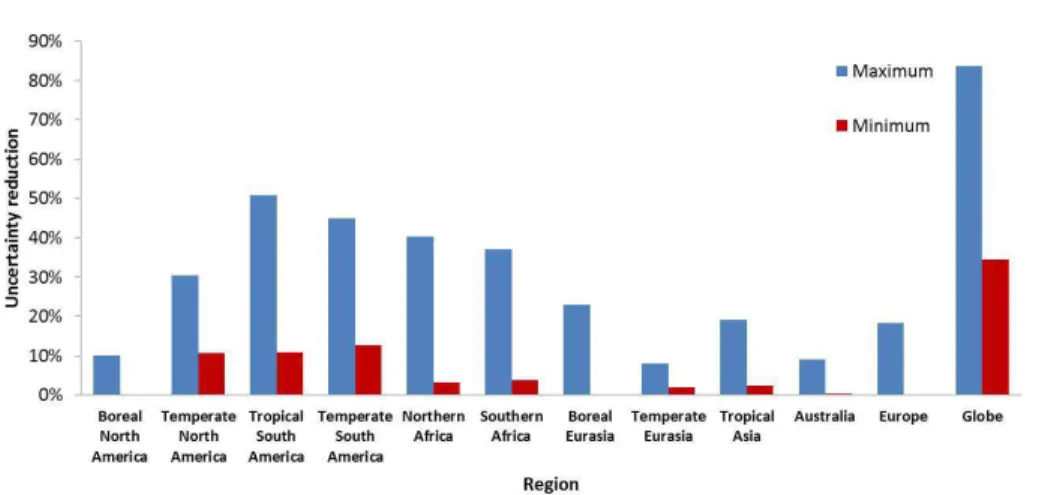
The e ff ect on local (grid scale) uncertainty reduction of assimilating data from new sites in the ICOS network depends on the coverage of the area by the initial ICOS23 network,
We have used the GEOS-Chem CO 2 simulation with CO 2 emissions from global monthly-varying fossil fuel use, shipping, aviation and the chemical production of CO 2 from the oxidation
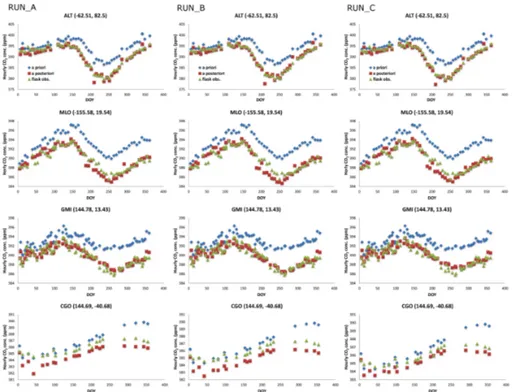
Model estimated CO 2 time series at two surface stations in the southern extra-tropics, compared to CO 2 measurements taken at those stations.. The “GOSAT” line is from an
The similar rate of increase of CO 2 emissions in function of increasing soil water content observed in the burned and unburned plots (field data), despite the very di ff
To test the impact of changing the vertical resolution of the transport model on the optimized fluxes, we assimilated the same data sets (surface layer and GOSAT) in inversions
Weekly aggregated values of environmental parameters (upper panel: precipitation (black bars), temperature (red line: soil temperature, red dashed line: air temperature), soil
The differences in trend values may be partially due to the difference in time pe- riod of the data sets (EDGAR v4.2 emission inventory is for the period 2000–2009 while the REAS
