BGD
11, 1673–1706, 2014Growing season high Arctic methane
exchange
C. A. Emmerton et al.
Title Page
Abstract Introduction
Conclusions References
Tables Figures
◭ ◮
◭ ◮
Back Close
Full Screen / Esc
Printer-friendly Version Interactive Discussion
Discussion
P
a
per
|
D
iscussion
P
a
per
|
Discussion
P
a
per
|
Discuss
ion
P
a
per
|
Biogeosciences Discuss., 11, 1673–1706, 2014 www.biogeosciences-discuss.net/11/1673/2014/ doi:10.5194/bgd-11-1673-2014
© Author(s) 2014. CC Attribution 3.0 License.
Open Access
Biogeosciences
Discussions
This discussion paper is/has been under review for the journal Biogeosciences (BG). Please refer to the corresponding final paper in BG if available.
The net exchange of methane with high
Arctic landscapes during the summer
growing season
C. A. Emmerton1, V. L. St. Louis1, I. Lehnherr2, E. R. Humphreys3, E. Rydz1, and H. R. Kosolofski1
1
Dept. of Biological Sciences, University of Alberta, Edmonton, Alberta, Canada
2
Dept. of Earth and Atmospheric Sciences, University of Waterloo, Waterloo, Ontario, Canada
3
Dept. of Geography and Environmental Studies, Carleton University, Ottawa, Ontario, Canada Received: 24 December 2013 – Accepted: 17 January 2014 – Published: 28 January 2014 Correspondence to: C. A. Emmerton (emmerton@ualberta.ca)
Published by Copernicus Publications on behalf of the European Geosciences Union.
BGD
11, 1673–1706, 2014Growing season high Arctic methane
exchange
C. A. Emmerton et al.
Title Page
Abstract Introduction
Conclusions References
Tables Figures
◭ ◮
◭ ◮
Back Close
Full Screen / Esc
Printer-friendly Version Interactive Discussion
Discussion
P
a
per
|
D
iscussion
P
a
per
|
Discussion
P
a
per
|
Discuss
ion
P
a
per
|
Abstract
High Arctic landscapes are essentially vast cold deserts interspersed with streams, ponds and wetlands. These landscapes may be important consumers and sources of the greenhouse gas methane (CH4), though few measurements exist from this region. To quantify the flux of CH4 (FCH4) between the atmosphere and desert and
5
wetland landscapes on northern Ellesmere Island, Canada, we made static chamber measurements at both locations over five growing seasons and eddy covariance (EC) measurements at the wetland in 2012. Chamber measurements revealed that desert soils consumed CH4(−1.37±0.10 mg-CH4m−
2
d−1) whereas the wetland emitted CH4 (+0.22±0.19 mg-CH4m−2d−1). Desert CH4 consumption rates were positively
corre-10
lated with soil temperature among years, and were similar to temperate locations, likely because of suitable landscape conditions for soil gas diffusion. Wetland FCH4 varied closely with stream discharge entering the wetland and hence extent of soil saturation. Landscape-scaleFCH4 measured by EC was+1.27±0.18 mg-CH4m
−2
d−1and varied with soil temperature and carbon dioxide flux. FCH4 measured using EC was higher
15
than using chambers because EC incorporated a larger, more saturated footprint of the wetland. Using ECFCH4 and quantifying the mass of CH4 entering and exiting the wetland in stream water, we determined that methanogenisis within wetland soils was the dominant source ofFCH4. Low FCH4 at the wetland was likely due to a shallow or-ganic soil layer, and thus limited carbon resources for methanogens. Considering the
20
prevalence of dry soils in the high Arctic, our results suggest that these landscapes cannot be overlooked as important consumers of atmospheric CH4.
1 Introduction
Rapid warming is altering polar regions at unprecedented rates (AMAP, 2012). Recent climate models suggest that Arctic mean annual temperatures will rise 2.5–7◦C by the
25
BGD
11, 1673–1706, 2014Growing season high Arctic methane
exchange
C. A. Emmerton et al.
Title Page
Abstract Introduction
Conclusions References
Tables Figures
◭ ◮
◭ ◮
Back Close
Full Screen / Esc
Printer-friendly Version Interactive Discussion
Discussion
P
a
per
|
D
iscussion
P
a
per
|
Discussion
P
a
per
|
Discuss
ion
P
a
per
|
Canadian Arctic Archipelago (ACIA, 2005). Mean annual precipitation is also projected to increase throughout the Arctic resulting from the capability of a warmer Arctic atmo-sphere to transport more water from low to high latitudes (Manabe and Stouffer, 1994). Warming and wetting of the Arctic has resulted in several environmental responses including permafrost thaw (Froese et al., 2008), glacial and sea ice melt (Pfeffer et al.,
5
2008), increased surface runoff(Peterson et al., 2002), increased primary productivity and vegetation cover (Walker et al., 2006), and enhanced cycling of greenhouse gases (GHGs), including the powerful GHG methane (CH4; O’Connor et al., 2010), between the atmosphere and changing landscapes.
Both CH4production (methanogenesis) and consumption (CH4oxidation, or
methan-10
otrophy) occur in Arctic terrestrial, freshwater and marine ecosystems. Methanogene-sis is carried out by obligate anaerobic microorganisms (except in ocean surface wa-ters), whereas methanotrophy occurs primarily in oxic environments. In the low and high Arctic (as defined by AMAP, 1998), there are numerous sources of CH4 to the atmosphere, most of which are predicted to strengthen in a warming and increasingly
15
ice-free environment. These sources include thermokarst lakes, peatlands, lake sed-iments, thawing permafrost, subglacial environments, CH4 hydrates in marine sedi-ments and CH4 production in ocean surface waters (Roulet et al., 1994, O’Connor et al., 2010, Kort et al., 2012, Wadham et al., 2012). For obvious reasons, far more attention has been bestowed on these sources of CH4to the atmosphere, with
propor-20
tionally less attention given to numerous sinks of CH4 in polar regions. Sinks of CH4 include the oxic layer above the saturated zone in peatlands where CH4is produced, in oxygenated water columns of lakes and oceans, and in dry desert tundra soils that make up a large portion of the high Arctic landscape (Whalen and Reeburgh, 1990). These sinks are equally important to understand and quantify because they can both
25
prevent CH4from entering the atmosphere and directly consume atmospheric CH4. Currently, the average atmospheric concentration of CH4is just over 1800 parts per billion (ppb) in the Northern Hemisphere, compared to a background concentration of
∼600 ppb for the majority of past 600 000 yr (Kirschke et al., 2013). Although
BGD
11, 1673–1706, 2014Growing season high Arctic methane
exchange
C. A. Emmerton et al.
Title Page
Abstract Introduction
Conclusions References
Tables Figures
◭ ◮
◭ ◮
Back Close
Full Screen / Esc
Printer-friendly Version Interactive Discussion
Discussion
P
a
per
|
D
iscussion
P
a
per
|
Discussion
P
a
per
|
Discuss
ion
P
a
per
|
ing the rise of atmospheric CH4concentrations is extremely important for understand-ing net emissions of this powerful GHG, it is equally important to quantify how CH4 is interacting with landscapes to understand processes driving concentration changes. For example, the flux of CH4 (FCH4) between landscapes and the atmosphere is the balance between methanogenesis and CH4 oxidation (consumption). When FCH4 is
5
negative, the system is in a phase of net CH4 consumption (or methanotrophy), and CH4 is being removed from the atmosphere. When positive, the system is in a phase of net methanogenesis, and CH4 is being added to the atmosphere. Thus, as climate changes, the state ofFCH4 in any ecosystem can have a positive or negative feedback on the atmospheric pool of CH4. Currently, there is a glaring paucity ofFCH
4
measure-10
ments in high Arctic ecosystems (Olefeldt et al., 2013) and little is known about how its direction and magnitude will respond as climate and landscapes change in the future.
The goal of this research was to quantify FCH4 for remote high Arctic landscapes where very little is known regarding carbon cycling in general and CH4 fluxes in par-ticular. Between 2008 and 2012, we measuredFCH4 near Lake Hazen in Quttinirpaaq
15
National Park, Ellesmere Island, Canada (81.8◦N, 71.4◦W). Using static chamber mea-surements, eddy covariance (EC) measurements and a mass budget analysis, we ex-amined spatial and temporal variations in FCH4 over this high Arctic landscape. We hypothesized that dry unproductive polar desert landscapes would act as a CH4 sink while wet productive meadow wetlands would be a CH4 source to the atmosphere.
20
As elsewhere, soil moisture, and air and soil temperature were expected to be impor-tant drivers ofFCH4. However the high Arctic land area is substantial and represents the extremes of environmental conditions which are changing rapidly, making it a key ecosystem to examine in the context of global CH4 cycling. To our knowledge, this study represents one of the longest records ofFCH4 in the high Arctic, and the highest
25
BGD
11, 1673–1706, 2014Growing season high Arctic methane
exchange
C. A. Emmerton et al.
Title Page
Abstract Introduction
Conclusions References
Tables Figures
◭ ◮
◭ ◮
Back Close
Full Screen / Esc
Printer-friendly Version Interactive Discussion
Discussion
P
a
per
|
D
iscussion
P
a
per
|
Discussion
P
a
per
|
Discuss
ion
P
a
per
|
2 Materials and methods
2.1 Research site
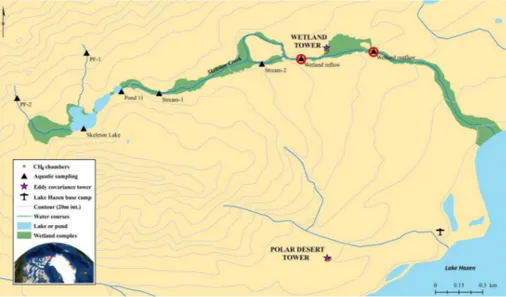
We conducted our research out of the Lake Hazen base camp in Quttinirpaaq Na-tional Park, Canada’s most northerly and remote naNa-tional park, on northern Ellesmere Island, Nunavut (Fig. 1). Fewer than 15 people typically visit the site each year. The
5
lower reach of the lake’s watershed is considered a high Arctic thermal oasis (France, 1993) because it is protected from coastal weather by the Grant Land Mountains and the Hazen Plateau adjacent to the lake. Much of the watershed is typical of the high Canadian Arctic, consisting of a dry, mineral soil landscape with intermittent meadow wetlands and ponds where water flows and collects. Following nine months of sub-0◦C
10
temperatures, snowmelt commences in the watershed in early June and vegetation growth proceeds quickly to peak biomass in mid-July before senescence toward freez-ing conditions in September. Despite continuous daylight durfreez-ing the growfreez-ing season, diurnal patterns in solar radiation exist.
We focussed our study on two common, contrasting landscape types in the high
Arc-15
tic: a dry unproductive polar desert (herein “desert”) and a moist productive meadow wetland (herein “wetland”) (Fig. 1). Ground cover at the desert (∼188 m a.m.s.l.) is classified as graminoid, prostrate dwarf-shrub forb tundra (Walker et al., 2005) consist-ing of cryptogamic crust (56.1 %), lichen (11.8 %),D. integrifolia(4.8 %), moss (1.9 %),
Carex nardine/Kubresia myosuroides(1.3 %),Salix archea(0.6), litter (3.5 %) and bare
20
ground (20.5 %, Tarnocai et al., 2001). Ground cover at the wetland (∼231 m a.m.s.l.; 2.9 ha) is classified as sedge/grass, moss meadow wetland (Walker et al., 2005) con-sisting ofCarex,Eriophorumand graminoids (Edlund, 1994). The wetland is part of the larger Skeleton Creek meadow wetland complex, consisting of permafrost seeps (PF sites), Skeleton Lake, shallow ponds (e.g., Pond 11) and a creek flowing through a
wet-25
land valley (Fig. 1). During a typical growing season, the creek flows into the wetland, saturates soils and exits downstream towards Lake Hazen.
BGD
11, 1673–1706, 2014Growing season high Arctic methane
exchange
C. A. Emmerton et al.
Title Page
Abstract Introduction
Conclusions References
Tables Figures
◭ ◮
◭ ◮
Back Close
Full Screen / Esc
Printer-friendly Version Interactive Discussion
Discussion
P
a
per
|
D
iscussion
P
a
per
|
Discussion
P
a
per
|
Discuss
ion
P
a
per
|
2.2 QuantifyingFCH4
2.2.1 Measurement overview
FCH4 has overwhelmingly been measured throughout the Arctic using static chambers because of their simplicity and convenience (Parmentier et al., 2011). The eddy co-variance (EC) technique (Baldocchi, 2003) for measuring FCH4 has only been used
5
sporadically in the high Arctic (e.g., Friborg et al., 2000) because tunable diode laser detectors or closed path detectors require large quantities of power not readily available in remote high Arctic locations. Recently, a low power consuming open path CH4 anal-yser (LI-7700; LI-COR, Lincoln, NE) has appeared on the market (McDermitt et al., 2011). EC provides FCH4 near continuously over short temporal scales (30 min) and
10
large spatial scales (hectares) providing great potential to focus on ecosystem-scale exchanges with the atmosphere and the biotic and abiotic factors driving temporal variations across northern ecosystems. This study was part of a larger one in which we are quantifying the flux of the GHG carbon dioxide (FCO2; the balance between CO2uptake via photosynthesis and the release of CO2via ecosystem respiration)
be-15
tween the atmosphere and desert (2008–2012) and wetland (2010–2012) landscapes using EC flux towers. Towers were equipped with Campbell Scientific Inc. (CSI; Lo-gan, UT) CSAT3 sonic anemometers and LI-COR LI-7500 (open-path) and LI-7200 (enclosed-path) CO2\water vapour (H2O) infrared gas analyzers (Fig. S1). In addition toFCH4andFCO2, these tower-based EC systems quantified H2O and energy fluxes and
20
were equipped with sensors to measure soil temperature and moisture at 5 cm depth (CS107B, CS616, CSI; 30 min. mean each tower, each growing season), and other meteorological parameters (Table S1). Signals from all sensors were recorded as half-hour means on CSI CR3000-XT dataloggers. Thaw depth was monitored weekly at ten points along a transect at each site using a steel probe.
BGD
11, 1673–1706, 2014Growing season high Arctic methane
exchange
C. A. Emmerton et al.
Title Page
Abstract Introduction
Conclusions References
Tables Figures
◭ ◮
◭ ◮
Back Close
Full Screen / Esc
Printer-friendly Version Interactive Discussion
Discussion
P
a
per
|
D
iscussion
P
a
per
|
Discussion
P
a
per
|
Discuss
ion
P
a
per
|
2.2.2 Chamber measurements
Static, non-steady state chambers were used to quantifyFCH4 at the desert and wet-land sites (Fig. 1). At the start of each season, we set four 25 cm diameter white PVC collars 10–15 cm into the soil within 20 m of each tower (the same locations each year), where they remained for the rest of the field season. Two desert collars enclosed bare
5
soil and two other collars enclosed>50 % vegetation cover consisting mostly ofDryas
(Figs. 1 and S1). At the wetland, four collars were placed along its margin because a boardwalk was not permitted in the National Park to access the centre of the wetland (Figs. 1 and S1). Each collar enclosed vegetation of similar type and cover as the rest of the wetland. Chambers were deployed at each site every five to seven days between
10
June and August. On sampling days, between 10:00–16:00 LT, foil-covered 18 L plas-tic chambers with sampling lines were placed into a water-filled groove on the collars. At 0, 20, 40 and 60 min after deployment, air inside each chamber was mixed by sy-ringe before chamber air was collected into an evacuated 35 mL Wheaton glass bottle. Ambient air pressure and temperature were recorded. All samples were stored in the
15
dark at 4◦C until analyses at the University of Alberta. We used a Varian 3800 gas chromatograph (GC) with a flame-ionizing detector to measure the CH4concentration (in parts-per-million; ppm) of each gas sample from each chamber. Three standard-grade gases (0, 1, 54 ppm-CH4) were used to calibrate the GC, and all samples were analysed in duplicate. We then used the CH4 concentration, the ideal gas law,
cham-20
ber metrics, ambient pressure and temperature, and the gas constant to quantify the mass of CH4 enclosed by each chamber at each sampling time. Linear regressions were used to fit relationships between sample times and total masses of CH4for each chamber. The coefficients of determination were typically strong for both desert and wetland measurements (r2=0.9±0.2). The slope of the regression line determined
25
FCH4 (mg CH4m
−2
hr−1) for each chamber. Fluxes from the four chambers were aver-aged to determine site daily means (mg CH4m−
2
d−1) with the assumption that there would be little diurnal variation inFCH4 (see Results section).
BGD
11, 1673–1706, 2014Growing season high Arctic methane
exchange
C. A. Emmerton et al.
Title Page
Abstract Introduction
Conclusions References
Tables Figures
◭ ◮
◭ ◮
Back Close
Full Screen / Esc
Printer-friendly Version Interactive Discussion
Discussion
P
a
per
|
D
iscussion
P
a
per
|
Discussion
P
a
per
|
Discuss
ion
P
a
per
|
2.2.3 Eddy covariance measurements
As described above, although EC technology is not new, only recently has a low-power, robust CH4analyzer become available. We had the opportunity during the 2012 grow-ing season to deploy an LI-7700 open-path CH4 gas analyzer on one of our two EC towers. Because we could not obtain chamber measurements in the centre of the
wet-5
land, we deployed the LI-7700 on the wetland EC tower to attain more representative CH4 fluxes from that ecosystem than provided by the chambers on the wetland’s pe-riphery. The LI-7700 was laterally positioned 25 cm from the sonic anemometer and 1.9 m above the vegetation canopy height. Measurements of CH4 molar density, wind velocity in three coordinates, sonic temperature, ambient pressure, and CO2and H2O
10
mixing ratios (LI-7200) were collected at 10 Hz and logged on a LI-COR LI-7550 inter-face unit.
We used EddyPro (LI-COR, v. 4.1) to calculate CH4, CO2 and H2O fluxes and to QA/QC data and remove outliers. Gas fluxes were calculated at half-hour intervals us-ing a block averagus-ing approach. To correct for anemometer tilt, a double rotation was
15
performed to force mean vertical and lateral wind components to zero.FCH4 data were de-spiked and corrected for time lag between the anemometer and the gas analyzer measurements using a covariance maximization approach. Because the LI-7700 is an open-path analyzer, density fluctuations were corrected for using the Webb et al. (1980) approach. We used spectral corrections to adjust for flux loss at high and low
frequen-20
cies (after Ibrom et al., 2007) and to correct for the spectroscopic effects of H2O (LI-COR, 2011). We removed half-hour fluxes when EC sensors malfunctioned, returned poor diagnostic values (e.g., during rare rain events), when wind did not pass over the wetland, and when the friction velocity fell below 0.1 m s−1, similar to other studies (Wille et al., 2008). We also applied turbulence tests after Mauder and Foken (2006) to
re-25
BGD
11, 1673–1706, 2014Growing season high Arctic methane
exchange
C. A. Emmerton et al.
Title Page
Abstract Introduction
Conclusions References
Tables Figures
◭ ◮
◭ ◮
Back Close
Full Screen / Esc
Printer-friendly Version Interactive Discussion
Discussion
P
a
per
|
D
iscussion
P
a
per
|
Discussion
P
a
per
|
Discuss
ion
P
a
per
|
between 22 June and 1 July and between 31 July and 1 August when solar charging could not match power requirements. For both chamber and ECFCH
4 measurements,
positive values represented CH4emission to the atmosphere, whereas negative values represented CH4consumption in soils.
2.3 Wetland aquatic chemistry 5
We determined if there were significant dissolved CH4 inputs by Skeleton Creek into the wetland so we could discuss the potential for methanogenesis within the wetland soils. These measurements, in combination with EC flux tower measurements, would also allow us to construct a general CH4 mass budget for the wetland. We collected surface water upstream and downstream of the wetland every two to five days during
10
the 2011 and 2012 growing seasons (Fig. 1). We measured the partial pressure of dis-solved CH4 by collecting surface water at each site into evacuated 160 mL Wheaton glass serum bottles with butyl rubber stoppers (after Kling et al., 1991). Each bottle contained 8.9 g of potassium chloride preservative, and 10 mL of ultra high-purity N2 headspace. Samples were analysed on the same GC used to analyze the chamber
15
samples, but using 0, 50, 350, and 900 ppm CH4 standard gases. All samples were placed in a wrist-action shaker for 20 min to equilibrate headspace gas with the sam-ple. 500 uL of headspace gas was extracted from each sample for analyses using a gas-tight syringe. Duplicate analyses were performed on all samples. We used the headspace CH4gas concentrations from each sample, ambient and laboratory
temper-20
ature and pressure, and Henry’s Law to determine the dissolved CH4concentration in the collected water sample. Water was also collected at each site for analyses of gen-eral water chemistry parameters including concentrations of particulate and dissolved nutrients, ions, chlorophyll-a and dissolved organic carbon. All samples were initially processed and preserved on-site in the Lake Hazen/Quttinirpaaq Polar Laboratory and
25
subsequently analysed using standard methods at the University of Alberta’s Biological Analytical Services Laboratory. In-situ measurements including pH, dissolved oxygen, water temperature, oxidation-reduction potential and specific conductivity were also
BGD
11, 1673–1706, 2014Growing season high Arctic methane
exchange
C. A. Emmerton et al.
Title Page
Abstract Introduction
Conclusions References
Tables Figures
◭ ◮
◭ ◮
Back Close
Full Screen / Esc
Printer-friendly Version Interactive Discussion
Discussion
P
a
per
|
D
iscussion
P
a
per
|
Discussion
P
a
per
|
Discuss
ion
P
a
per
|
taken at each site at time of sampling using a YSI 556 MPS multi probe system. Water flow at each site was measured every two to three days using a Pygmy current meter. At each site, we chose a channelized section of stream and measured the water veloc-ity at half-depth across 5 cm segments of stream. We then took the product of stream cross sectional area and mean velocity in each segment and summed all segments to
5
quantify total stream flow.
3 Results
3.1 Chamber measurements
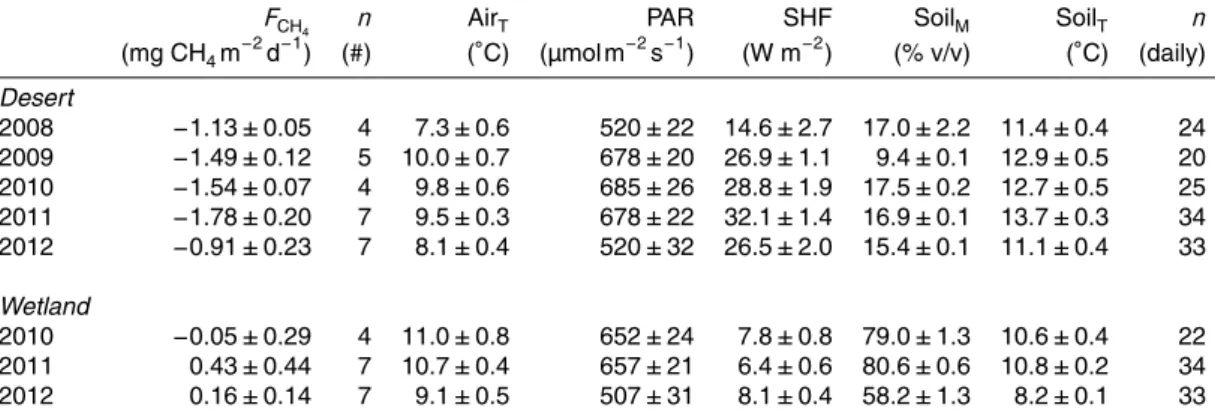
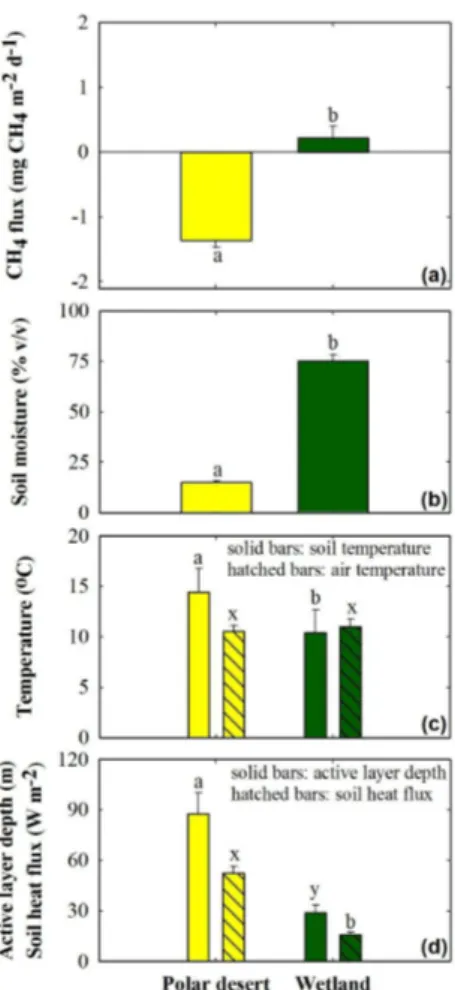
Over several growing seasons, soils at the desert site consumed atmospheric CH4 at a mean rate (±1SE) of 1.37±0.10 mg CH4m−2d−1(n=27), whereas the wetland site
10
emitted 0.22±0.19 mg CH4m− 2
d−1 (n=18) to the atmosphere (Fig. 2). Desert soils consistently consumed atmospheric CH4 throughout the growing season, whereas wetland soils typically consumed atmospheric CH4 during the first two weeks of July (0.40±0.12 mg CH4m
−2
d−1) before transitioning to a source of CH4to the atmosphere (0.72±0.22 mg CH4m−
2
d−1) (Fig. 3). These differences in FCH4 between the desert
15
and wetland were related to the large differences in soil moisture and soil tempera-ture (Fig. 2). Daily mean soil moistempera-ture at 5 cm depth of the desert soils was consis-tently near 15.1±1.0 % v/v during the measurement period, except during short rain events. Wetland soil moisture at the same depth was significantly higher (75.2±3.2 %; two-sample t test, t(43)=20.9, p <0.001) than at the desert. Because the wetland
20
was bowl-shaped, snow melt and creek water saturated the centre of the wetland first before wetting the margins where the chamber collars were located. In 2012, the wetland gradually dried after snowmelt because creek flow ceased due to low water levels in ponds upstream. Once ponds returned to maximum storage, creek flow resumed on 16 July 2012 and eventually re-saturated the wetland margin soils
25
BGD
11, 1673–1706, 2014Growing season high Arctic methane
exchange
C. A. Emmerton et al.
Title Page
Abstract Introduction
Conclusions References
Tables Figures
◭ ◮
◭ ◮
Back Close
Full Screen / Esc
Printer-friendly Version Interactive Discussion
Discussion
P
a
per
|
D
iscussion
P
a
per
|
Discussion
P
a
per
|
Discuss
ion
P
a
per
|
through the growing season as described by the significant differences in 5 cm depth soil temperature (14.4±0.5◦C-desert vs. 10.4±0.5◦C-wetland;t(43)=5.5,p <0.001), soil heat flux at 5 cm depth (52.3±4.2 W m−2-desert vs. 15.8± 1.5 W m−2-wetland;
t(42)=7.0,p <0.001) and thaw depths (0.88±0.03 m-desert vs. 0.29±0.01 m-wetland;
t(39)=18.2,p <0.001; Fig. 2).
5
Between 2008 and 2012 at the desert site, mean growing season FCH4 ranged be-tween−0.91 and−1.78 mg CH4m−
2
d−1(Table 1, Fig. 3). CH4consumption rates were positively correlated with soil temperatures between years (r2=0.99; multiple corre-lation) but not influenced by changes in soil moisture (r2=0.03). Consumption rates of CH4 were not significantly different in chambers with or without vegetation (paired
10
t test; t(26)=0.2, p=0.83). Associations between within-season FCH
4 and
environ-mental factors were generally weak (−0.28< ρ <0.07; Spearman Rank Correlation; Table S2-A.). From 2010 to 2012 at the wetland site, mean growing season FCH4 ranged between−0.05 and+0.43 mg CH4m−
2
d−1 (Table 1, Fig. 3). With only 3 yr of data, trends between mean growing seasonFCH4 at the wetland site and explanatory
15
variables were not meaningful. However, we do note that years with fairer weather (air pressurer2=0.95) and warmer conditions (thaw depthr2=0.81; soil heat flux at 5 cm depthr2=0.67) seemed to be associated with greatest emissions at the wetland. Within-season wetlandFCH4 was positively correlated with mean daily stream flow in Skeleton Creek (ρ=0.72; Table S2-B.).
20
3.2 Eddy covariance measurements
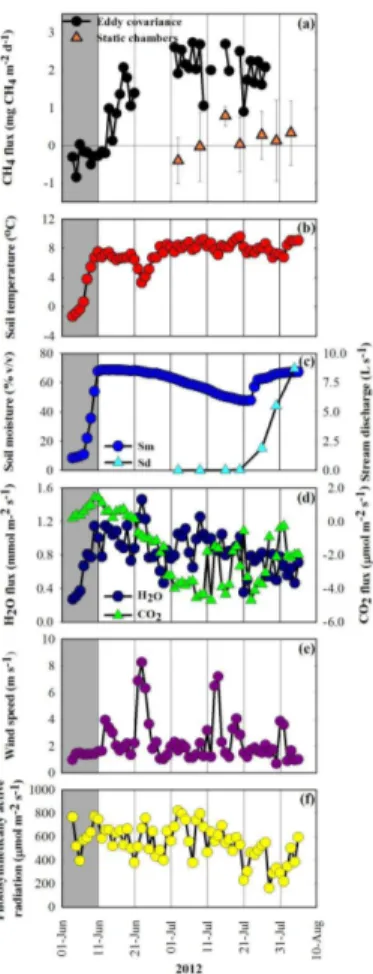
FCH4, measured using the EC flux tower in 2012, was between −0.84 and +2.73 mg CH4m−2d−1with a mean dailyFCH4 (±1SE) of 1.27±0.18 mg CH4m
−2
d−1 at the wet-land (Fig. 4a) with no discernible diurnal patterns (Fig. S2). On days when net CH4 consumption occurred, meanFCH4 was−0.33±0.07 mg CH4m−
2
d−1(n=9) compared
25
to+1.76±0.14 mg CH4m− 2
d−1 (n=29) when net CH4 emission was occurring. Net uptake of CH4quickly changed to net emission just after wetland soils rapidly thawed.
BGD
11, 1673–1706, 2014Growing season high Arctic methane
exchange
C. A. Emmerton et al.
Title Page
Abstract Introduction
Conclusions References
Tables Figures
◭ ◮
◭ ◮
Back Close
Full Screen / Esc
Printer-friendly Version Interactive Discussion
Discussion
P
a
per
|
D
iscussion
P
a
per
|
Discussion
P
a
per
|
Discuss
ion
P
a
per
|
Soil temperature warmed from freezing conditions (−1.3◦C) to above 7◦C during the first seven days of measurements (Fig. 4b). During that time, frozen moisture within soils and in snow covering the wetland, thawed and saturated the wetland landscape (Fig. 4c). The increase in evaporative fluxes preceded the saturation of the 5 cm depth of the wetland margin while FCO2 remained positive (net CO2 emission) for another
5
week after this initial thaw period (Fig. 4d). CH4 emissions peaked during the first 2 weeks of July, similar to when net CO2 uptake peaked. We did not observe significant changes in whole-wetland CH4emission rates when Skeleton Creek flow resumed dur-ing the third week of July and soil moisture in the wetland margin returned to values similar to the post-thaw period (Fig. 4a and c). In contrast, FCH4 measured by static
10
chambers increased through the summer with peak CH4 emissions at the end of the season when Skeleton Creek flow was greatest. However, chamber-based FCH4 on the wetland margin was always lower than the fluxes measured by the EC technique including a period in early July where averageFCH4 indicated net CH4uptake (Fig. 4a). Seasonal variations in FCH4 correlated with FCO2 (ρ=−0.71) and soil temperature
15
(TSOIL; ρ=0.65) (Table S3). These associations were used to develop the following parabolic model:
FCH4=23.4+−0.5·FCO2+−5.4·TSOIL+−0.1·FCO2
2+0.3·T
2
SOIL. (1)
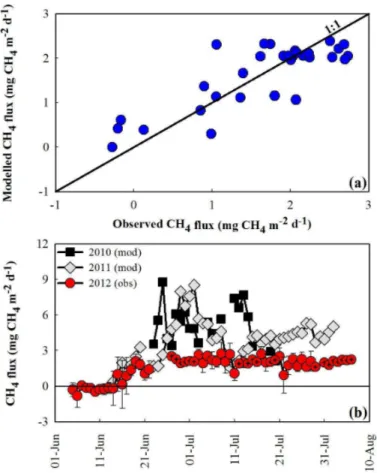
The proportion of variation in daily FCH4 described by the model was 67 % (Fig. 5;
20
Table S4). The model did not improve when a soil moisture term was included. Using Eq. (1) andFCO2 andTSOILdata from previous years,FCH4 was predicted to have been much greater in 2010 and 2011 than in 2012 (Fig. 5). Chamber data also showed higher
FCH4 in 2011 compared to 2012 (Table 1), however too few chamber measurements were taken in 2010 to confidently evaluate its difference from other years.
25
3.3 Wetland aquatic chemistry
BGD
11, 1673–1706, 2014Growing season high Arctic methane
exchange
C. A. Emmerton et al.
Title Page
Abstract Introduction
Conclusions References
Tables Figures
◭ ◮
◭ ◮
Back Close
Full Screen / Esc
Printer-friendly Version Interactive Discussion
Discussion
P
a
per
|
D
iscussion
P
a
per
|
Discussion
P
a
per
|
Discuss
ion
P
a
per
|
0.002±0.002 µmol L−1 downstream of the wetland between 28 June and 02 August in 2011, a decrease of 94 %. In 2012 between 03 July and 05 August, dissolved CH4 concentrations decreased 70 % through the wetland from 0.005±0.004 µmol L−1 to 0.01±0.005 µmol L−1, though concentrations were low. Ammonium concentrations in-creased downstream each year while nitrate concentrations dein-creased or were below
5
the analytical detection limit. Concentrations of dissolved organic nitrogen and carbon, and particulate matter were higher in the wetland outflow than inflow (Table 2).
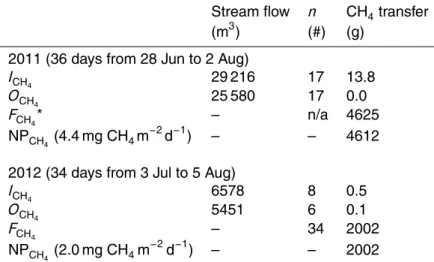
If we assume no net storage of CH4 in the wetland over a growing season when stream flow was occurring (∼late June to early August), we can calculate the net pro-duction of CH4(production-oxidation losses) in wetland soils using the following
equa-10
tion:
Σ(ICH4+NPCH4)daily= Σ(FCH4+OCH4)daily (2)
whereICH4 and OCH4 are the daily masses of dissolved CH4 entering and exiting the wetland,NPCH4 is the daily net production of CH4 in soils scaled to 2.9 ha of the
wet-15
land, andFCH4 is the daily flux of CH4 from the wetland surface (2.9 ha) as measured by the EC tower.ICH4 andOCH4 were calculated using:
ICH4 orOCH4(g)=(([CH4t1]+[CH4t2])/2)·V (3)
where [CH4t1] and [CH4t2] were mean concentrations of dissolved CH4at two
consec-20
utive sampling times and V was the total volume of water that flowed through each station between those times. Solving forNPCH4 in Eq. (2), we found that the net pro-duction of CH4in wetland soils was over twice as much in 2011 (4 612 g CH4; 4.4 mg CH4m−2d−1) compared to 2012 (2 002 g CH4; 2.0 mg CH4m−2d−1; Table 3). During 2011, soils were warmer and wetter with stronger FCO2 compared to 2012 (Table 1).
25
We also found that even if dissolved CH4 in Skeleton Creek was entirely evaded to the atmosphere in the wetland (i.e., not oxidized within soils), it was still a very small component (<1 %) ofFCH4 compared to net production in soils (Table 3).
BGD
11, 1673–1706, 2014Growing season high Arctic methane
exchange
C. A. Emmerton et al.
Title Page
Abstract Introduction
Conclusions References
Tables Figures
◭ ◮
◭ ◮
Back Close
Full Screen / Esc
Printer-friendly Version Interactive Discussion
Discussion
P
a
per
|
D
iscussion
P
a
per
|
Discussion
P
a
per
|
Discuss
ion
P
a
per
|
4 Discussion
4.1 Factors driving CH4consumption within polar desert soils
The range in mean growing seasonFCH4 at our desert site during five growing seasons (−0.9 to−1.8 mg CH4m
−2
d−1) was similar toFCH4measured at other dry soils in Arctic and temperate ecosystems (∼0 to −3.5 mg CH4m−
2
d−1; Table S5; King et al., 1997;
5
Smith et al., 2000; Olefeldt et al., 2013). Methanotrophs use CH4 as their primary carbon and energy source for metabolism and in dry soils, rates of methanotrophy are controlled by factors that: (1) deliver CH4 and oxygen into soils (Benstead and King, 1997; Flessa et al., 2008); (2) allow passage and replenishment of these gases where methanotrophs reside (Moosavi and Crill, 1998); and (3) facilitate heat transfer and
10
increase soil temperatures where methanotrophs reside (Christensen et al., 1999). The bulk density and gas diffusivity of upper soil horizons affect diffusion rates of atmospheric gases into soils (Smith et al., 2000). No vegetation canopy, high wind speeds and surface roughness promote the exchange of gases between the soil sur-face and the atmosphere by increasing the concentration gradient for CH4and oxygen
15
from the soil to the atmosphere. The barren and flat terrain with large fetch and some surface roughness (1.5 cm) at the polar desert site would have promoted sustained gas exchange in this way.
Soil moisture is also a crucial factor influencing methanotrophy within soils. As wa-ter content increases, it replaces gas-filled pore spaces leading to reduced diffusivity
20
thereby restricting oxygen (and CH4) replenishment required for microbial metabolism. Whalen and Reeburgh (1996) found that methanotrophic rates peaked near 20 % soil moisture (v/v) in boreal soils before decreasing substantially towards saturation. At our desert site, soils were sandy, well-drained, and typically between 9–16 % v/v at 5 cm below the surface. We found little association between within-season FCH4 rates and
25
BGD
11, 1673–1706, 2014Growing season high Arctic methane
exchange
C. A. Emmerton et al.
Title Page
Abstract Introduction
Conclusions References
Tables Figures
◭ ◮
◭ ◮
Back Close
Full Screen / Esc
Printer-friendly Version Interactive Discussion
Discussion
P
a
per
|
D
iscussion
P
a
per
|
Discussion
P
a
per
|
Discuss
ion
P
a
per
|
where desiccation restricted microbial activity. This conclusion was further supported by the chamber results where FCH4 was similar in chambers with and without vascu-lar vegetation suggesting that the moister vegetated soils were still within a moisture range that sustained methanotrophs without restricting gas transport. These results also suggested that there was no enhancement of methanogen activity in association
5
with vegetation cover.
The significant CH4 consumption rates at the desert through the measurement pe-riod in each year (Fig. 3) were also a function of relatively warm soil temperatures (Ta-ble 1) since methanotrophy is a microbial metabolic process. Despite the high latitude of our site, near surface soils were warm with little variation through the measurement
10
period (Fig. S3). This region experiences low cloud cover relative to much of the high Arctic (Thompson, 1994) resulting in high daily isolation (Fig. 4). The deep, narrow valley structure of the watershed also retains heat more efficiently than other Arctic locales (Thompson, 1994).
4.2 Factors driving CH4emission from meadow wetland soils 15
FCH4 measured in our wetland margin chambers (–0.12 to+0.43 mg CH4m− 2
d−1) and using the EC technique (−0.84 to+2.73 mg CH4m−
2
d−1) were considerably lower than other low Arctic and sub Arctic wetlands (Olefeldt et al., 2013; Table S5). CH4 is pro-duced by methanogenic bacteria as a by-product of carbon metabolism in anaerobic soil environments and several factors control its production and release to the
atmo-20
sphere including: (1) soil moisture/water table position (Moosavi and Crill, 1997; Chris-tensen et al., 2000); (2) soil temperature (ChrisChris-tensen et al., 1995; Nakano et al., 2000; Ström et al., 2012); (3) vegetation species composition and primary productivity rates (Christensen et al., 1999; Ström et al., 2012); and (4) substrate availability (Ström et al., 2012).
25
Saturated, poorly-draining soils may sustain anaerobic conditions crucial for methanogens and also reduce habitat for CH4consuming methanotrophs above water
BGD
11, 1673–1706, 2014Growing season high Arctic methane
exchange
C. A. Emmerton et al.
Title Page
Abstract Introduction
Conclusions References
Tables Figures
◭ ◮
◭ ◮
Back Close
Full Screen / Esc
Printer-friendly Version Interactive Discussion
Discussion
P
a
per
|
D
iscussion
P
a
per
|
Discussion
P
a
per
|
Discuss
ion
P
a
per
|
tables. Soils in our wetland margin collars switched abruptly from net CH4consumption to net CH4emission when Skeleton Creek water saturated the previously dry organic soils. However, the EC flux tower measurement (near constant CH4 emission) inte-grated the full wetland area suggesting that a significant portion of the wetland within the flux footprint was constantly near saturation following the rapid thaw period. This
5
also may explain the lack of correlation between the soil moisture measured at the wet-land margin and towerFCH
4. Other studies have shown thatFCH4 may cease to relate
to soil moisture once saturation occurs (Heikkinen et al., 2002a), and we suspect that was the case at our site.
Temperature influences CH4 production and emission from wetlands, even in cold
10
environments (van Huissteden et al., 2005). Soil temperature was strongly associated withFCH4measured by the EC tower primarily as a consequence of the switch from CH4 uptake to loss during soil thaw. After this period, soil temperatures were relatively stable as discussed above. Without more variation in soil temperature during the growing season, it is difficult to assess the sensitivity ofFCH4at these higher soil temperatures (>
15
8–12◦C). Although soil temperatures at our wetland were generally lower than wetlands which emit large amounts of CH4 in low Arctic regions (e.g., Parmentier et al., 2011), we found that other high Arctic wetlands with similar soil temperatures still emitted significantly more CH4to the atmosphere (Christensen et al., 1995; Friborg et al., 2000; Tagesson et al., 2012) than at our site. Soil temperatures, therefore, did not appear to
20
fully explain the low CH4fluxes at our wetland.
Several Arctic studies have demonstrated the importance of plant structures and root exudates to the emission of CH4from wetlands (e.g., Ström et al., 2012). Certain aerenchymous plants are known to be important conduits of CH4 to the atmosphere (e.g.,Eriophorum, Carex; Ström et al., 2003). Plants also release carbon and
nutrient-25
BGD
11, 1673–1706, 2014Growing season high Arctic methane
exchange
C. A. Emmerton et al.
Title Page
Abstract Introduction
Conclusions References
Tables Figures
◭ ◮
◭ ◮
Back Close
Full Screen / Esc
Printer-friendly Version Interactive Discussion
Discussion
P
a
per
|
D
iscussion
P
a
per
|
Discussion
P
a
per
|
Discuss
ion
P
a
per
|
during thaw and through the growing season (Fig. 4, Table S3), this suggests either plant productivity and/or plant mediated transport of CH4 may have been important in driving the seasonal variations inFCH4 at the wetland. However,FCO2 rates at our wetland were comparable to other high Arctic wetlands (Friborg et al., 1997; Tagesson et al., 2012) and others much further south (e.g., Lafleur et al., 2012, Humphreys and
5
Lafleur, 2011), suggesting that plant productivity also cannot explain low rates of CH4 emission from our wetland.
Substrate quantity and quality are key factors supporting microbial viability in soils. Peat accumulates in cold wetland environments because cold temperatures restrict mi-crobial decomposition of fresh litter while saturation limits more efficient aerobic
degra-10
dation pathways. Peat can be a high-quality carbon source for microbes in Arctic wet-lands because of its high labile carbon content (Updegraffet al., 1995). At Zackenburg, GR (74◦N, 20◦W), where soil temperatures and CO2 fluxes were similar to our site, peat depths extended to over 30 cm encompassing most of the active layer during the growing season (Christensen et al., 2000). At the centre of our wetland, the organic
15
layer was only 7 cm thick with a sharp transition to mineral soil (Fig. S4). Therefore, approximately one-quarter to two-thirds of the wetland active layer was comprised of organic-poor mineral soils likely not ideal for substantial microbial activity. Therefore, this wetland site, and presumably its low CH4emissions, was distinguished from other high Arctic wetlands. The reason for a roughly 7–10 cm deep accumulation of organic
20
materials at the centre of this wetland, despite CO2 uptake rates comparable to other high Arctic wetlands, may be due to its young age or could be due to other factors, such as redox conditions, that limit carbon accumulation and do not support methano-genesis.
4.3 CH4transport and transformations through a high Arctic wetland 25
The Skeleton Creek wetland complex is a typical meadow wetland within the Lake Hazen watershed and includes soils and productive lakes which are potentially im-portant CH4 emission sources to the atmosphere. Chemistry sampling of six aquatic
BGD
11, 1673–1706, 2014Growing season high Arctic methane
exchange
C. A. Emmerton et al.
Title Page
Abstract Introduction
Conclusions References
Tables Figures
◭ ◮
◭ ◮
Back Close
Full Screen / Esc
Printer-friendly Version Interactive Discussion
Discussion
P
a
per
|
D
iscussion
P
a
per
|
Discussion
P
a
per
|
Discuss
ion
P
a
per
|
sites upstream of the wetland (Fig. 1) showed significant changes in dissolved CH4 concentrations (Table S6). Low CH4 concentrations occurred in permafrost melt water (PF sites), high concentrations and emission rates were observed in productive lakes (Skeleton Creek, Pond 11; St. Louis, unpublished data), and concentrations declined downstream in the creek (stream sites) and wetland areas (wetland inflow, outflow)
5
due to a combination of evasion and/or oxidation. These results suggest that wetland complexes in the watershed are comprised of potential “hot-spots” of CH4 production and emission with very little lateral transfer of CH4between these systems and to Lake Hazen. This model of CH4 flow differs from similar studies in the south which showed greater importance of lateral CH4transport in streams (e.g., Dinsmore et al., 2010).
10
One of these “hot-spots” of CH4 production and emission was at our wetland site. Because Skeleton Creek delivered only small amounts of CH4to the wetland (despite high CH4 concentrations draining from Skeleton Lake), we found that the majority of CH4emitted by the wetland was from CH4produced within its soils (Table 2). Although we did not measure pore water CH4 within the wetland, these results suggest that
15
CH4emissions in the wetland were due to in-situ production exceeding oxidation even if we assume all creek CH4 was evaded and included in FCH4 measurements. Bac-terial production of CH4 in wetland soils was further supported by chemistry results downstream of the wetland which showed signatures of anaerobic microbial activity in the form of: (1) increased NH+4 : NO−3 ratios; (2) increases in dissolved and
partic-20
ulate organic matter; and (3) decreases in oxidation-reduction potential. However, it is unclear if fast stream flow velocity and short water residence times in the wetland affected ultimate concentrations and redox potentials measured in stream water exit-ing the wetland. For example, redox potential measurements in stream water exitexit-ing the wetland (∼+20 mV) were generally higher than expected for methane-producing
25
BGD
11, 1673–1706, 2014Growing season high Arctic methane
exchange
C. A. Emmerton et al.
Title Page
Abstract Introduction
Conclusions References
Tables Figures
◭ ◮
◭ ◮
Back Close
Full Screen / Esc
Printer-friendly Version Interactive Discussion
Discussion
P
a
per
|
D
iscussion
P
a
per
|
Discussion
P
a
per
|
Discuss
ion
P
a
per
|
4.4 CH4fluxes in the high Arctic and future climate
Most CH4studies on Arctic landscapes focus on emission sources to the atmosphere, such as peatlands and wetlands, because of their considerable coverage in the low-and sub-Arctic, low-and their important role in global CH4budgets (O’Connor et al., 2010, Kirschke et al., 2013). Results from the Lake Hazen watershed suggest that CH4
con-5
sumption, not emission, is the larger, more consistent pattern ofFCH
4 in the high Arctic
because of limited wetland and pond coverage (Lehner and Döll, 2004). The consump-tion rates at Lake Hazen and other regions (Lamb et al., 2011; Flessa et al., 2008) across the high Arctic, suggest that this region cannot be overlooked as an important consumer of atmospheric CH4. For example, within Quttinirpaaq National Park,
ap-10
proximately 99 % of the plant-habitable zone in the Park (22 672 km2) is considered to have moderate- to well-drained soils (Edlund, 1994) compared to only 1 % classified as saturated or poorly-drained soils. Considering the extensive area of dry, upland land-scapes in the broader high Arctic, substantially more CH4 measurements on dry soils are required to better delineate areas of CH4consumption and ultimately support more
15
robust Arctic CH4models.
Future changes in soil temperature and moisture (ACIA, 2005) are expected to have landscape-level effects in the Arctic, with some models predicting 18 % of polar desert regions being replaced with southern tundra species by 2080, relative to 1960 (Sitch et al., 2003). Results from our contrasting high Arctic landscapes suggest that soil
20
moisture, soil temperature, and substrate quantity are key factors determining the mag-nitude and direction ofFCH4for these landscapes. However future changes within each ecosystem will likely result in different FCH4 responses. Polar desert soils are mostly well-drained mineral soils with pockets of cryoturbated organic matter (Tarnocai et al., 2001). We found that CH4 consumption rates were affected by soil temperature, but
25
not vegetation cover. Therefore, we may expect that warming temperatures and longer growing seasons may increase CH4 consumption rates. Predicted increases in pre-cipitation and permafrost melt water on the landscapes, at least in the short-term, will
BGD
11, 1673–1706, 2014Growing season high Arctic methane
exchange
C. A. Emmerton et al.
Title Page
Abstract Introduction
Conclusions References
Tables Figures
◭ ◮
◭ ◮
Back Close
Full Screen / Esc
Printer-friendly Version Interactive Discussion
Discussion
P
a
per
|
D
iscussion
P
a
per
|
Discussion
P
a
per
|
Discuss
ion
P
a
per
|
likely not affect CH4 consumption rates substantially because of this coarse-textured soil’s poor ability to retain water. Until the soils develop greater organic matter con-tent capable of retaining more water (to the point of limiting diffusivity), these soils should continue to consume CH4 in a warmer and wetter climate. In the wetland, our mass budget analysis indicated some differences in CH4 emission rates between the
5
contrasting hydrological and meteorological conditions of 2011 and 2012, but overall emission rates were still very low. Although warming air temperatures and permafrost thaw should support methanogenic activity in the future, until substantial organic car-bon accumulation occurs in this system, methanogenesis and thus CH4emission to the atmosphere will likely continue to be limited in poorly-draining soils in the Lake Hazen
10
watershed. The rate at which landscapes can change is an important unknown for the future cycling of GHG’s at this high latitude.
Supplementary material related to this article is available online at http://www.biogeosciences-discuss.net/11/1673/2014/
bgd-11-1673-2014-supplement.pdf. 15
Acknowledgements. This work was supported by the Natural Sciences and Engineering Re-search Council (Discovery Grants Program, Northern ReRe-search Supplement, Canada Gradu-ate Scholarships), Natural Resources Canada (Polar Continental Shelf Project), the Canadian Circumpolar Institute (Circumpolar Boreal Alberta Research grant), and Aboriginal Affairs and Northern Development Canada (Northern Scientific Training Program). We thank the gracious
20
support of the staffof Parks Canada at Quttinirpaaq National Park, the staffof Polar Continen-tal Shelf Project-Resolute Bay, the staffof the University of Alberta Biogeochemical Analytical Service Laboratory, George Burba and the staff at LI-COR Biogeosciences, Claude Labine and the staffof Campbell Scientific Canada Corp., Duane Froese, Lauren Davie, Sarah Berkel, Kimberly Rondeau, Peter Carlson, and Jennifer Graydon.
25
BGD
11, 1673–1706, 2014Growing season high Arctic methane
exchange
C. A. Emmerton et al.
Title Page
Abstract Introduction
Conclusions References
Tables Figures
◭ ◮
◭ ◮
Back Close
Full Screen / Esc
Printer-friendly Version Interactive Discussion
Discussion
P
a
per
|
D
iscussion
P
a
per
|
Discussion
P
a
per
|
Discuss
ion
P
a
per
|
References
ACIA: Arctic Climate Impact Assessment – Scientific Report, 1st edn., Cambridge University Press, New York, 2005.
AMAP: AMAP Assessment Report: Arctic Pollution Issues, Arctic Monitoring and Assessment Programme (AMAP), Oslo, Norway, xii+859 pp., 1998.
5
AMAP: Arctic Climate Issues 2011: Changes in Arctic Snow, Water, Ice and Permafrost, SWIPA 2011 Overview Report, Arctic Monitoring and Assessment Programme (AMAP), Oslo, xi+97 pp., 2012.
Baldocchi, D. D.: Assessing the eddy covariance technique for evaluating carbon dioxide ex-change rates of ecosystems: past, present and future, Glob. Change Biol., 9, 479–492, 2003.
10
Benstead, J. and King, G. M.: Response of methanotrophic activity in forest soil to methane availability, FEMS Microbiol. Ecol., 23, 333–340, 1997.
Christensen, T. R., Jonasson, S., Callaghan, T. V., and Havstrom, M.: Spatial variation in high-latitude methane flux along a transect across Siberian and European Tundra environments, J. Geophys. Res.-Atmos., 100, 21035–21045, 1995.
15
Christensen, T. R., Jonasson, S., Callaghan, T. V., Havstrom, M., and Livens, F. R.: Carbon cycling and methane exchange in Eurasian tundra ecosystems, Ambio, 28, 239–244, 1999. Christensen, T. R., Friborg, T., Sommerkorn, M., Kaplan, J., Illeris, L., Soegaard, H.,
Nord-stroem, C., and Jonasson, S.: Trace gas exchange in a high-arctic valley, 1. Variations in CO2and CH4flux between tundra vegetation types, Global Biogeochem. Cy., 14, 701–713,
20
2000.
Dinsmore, K. J., Billett, M. F., Skiba, U. M., Rees, R. M., Drewer, J., and Helfter, C.: Role of the aquatic pathway in the carbon and greenhouse gas budgets of a peatland catchment, Glob. Change Biol., 16, 2750–2762, 2010.
Edlund, S. A.: Vegetation, in: Resource Description and Analysis – Ellesmere Island National
25
Park Reserve, Natural Resource Conservation Section, Prairie and Northern Region, Parks Canada, Department of Canadian Heritage, Winnipeg, Canada, 55 pp., 1994.
Flessa, H., Rodionov, A., Guggenberger, G., Fuchs, H., Magdon, P., Shibistova, O., Zrazhevskaya, G., Mikheyeva, N., Kasansky, O. A., and Blodau, C: Landscape controls of CH4 fluxes in a catchment of the forest tundra ecotone in northern Siberia, Glob. Change
30
Biol., 14, 2040–2056, 2008.
BGD
11, 1673–1706, 2014Growing season high Arctic methane
exchange
C. A. Emmerton et al.
Title Page
Abstract Introduction
Conclusions References
Tables Figures
◭ ◮
◭ ◮
Back Close
Full Screen / Esc
Printer-friendly Version Interactive Discussion
Discussion
P
a
per
|
D
iscussion
P
a
per
|
Discussion
P
a
per
|
Discuss
ion
P
a
per
|
France, R. L.: The Lake Hazen trough – a late winter oasis in a Polar Desert, Biol. Conserv., 63, 149–151, 1993.
Friborg, T., Christensen, T. R., and Sogaard, H.: Rapid response of greenhouse gas emission to early spring thaw in a subarctic mire as shown by micrometeorological techniques, Geophys. Res. Lett., 24, 3061–3064, 1997.
5
Friborg, T., Christensen, T. R., Hansen, B. U., Nordstroem, C., and Soegaard, H.: Trace gas exchange in a high-arctic valley, 2. Landscape CH4 fluxes measured and modeled using Eddy correlation data, Global Biogeochem. Cy., 14, 715–723, 2000.
Froese, D. G., Westgate, J. A., Reyes, A. V., Enkin, R. J., and Preece, S. J.: Ancient permafrost and a future, warmer arctic, Science, 321, 1648–1648, 2008.
10
Heikkinen, J. E. P., Elsakov, V., and Martikainen, P. J.: Carbon dioxide and methane dynamics and annual carbon balance in tundra wetland in NE Europe, Russia, Global Biogeochem. Cy., 16, 1115, doi:10.1029/2002GB001930, 2002.
Humphreys, E. R. and Lafleur, P. M.: Does earlier snowmelt lead to greater CO2 se-questration in two low Arctic tundra ecosystems?, Geophys. Res. Lett., 38, L09703,
15
doi:10.1029/2011GL047339, 2011.
Ibrom, A., Dellwik, E., Flyvbjerg, H., Jensen, N. O., and Pilegaard, K.: Strong low-pass filtering effects on water vapour flux measurements with closed-path eddy correlation systems, Agr. Forest Meteorol., 147, 140–156, 2007.
King, G. M.: Responses of atmospheric methane consumption by soils to global climate
20
change, Glob. Change Biol., 3, 351–362, 1997.
Kirschke, S, Bousquet, P., Ciais, P., Saunois, M., Canadell, J. G., Dlugokencky, E. J., Bergam-aschi, P., Bergmann, D., Blake, D. R., Bruhwiler, L., Cameron-Smith, P., Castaldi, S., Cheval-lier, F., Feng, L., Fraser, A., Heimann, M., Hodson, E. L., Houweling, S., Josse, B., Fraser, P. J., Krummel, P. B., Lamarque, J.-F., Langenfeld, R. L., Le Quéré, C., Naik, V., O’Doherty, S.,
25
Palmer, P. I., Pison, I., Plummer, D., Poulter, B., Prinn, R. G., Rigby, M., Ringeval, B., Santini, M., Schmidt, M., Shindell, D. T., Simpson, I. J., Spahni, R., Steele, L. P., Strode, S. A., Sudo, K., Szopa, S., van der Werf, J. R., Voulgarakis, A., van Weele, M., Weiss, R. F., Williams, J. E., and Zeng, G.: Three decades of global methane sources and sinks, Nat. Geosci., 6, 813–823, 2013.
30
BGD
11, 1673–1706, 2014Growing season high Arctic methane
exchange
C. A. Emmerton et al.
Title Page
Abstract Introduction
Conclusions References
Tables Figures
◭ ◮
◭ ◮
Back Close
Full Screen / Esc
Printer-friendly Version Interactive Discussion
Discussion
P
a
per
|
D
iscussion
P
a
per
|
Discussion
P
a
per
|
Discuss
ion
P
a
per
|
Kort, E. A., Wofsy, S. C., Daube, B. C., Diao, M., Elkins, J. W., Gao, R. S., Hintsa, E. J., Hurst, D. F., Jimenez, R., Moore, F. L., Spackman, J. R., and Zondlo, M. A.: Atmospheric observations of Arctic Ocean methane emissions up to 82◦North, Nat. Geosci., 5, 318–321, 2012. Lafleur, P. M., Humphreys, E. R., St Louis, V. L., Myklebust, M. C., Papakyriakou, T.,
Pois-sant, L., Barker, J. D., Pilote, M., and Swystun, K. A.: Variation in peak growing season net
5
ecosystem production across the Canadian Arctic, Environ. Sci. Technol., 46, 7971–7977, 2012.
Lamb, E. G., Han, S., Lanoil, B. D., Henry, G. H. R., Brummell, M. E., Banerjee, S., and Si-ciliano, S. D.: A high Arctic soil ecosystem resists long-term environmental manipulations, Glob. Change Biol., 17, 3187–3194, 2011.
10
Lehner, B. and Doll, P.: Development and validation of a global database of lakes, reservoirs and wetlands, J. Hydrol., 296, 1–22, 2004.
LI-COR Biosciences: LI-7700 Open Path CH4 Analyzer Instruction Manual (v.2; 984-10751), Lincoln, USA, 2011.
Manabe, S. and Stouffer, R. J.: Multiple-century response of a coupled ocean-atmosphere
15
model to an increase of atmospheric carbon-dioxide, J. Climate, 7, 5–23, 1994.
Mauder, M. and Foken, T.: Impact of post-field data processing on eddy covariance flux esti-mates and energy balance closure, Meteorol. Z., 15, 597–609, 2006.
McDermitt, D., Burba, G., Xu, L., Anderson, T., Komissarov, A., Riensche, B., Schedlbauer, J., Starr, G., Zona, D., Oechel, W., Oberbauer, S., and Hastings, S.: A new low-power,
open-20
path instrument for measuring methane flux by eddy covariance, Appl. Phys. B-Lasers O., 102, 391–405, 2011.
Moosavi, S. C. and Crill, P. M.: Controls on CH4and CO2emissions along two moisture gradi-ents in the Canadian boreal zone, J. Geophys. Res.-Atmos., 102, 29261–29277, 1997. Moosavi, S. C. and Crill, P. M.: CH4 oxidation by tundra wetlands as measured by a selective
25
inhibitor technique, J. Geophys. Res.-Atmos., 103, 29093–29106, 1998.
Nakano, T., Kuniyoshi, S., and Fukuda, M.: Temporal variation in methane emission from tundra wetlands in a permafrost area, northeastern Siberia, Atmos. Environ., 34, 1205–1213, 2000. O’Connor, F. M., Boucher, O., Gedney, N., Jones, C. D., Folberth, G. A., Coppell, R., Friedling-stein, P., Collins, W. J., Chappellaz, J., Ridley, J., and Johnson, C. E.: Possible role of
wet-30
lands, permafrost, and methane hydrates in the methane cycle under future climate change: a review, Rev. Geophys., 48, 2010RG000326, doi:10.1029/2010RG000326, 2010.
BGD
11, 1673–1706, 2014Growing season high Arctic methane
exchange
C. A. Emmerton et al.
Title Page
Abstract Introduction
Conclusions References
Tables Figures
◭ ◮
◭ ◮
Back Close
Full Screen / Esc
Printer-friendly Version Interactive Discussion
Discussion
P
a
per
|
D
iscussion
P
a
per
|
Discussion
P
a
per
|
Discuss
ion
P
a
per
|
Olefeldt, D., Turetsky, M. R., Crill, P. M., and McGuire, A. D.: Environmental and physical controls on northern terrestrial methane emissions across permafrost zones, Glob. Change Biol., 19, 589–603, 2013.
Overland, J. E., Wang, M., Walsh, J. E., Christensen, J. H., Kattsov, V. M., and Chapman, W. L.: Climate model projections for the Arctic. In: Snow, water, ice and permafrost in the Arctic
5
(SWIPA): climate change and the cryosphere, Arctic Monitoring and Assessment Programme (AMAP), Oslo, 18 pp., 2011.
Parmentier, F. J. W., van Huissteden, J., van der Molen, M. K., Schaepman-Strub, G., Karsanaev, S. A., Maximov, T. C., and Dolman, A. J.: Spatial and temporal dynamics in eddy covariance observations of methane fluxes at a tundra site in northeastern Siberia, J.
10
Geophys. Res.-Biogeo., 116, G03016, doi:10.1029/2010JG001637, 2011.
Peterson, B. J., Holmes, R. M., McClelland, J. W., Vorosmarty, C. J., Lammers, R. B., Shiklo-manov, A. I., ShikloShiklo-manov, I. A., and Rahmstorf, S.: Increasing river discharge to the Arctic Ocean, Science, 298, 2171–2173, 2002.
Pfeffer, W. T., Harper, J. T., and O’Neel, S.: Kinematic constraints on glacier contributions to
15
21st-century sea-level rise, Science, 321, 1340–1343, 2008.
Roulet, N. T., Jano, A., Kelly, C. A., Klinger, L. F., Moore, T. R., Protz, R., Ritter, J. A., and Rouse, W. R.: Role of the Hudson-Bay lowland as a source of atmospheric methane, J. Geophys. Res.-Atmos., 99, 1439–1454, 1994.
Sitch, S., Smith, B., Prentice, I. C., Arneth, A., Bondeau, A., Cramer, W., Kaplan, J. O., Levis, S.,
20
Lucht, W., Sykes, M. T., Thonicke, K., and Venevsky, S.: Evaluation of ecosystem dynamics, plant geography and terrestrial carbon cycling in the LPJ dynamic global vegetation model, Glob. Change Biol., 9, 161–185, 2003.
Smith, K. A., Dobbie, K. E., Ball, B. C., Bakken, L. R., Sitaula, B. K., Hansen, S., Brumme, R., W. Borken et al.: Oxidation of atmospheric methane in northern European soils, comparison
25
with other ecosystems, and uncertainties in the global terrestrial sink, Glob. Change Biol., 6, 791–803, 2000.
Ström, L., Ekberg, A., Mastepanov, M., and Christensen, T. R.: The effect of vascular plants on carbon turnover and methane emissions from a tundra wetland, Glob. Change Biol., 9, 1185–1192, 2003.
30
BGD
11, 1673–1706, 2014Growing season high Arctic methane
exchange
C. A. Emmerton et al.
Title Page
Abstract Introduction
Conclusions References
Tables Figures
◭ ◮
◭ ◮
Back Close
Full Screen / Esc
Printer-friendly Version Interactive Discussion
Discussion
P
a
per
|
D
iscussion
P
a
per
|
Discussion
P
a
per
|
Discuss
ion
P
a
per
|
Tagesson, T., Molder, M., Mastepanov, M., Sigsgaard, C., Tamstorf, M. P., Lund, M., Falk, J. M., Lindroth, A., Christensen, T. R., and Strom, L.: Land-atmosphere exchange of methane from soil thawing to soil freezing in a high-Arctic wet tundra ecosystem, Glob. Change Biol., 18, 1928–1940, 2012.
Tarnocai, C., Gould, J., Broll, G., and Achuff, P.: Ecosystem and trafficability monitoring for
5
Quttinirpaaq National Park (11-year evaluation), Research branch, Agriculature and Agri-Food Canada, Ottawa, Canada, 169 pp., 2001.
Thompson, B.: Climate, in: Resource Description and Analysis – Ellesmere Island National Park Reserve, Natural Resource Conservation Section, Prairie and Northern Region, Parks Canada, Department of Canadian Heritage, Winnipeg, Canada, 78 pp., 1994.
10
Updegraff, K., Pastor, J., Bridgham, S. D., and Johnston, C. A.: Environmental and substrate controls over carbon and nitrogen mineralization in northern wetlands, Ecol. Appl., 5, 151– 163, 1995.
van Huissteden, J., Maximov, T. C., and Dolman, A. J.: High methane flux from an arctic floodplain (Indigirka lowlands, eastern Siberia), J. Geophys. Res.-Biogeo., 110, G02002,
15
doi:10.1029/2005JG000010, 2005.
Wadham, J. L., Arndt, S., Tulaczyk, S., Stibal, M., Tranter, M., Telling, J., Lis, G. P., Lawson, E., Ridgwell, A., Dubnick, A., Sharp, M. J., Anesio, A. M., and Butler, C. E. H.: Potential methane reservoirs beneath Antarctica, Nature, 488, 633–637, 2012.
Walker, D. A., Raynolds, M. K., Daniels, F. J. A., Einarsson, E., Elvebakk, A., Gould, W. A.,
20
Katenin, A. E., Kholod, S. S., Markon, C. J., Melnikov, E. S., Moskalenko, N. G., Talbot, S. S., and Yurtsev, B. A.: The Circumpolar Arctic vegetation map, J. Veg. Sci., 16, 267–282, 2005. Walker, M. D., Wahren, C. H., Hollister, R. D., Henry, G. H. R., Ahlquist, L. E., Alatalo, J. M.,
Bret-Harte, M. S., Calef, M. P., Callaghan, T. V., Carrol, A. B., Epstein, H. E., Jonsdottir, I. S., Klein, J. A., Magnusson, B., Molau, U., Oberbauer, S. F., Rewa, S. P., Robinson, C.
25
H., Shaver, G. R., Suding, K. N., Thompson, C. C., Tolvanen, A., Totland, O., Turner, P. L., Tweedie, C. E., Webber, P. J., and Wookey, P. A.: Plant community responses to experimental warming across the tundra biome, P. Natl. Acad. Sci. USA, 103, 1342–1346, 2006.
Webb, E. K., Pearman, G. I., and Leuning, R.: Correction of flux measurements for density effects due to heat and water-vapor transfer, Q. J. Roy. Meteor. Soc., 106, 85–100, 1980.
30
Whalen, S. C. and Reeburgh, W. S.: Consumption of atmospheric methane by Tundra soils, Nature, 346, 160–162, 1990.
BGD
11, 1673–1706, 2014Growing season high Arctic methane
exchange
C. A. Emmerton et al.
Title Page
Abstract Introduction
Conclusions References
Tables Figures
◭ ◮
◭ ◮
Back Close
Full Screen / Esc
Printer-friendly Version Interactive Discussion
Discussion
P
a
per
|
D
iscussion
P
a
per
|
Discussion
P
a
per
|
Discuss
ion
P
a
per
|
Whalen, S. C. and Reeburgh, W. S.: Moisture and temperature sensitivity of CH4oxidation in boreal soils, Soil Biol. Biochem., 28, 1271–1281, 1996.
Wille, C., Kutzbach, L., Sachs, T., Wagner, D., and Pfeiffer, E. M.: Methane emission from Siberian arctic polygonal tundra: Eddy covariance measurements and modeling, Glob. Change Biol., 14, 1395–1408, 2008.