National Journal of Community Medicine│Volume 4│Issue 1│Jan – Mar 2013 Page 91
Original Article ▌
PREVALENCE AND EPIDEMIOLOGICAL DETERMINANTS
OF MALNUTRITION AMONG UNDER-FIVES IN AN
URBAN SLUM, NAGPUR
Poonam P Dhatrak1, Smita Pitale2, N B Kasturwar3, Jaydeep Nayse4, Nisha Relwani1
Financial Support: None declared
Conflict of interest: None declared
Copy right: The Journal retains the
copyrights of this article. However, reproduction of this article in the part or total in any form is permissible with due
acknowledgement of the source.
How to cite this article:
Dhatrak PP, Pitale S, Kasturwar NB, Nayse J, Relwani N. Prevalence and Epidemiological Determinants of Malnutrition among Under-Fives in an Urban Slum, Nagpur. Natl J Community Med 2013; 4(1): 91-5.
Author’s Affiliation:
1Post Graduate Student; 2Associate Professor; 3Professor & Head; 4Assistant Professor, Department of Community Medicine, NKP Salve Institute of Medical Sciences and Research Centre, Nagpur
Correspondence:
Dr. Poonam P. Dhatrak,
Email:drpoonamdhatrak@gmail.com
Date of Submission: 20-11-12
Date of Acceptance: 15-02-13
Date of Publication: 31-03-13
ABSTRACT
Background: The prevalence of malnutrition among preschool children can be used to determine the need for nutritional surveillance, nutritional care, or appropriate nutritional intervention programmes in a community.
Objectives: To study prevalence of stunting, wasting and underweight in under fives and to find out epidemiological determinants associated with malnutrition.
Methodology: A community based cross-sectional study was carried out to assess prevalence of stunting, wasting, underweight and epidemiological determinants associated with malnutrition among under-fives in the field practice area of Urban health training centre (UHTC), dept. of Community Medicine, NKP Salve Institute of Medical Sciences and Research Centre, Nagpur. Data was collected by predesigned, pre-tested questionnaires. Data analysis was done by using Epi Info software.
Results: Out of the total 150 children 46% were underweight, 52% were stunted and 20.7% were wasted. The total prevalence of malnutrition was 63.33%. The factors associated with malnutrition were low birth weight (85%), mothers literacy (77.78%), fathers literacy (73.97), lack of exclusive breast feeding (81.25%), socio-economic-status (74.44%) and incomplete immunization (76.19%).
Conclusion: The study strongly points toward the importance of proper infant feeding practises, proper nutrition, parental education and improved living conditions for reducing malnutrition among under-five children.
Key words: Prevalence, stunting, wasting, underweight, malnutrition, epidemiological determinants.
INTRODUCTION
Pre-school children constitute the most vulnerable segment of any community. Their nutritional status is a sensitive indicator of community health and nutrition. Under-nutrition among them is one of the greatest public health problems in developing countries. Attempts to reduce child mortality in developing countries through selective primary health care
have focused primarily on the prevention and control of specific infectious diseases, with less effort being directed to improving children’s underlying nutritional status.1
During 2003-08 more than 23% of worlds children under five years of age were under weight for their age. At present in India 48% children under five years age are under weight.2
severe malnutrition, of these, 20% have moderate to severe wasting and 48% moderate to severe stunting.2 The global community has set a target
of halving the prevalence of underweight children by 2015 as a key indicator of progress towards the Millennium Development Goal (MDG) of eradicating extreme poverty and hunger.3
The three main indicators used to define undernutrition, i.e., underweight, stunting, and wasting, represent different histories of nutritional insult to the child. Occurring primarily in the first 2–3 years of life, linear growth retardation (stunting) is frequently associated with repeated exposure to adverse economic conditions, poor sanitation, and the interactive effects of poor energy and nutrient intakes and infection. Low weight-for-age indicates a history of poor health or nutritional insult to the child, including recurrent illness and/or starvation, while a low weight-for-height is an indicator of wasting (i.e., thinness) and is generally associated with recent illness and failure to gain weight or a loss of weight.4
The main and immediate causes of children growth failure are a lack of adequate food and the high incidence of infectious disease. Thus, adequate food and non food input are required for good nutrition. Poverty is the major cause of
inadequate food intake.5 The aetiology of
malnutrition is complex and multi-factorial. It is usually a consequence of inadequate dietary intake and disease. However, this occurs in combination with multiple social, economic, cultural and political elements.6
OBJECTIVES
To study prevalence of stunting, wasting and underweight in under fives and to find out epidemiological determinants associated with malnutrition.
MATERIALS AND METHODS
A community based cross sectional study was carried out in the field practice area of Urban health training centre (UHTC), dept. of Community Medicine, NKP Salve Institute of Medical Sciences and Research Centre, Nagpur. The total population of the area is around 20,342 having 3188 houses among which under five children were approximately 2525. Based on prevalence of 40% (underweight),7 a sample of
150 was calculated with an allowable error of 8% by using the formula (1.96)2*pq/L2.
After Ethical Committee approval of our institution a house to house survey was carried out selecting every seventeenth house of total 3188 by systematic random sampling. The first house was selected by lottery method and then every seventeenth house was surveyed until the desired sample size was achieved. After visiting a house, informed consent of the caretaker was taken and detailed interview of caretaker was conducted regarding socio-economic status(SES), feeding of child, immunization status, parental literacy and was entered in a pre-designed questionnaire. Age of the child was determined by reviewing the Birth certificate. Anthropometric measurements were carried out following standard methods. The data included
weight, recumbent length (for children less than 24 months of age) and height (for children more than 24 months of age). Weight was measured to the nearest 0.1 Kg and Salter weighing machine was used for weight measurement. Height was measured against a non stretchable tape fixed to a vertical wall, with the participant standing on a firm/level surface and it was measured to the nearest 0.5 cm. Recumbent length (for children less than 24 months of age) was measured by using an infant measuring board.
Socio-economic status (SES) - was determined by using Modified Prasad’s scale.8 Data of the
nutritional survey were analyzed using WHO Anthro for personal computers, version 3.1, 2010.9
Statistical analysis: The data was analysed with Epi info version 3.4.3. Odds ratio and p value were used to examine the relation between variables.
RESULTS
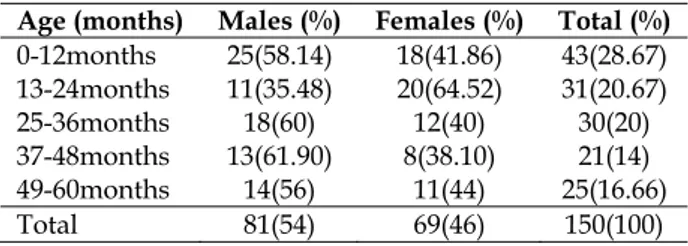
Table 1:- Age & gender distribution of study population (n=150)
Age (months) Males (%) Females (%) Total (%)
0-12months 25(58.14) 18(41.86) 43(28.67) 13-24months 11(35.48) 20(64.52) 31(20.67) 25-36months 18(60) 12(40) 30(20) 37-48months 13(61.90) 8(38.10) 21(14) 49-60months 14(56) 11(44) 25(16.66)
Total 81(54) 69(46) 150(100)
National Journal of Community Medicine│Volume 4│Issue 1│Jan – Mar 2013 Page 93
total 150 children, 81(54%) were males maximum being in the age group 37-48 months i.e. (61.90%) and 69 (46%) were females maximum in the age group 13-24 months i.e. (64.52%) . There were 43(28.67%) infants and 21(14%) children in the age group of 37-48 months.
Table 2 shows prevalence of underweight, stunting and wasting. It was seen that 45(35%) children were underweight and 24(16%) were severely underweight, 34(22.7%) children were stunted and 44(29.3%) were severely stunted, 19(12.7%) were wasted and 12(8%) were severely wasted.
Table 2:- Prevalence of underweight, stunting and wasting in study population (n=150)
Underweight(%) Stunting(%) Wasting(%)
<-2SD 45(30) 34(22.7) 19(12.7) <-3SD 24(16) 44(29.3) 12(8) Normal 81(54) 72(48) 119(79.3)
Total 150 150 150
A child either underweight, wasted or stunted or any combination of the three was considered as having malnutrition which comes to be 63.33% indicating prevalence of malnutrition. Malnutrition was prevalent in 56(58.95%) males and 39(41.05%) females. Malnutrition was highest amongst infants 26(27.37%) and lowest in 37-48months age group i.e. 14(14.74%). (Table 3)
Table 3:- Age & gender-wise distribution of malnutrition in study population (n=95)
Age (months)
Males (%) Females (%)
Total (%)
0-12months 16(61.54) 10(38.46) 26(27.37) 13-24months 6(35.29) 11(64.71) 17(17.89) 25-36months 13(65) 7(35) 20(21.05) 37-48months 10(71.43) 4(28.57) 14(14.74) 49-60months 11(61.11) 7(38.89) 18(18.95)
Total 56(58.95) 39(41.05) 95(100)
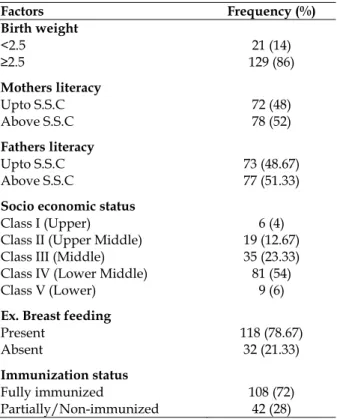
Table 4 shows epidemiological factors of under five children. It was observed that 21(14%) children were low birth weight. Parents literacy profile showed that 72(48%) mothers and 73(48.67%) fathers were educated upto S.S.C. whereas 78(52%) mothers and 77(51.33%) fathers were educated above S.S.C. Classification of socio-economic status according to updated Prasad Scale showed that maximum i.e. 81(54%) children belonged to lower middle class families and minimum 6(4%) belonged to upper class whereas 35(23.33%) children belonged to middle class families. Exclusive breast feeding was
present in 118(78.67%) children, 108(72%) children were fully immunized till date and 42(28%) were partially or non-immunized.
Table 4:- Epidemiological factors of the study population (n=150)
Factors Frequency (%)
Birth weight
<2.5 21 (14)
≥2.5 129 (86)
Mothers literacy
Upto S.S.C 72 (48)
Above S.S.C 78 (52)
Fathers literacy
Upto S.S.C 73 (48.67)
Above S.S.C 77 (51.33)
Socio economic status
Class I (Upper) 6 (4)
Class II (Upper Middle) 19 (12.67) Class III (Middle) 35 (23.33) Class IV (Lower Middle) 81 (54)
Class V (Lower) 9 (6)
Ex. Breast feeding
Present 118 (78.67)
Absent 32 (21.33)
Immunization status
Fully immunized 108 (72)
Partially/Non-immunized 42 (28)
Table 5 shows associations of certain risk factors with malnutrition. It was found that low birth weight 18 (85.71%) (p<0.05), mothers education below S.S.C. 56(77.78%) (p<0.001), fathers education below S.S.C. 54 (73.97%) (p<0.05), lower socio-economic class 67 (74.44%) (p<0.001), lack of exclusive breast feeding 26 (81.25%) (p<0.05) and non-immunized children 32 (76.19) (p<0.05) were statistically associated with malnutrition. No association was found between age and gender of the child and malnutrition (p>0.05).
DISCUSSION
In our study prevalence of underweight, wasting and stunting was 46%, 20.7% and 52% respectively giving total prevalence of malnutrition to be 63.33% which is almost same with NFHS-37 data (40%, 23%, 45%). This finding
is higher than the studies conducted by Avachat SS11 (50.46%) and Bloss E4 (30 % underweight,
47% stunted, and 7% wasted) and lower than studies of Sengupta P3 (74% stunted, 42% wasted
and 29.5% underweight), Biswas T12 (64.9%
stunted, 20.3% wasted and 64.9% underweight) and Rao VG1 [underweight (61.6%), stunting
(51.6%) and wasting (32.9%)].
Table 5:- Association between risk factors and malnutrition
Risk factors Malnourished (%) Normal (%) Chi-square Odds ratio p-value
Age
0-24 months 43 (58.11) 31(41.89) 1.717 0.6402 >0.05 25-60 months 52 (68.42) 24(31.58)
Sex
Female 39 (56.52) 30(43.48) 2.553 0.5804 >0.05
Male 56 (69.14) 25(30.86)
Birth weight
<2.5 18 (85.71) 3(14.29) 5.267 4.052 <0.05*
≥2.5 77 (59.69) 52(40.31)
Mothers literacy
Upto S.S.C 56 (77.78) 16(22.22) 12.44 3.5 <0.001†
Above S.S.C 39 (50) 39(50)
Fathers literacy
Upto S.S.C 54 (73.97) 19(26.03) 6.932 2.496 <0.05*
Above S.S.C 41 (53.25) 36(46.75)
Socio economic status
Class IV & V 67 (74.44) 23(25.56) 11.96 3.329 <0.001† Class I, II, III 28 (46.67) 32(53.33)
Ex. Breast feeding
Absent 26 (81.25) 6(18.75) 5.623 3.077 <0.05*
Present 69 (58.47) 49(41.53)
Immunization status
Partially/Non-immunized 32 (76.19) 10(23.81) 4.152 2.286 <0.05* Fully immunized 63 (58.33) 45(41.67)
* - Significant † - Highly significant
In our study no association was found between age and gender of the child with malnutrition (p>0.05) which is comparable with the study of Rao VG1 and contradicts the finding of studies
conducted by Avachat SS11 which founded
association with age (p<0.05), with female gender by Sharghi13 A(p=0.01) and Sengupta P3
that found association with both age and gender (p<0.05)
In our study 18 (85.71%) low birth weight children were found to be malnourished and showed significant statistical association (p<0.05) which is similar to the study conducted by Avachat SS11 (88.98%, p<0.05) and higher than
the study of Nozomi M5 (35.3% LBW in stunted
children and 29.4% in underweight; p < 0.05). Prevalence of underweight was observed being
significantly higher (p=0.024) in LBW children by Sengupta P3.
Prevalence of malnutrition was 56(77.78%) in children having their mothers literacy below S.S.C (p<0.001). Similar findings were reported
from the studies conducted by Nozomi M5
(15.9%, p< 0.05) and Sengupta P3 (p=0.04)
whereas the study conducted by Harishankar14
observed no association between mothers literacy and malnutrition (p>0.01).
Prevalence of malnutrition was 54(73.97%) in children having their fathers literacy below S.S.C (p<0.05). Md. Israt Rayhan15 also stated an
inverse relation between father’s education and
under-weight whereas studies of Nozomi M5
and Sengupta P3 found no association between
National Journal of Community Medicine│Volume 4│Issue 1│Jan – Mar 2013 Page 95
In our study 67 (74.44%) children from lower socio-economic class had malnutrition (p<0.001). Study of Sapkota VP16 reportedfour times risk of
underweight in children from poor socioeconomic class (40.3%) [OR= 4.336]. Similar findings were reported by Khan Khattak M.M.A17 (41.05% underweight in lower class).
Prevalence of malnutrition was 26 (81.25%) in children with lack of exclusive breast feeding (p<0.05). Sengupta P3 and Biswas T12 also
reported association between lack of exclusive breast feeding and underweight (p<0.05)
In our study, 32 (76.19%) (p<0.05) non-immunized children had malnutrition, similar findings were reported by Biswas T12 (p=0.049)
whereas Sengupta P3 observed no association
between the two.
CONCLUSION
We found that more than half of the study population had malnutrition and the risk factors associated with malnutrition were parents’ literacy, low birth weight, lack of exclusive breast feeding, immunization status and socio-economic status of family. The study strongly points towards the importance of proper infant feeding practises, proper nutrition, parental education and improved living conditions for reducing malnutrition among under-five children. The high prevalence of malnutrition in the community requires that National Nutritional Programme should monitor the growth of the under-five children in terms of weight for height. Since socioeconomic status, in terms of food sufficiency was found predicting nutritional status of under-five children; coordination with income generation and food production activities might be an option to make nutritional interventions more effective.
REFERENCES
1. Rao V G, Yadav R, Dolla C K, Kumar S, Bhondeley M K, Ukey M. Undernutrition & childhood morbidities among tribal preschool children. Indian J. Med. Res. 2005; 122: 43-47.
2. K. Park. Parks Textbook of Preventive and Social Medicine- 21st Edition. Jabalpur: Banarsidas Bhanot
Publishers; 2011: 506-507.
3. Sengupta P, Philip N, Benjamin A I. Epidemiological correlates of under-nutrition in under-5 years children in an urban slum of Ludhiana. HPPI. 2010; 33 (1): 1-9. 4. Bloss E, Wainaina F, Bailey R C. Prevalence and
Predictors of Underweight, Stunting, and Wasting among Children Aged 5 and Under in Western Kenya. Journal of Tropical Pediatrics. 2004; 50(5): 260-270. 5. Nojomi M, Tehrani A, Shahandokht Najm-Abadi MS.
Risk analysis of growth failure in under-5-year children. Archives of Iranian Medicine. 2004; 7( 3): 195 200. 6. Syed Farid-ul-Hasnain, Raafay Sophie. Prevalence and
risk factors for Stunting among children under 5 years: a community based study from Jhangara town, Dadu Sindh. J Pak Med Assoc. 2010; 60(1): 41-44.
7. Govt. of India. National family Health survey. NFHS III (2005-2006). International Institute for Population Sciences, Ministry of Health & Family Welfare, Mumbai 2007.
8. Kumar P. Social Classification need for constant Upgrading. Ind. J Comm Med; 1993: 18(2).
9. Software for assessing growth and development of the world’s children. Geneva: WHO, 2010
(http://www.who.int/childgrowth/software/en/). 10. Rao S, Joshi S B, Kelkar R S. Changes in nutritional
status and morbidity over time among pre-school children from slums in Pune, India. Indian Pediatrics. 2000; 37: 1060-1071.
11. Avachat S S, Phalke V D, Phalke D B. Epidemiological study of malnutrition (undernutrition) among under five children in a section of rural area. Pravara Med Rev. 2009; 4(2): 20-22.
12. Biswas T, Mandal P K, Biswas S. Assessment of health, nutrition and immunization status amongst under- 5 children in migratory brick klin population of periurban Kolkata, India. Sudanese Journal of Public Health. 2011; 6(1): 7-13.
13. Sharghi A, Kamran A, Faridan M. Evaluating risk factors for protein-energy malnutrition in children under the age of six years: a case-control study from Iran. Int J Gen Med. 2011; 4: 607-611.
14. Harishankar, Dwivedi S, Dabral S B, Walia D K. Nutritional status of children under 6 years of age. Indian J. Prev. Soc. Med. 2004; 35: 156-162. 15. Md. Israt Rayhan, Khan S H. Factors causing
malnutrition among under five children in Bangladesh. Pakistan Journal of Nutrition. 2006; 5(6): 558-562. 16. Sapkota V P, Gurung CK. Prevalence and predictors of
underweight, stunting and wasting in under five children. 2009. J Nepal Health Res Counc. 2009; 7(15): 120-126.