AMTD
5, 5691–5724, 2012XCO2-measurements
with a tabletop FTS
M. Gisi et al.
Title Page Abstract Introduction Conclusions References Tables Figures
◭ ◮
◭ ◮
Back Close Full Screen / Esc
Printer-friendly Version Interactive Discussion
Discussion
P
a
per
|
Dis
cussion
P
a
per
|
Discussion
P
a
per
|
Discussio
n
P
a
per
Atmos. Meas. Tech. Discuss., 5, 5691–5724, 2012 www.atmos-meas-tech-discuss.net/5/5691/2012/ doi:10.5194/amtd-5-5691-2012
© Author(s) 2012. CC Attribution 3.0 License.
Atmospheric Measurement Techniques Discussions
This discussion paper is/has been under review for the journal Atmospheric Measurement Techniques (AMT). Please refer to the corresponding final paper in AMT if available.
XCO
2
-measurements with a tabletop FTS
using solar absorption spectroscopy
M. Gisi1, F. Hase1, S. Dohe1, T. Blumenstock1, A. Simon2, and A. Keens2 1
Karlsruhe Institute of Technology (KIT), Institute for Meteorology and Climate Research (IMK-ASF), Karlsruhe, Germany
2
Bruker Optics GmbH, Ettlingen, Germany
Received: 24 July 2012 – Accepted: 10 August 2012 – Published: 17 August 2012 Correspondence to: M. Gisi (michael.gisi@kit.edu)
AMTD
5, 5691–5724, 2012XCO2-measurements
with a tabletop FTS
M. Gisi et al.
Title Page Abstract Introduction Conclusions References Tables Figures
◭ ◮
◭ ◮
Back Close Full Screen / Esc
Printer-friendly Version Interactive Discussion
Discussion
P
a
per
|
Dis
cussion
P
a
per
|
Discussion
P
a
per
|
Discussio
n
P
a
per
|
Abstract
A commercial low-resolution (0.5 cm−1) Fourier-Transform-Spectrometer (FTS) has
been modified and is used for determining the total column XCO2 of the atmosphere
by analyzing direct solar radiation. The spectrometer has a small home-built solar tracker attached, so that it is a ready-to-use instrument. The results are validated with
5
temporally coinciding on-site measurements taken with a high-resolution Total Car-bon Column Observing Network (TCCON) FTIR-spectrometer. For the whole compar-ison period of 5 months (26 measurement days) an agreement with TCCON-results
of (0.12±0.08) % is achieved. This makes the spectrometer a promising candidate for
a low-cost addition to the TCCON core FTIR sites, especially suitable for locations
10
with limited infrastructure. An impressive mechanical and thermal stability is proved, enabling the spectrometer for use in field campaigns and for the monitoring of local sources.
1 Introduction
Within the last several years, it has been recognized that a precise knowledge of
15
the global abundances of greenhouse gases such as CO2, CO and CH4 is required
for understanding the mechanisms of the global carbon cycle and to determine it’s sources and sinks (Olsen and Randerson, 2004). To measure column averaged mole fractions of these gases, several satellite-borne instruments were developed such as SCIAMACY, GOSAT and OCO/OCO-2 (http://oco.jpl.nasa.gov/news/). The latter two
20
missions are exclusively dedicated on measuring greenhouse gases and OCO-2 will presumably be launched in 2014. To support and validate these measurements great
efforts have been undertaken to set up the Total Carbon Column Observation Network
(TCCON). It consists of about 18 globally distributed, ground-based solar absorption Fourier transform spectrometers operating in the Near-Infrared (NIR) spectral region
25
AMTD
5, 5691–5724, 2012XCO2-measurements
with a tabletop FTS
M. Gisi et al.
Title Page Abstract Introduction Conclusions References Tables Figures
◭ ◮
◭ ◮
Back Close Full Screen / Esc
Printer-friendly Version Interactive Discussion
Discussion
P
a
per
|
Dis
cussion
P
a
per
|
Discussion
P
a
per
|
Discussio
n
P
a
per
spectrometers achieve an unprecedented accuracy of 0.25 percent for the atmospheric
XCO2 content (Wunch et al., 2011). The XCO2, which is the column-averaged dry-air
mole fraction, is derived by ratioing the measured CO2and O2total columns by
XCO2=CO2,column/O2,column·0.2095 (1)
This approach compensates for numerous systematic errors, such as a pointing offset
5
or an erroneous surface pressure. To make the network results comparable to WMO
(World Meteorological Organization) standards, the retrieved XCO2 value is divided
by a calibration factor of 0.989. This value was determined by comparisons with in situ profiles measured in the framework of aircraft campaigns (Wunch et al., 2010; Messerschmidt et al., 2011).
10
Despite it’s outstanding capabilities such as the precision and stability during nor-mal operations, the IFS125HR-spectrometers from Bruker used by the TCCON also have their downsides. The IFS125HR is an expensive high-precision instrument, its
large dimensions in the order of 1×1×3 m and the weight well beyond 100 kg makes
it difficult to transport, and its operation requires a significant amount of infrastructure,
15
such as a stable support platform, air conditioning and sufficiently large lab space. For
regular maintenance such as realignment and for repairs, an experienced person has
to access the instrument, which can be difficult and time-consuming. The IFS125HR is
not a portable spectrometer, moving it to a new site requires time-consuming start-up procedures. These obstacles impede the scientifically important ground-based
exten-20
sion of atmospheric carbon column measurement on a global scale, e.g. in Africa and South America.
Some flexibility is gained by integrating the spectrometer into an overseas container including air-conditioners and solar-trackers (Geibel et al., 2010). But still, a truck and a forklift have to be available as the containers measure about 15 ft and weight several
25
AMTD
5, 5691–5724, 2012XCO2-measurements
with a tabletop FTS
M. Gisi et al.
Title Page Abstract Introduction Conclusions References Tables Figures
◭ ◮
◭ ◮
Back Close Full Screen / Esc
Printer-friendly Version Interactive Discussion
Discussion
P
a
per
|
Dis
cussion
P
a
per
|
Discussion
P
a
per
|
Discussio
n
P
a
per
|
To overcome these problems, the usage of smaller, cheaper and more easily trans-portable spectrometers were recently investigated towards the ability to measure
XCO2. Besides the ability to be used easily in field campaigns, assuming a sufficient
compactness and mechanical stability, the spectrometers could even be sent back and
serviced by the manufacturer or the staffof the home institution for repairs or
realign-5
ments, reducing the costs and effort significantly. In addition, instruments with lower
requirements to the ambient temperatures would simplify global deployments.
One alternative is the IFS125M-instrument, which is smaller and less sturdy than
the IFS125HR, while offering comparable resolution. Due to its lightweight design, the
stability of the instrumental line shape (ILS) is not at the level of the IFS125HR
spec-10
trometer, so that it is difficult to achieve the long-term-stability required by TCCON
(V. Sherlock, NIWA, personal communication, 2012). In addition, it still has a length of about 2 m and requires on-site realignment by qualified personnel. The IFS125M spectrometer has been successfully operated on ships (Notholt et al., 2000).
In addition, several compact and medium to low-resolution instruments currently
15
are under investigation, such as a grating spectrometer (about 0.16 cm−1
resolu-tion), a fiber Fabry-Perot interferometer (both setups presented in Kobayashi et al.
(2010)), the IFS66 from Bruker (0.11 cm−1) (Petri et al., 2012), a Nicolet Spectrometer
from Thermo-Scientific (0.125 cm−1) (Chen et al., 2012) and the IR-Cube from Bruker
(0.5 cm−1) (Jones et al., 2012).
20
In this work we demonstrate for the first time the suitability of a very compact setup,
consisting of a modified commercial FTS with a resolution of 0.5 cm−1 and a
minia-ture solar tracker attached to it. We verify the long term stability, present the tracker
setup and the modifications applied to the commercial spectrometer to achieve XCO2
measurements with a precision 0.08 % over several months, validated with respect to
25
AMTD
5, 5691–5724, 2012XCO2-measurements
with a tabletop FTS
M. Gisi et al.
Title Page Abstract Introduction Conclusions References Tables Figures
◭ ◮
◭ ◮
Back Close Full Screen / Esc
Printer-friendly Version Interactive Discussion
Discussion
P
a
per
|
Dis
cussion
P
a
per
|
Discussion
P
a
per
|
Discussio
n
P
a
per
2 Instrumentation
Our aim was to investigate the capabilities of a compact and robust spectrometer,
which is sufficiently small and light to be carried by one person, without compromising
the ability to align, modify and check internal optical components due to the compact-ness. In addition we developed a small and transportable solar tracker which is directly
5
attached to the spectrometer. This merged setup, which is displayed in Fig. 1, is ready to use for various kinds of environmental research measurements.
2.1 Home-built tracker
The target requirements for the tracker were to reach a high tracking precision with a compact and lightweight setup. We decided to realize an alt-azimuthal tracker, with 2
10
stepper-motor driven rotation stages. The complete tracker weights about 2 kg and has
the dimensions 30×20×10 cm. It supports a beam diameter of 50 mm, which actually
is much wider than required for the purpose described in this paper, as only a beam diameter of 3 mm is used for the solar absorption measurements (see Sect. 2.2). How-ever, this fact allows to apply the tracker for other kinds of observations (e.g. lunar,
15
open path, emission measurements). We used 2 rotation stages with hollow axes from Standa (http://www.standa.lt). They are driven by stepper-motors controlled by the “SMCI12” motor drivers from Nanotec (http://www.nanotec.com), allowing a microstep-size of 1/64th of a full step, which results in a theoretical 0.56 arc seconds resolution
along both axes. The mirrors are elliptic glass plates with SiO2 protected aluminum
20
coating.
The tracker is controlled by our CamTracker approach, so the optical tracking feed-back is derived from a camera recording the field stop stop of the spectrometer, leading to very consistent control of the spectrometer’s line of sight. Technical details are given in Gisi et al. (2011). A camera-image of the illuminated aperture is shown in Fig. 3.
AMTD
5, 5691–5724, 2012XCO2-measurements
with a tabletop FTS
M. Gisi et al.
Title Page Abstract Introduction Conclusions References Tables Figures
◭ ◮
◭ ◮
Back Close Full Screen / Esc
Printer-friendly Version Interactive Discussion
Discussion
P
a
per
|
Dis
cussion
P
a
per
|
Discussion
P
a
per
|
Discussio
n
P
a
per
|
2.2 The NIR-modified EM27 spectrometer
We decided to use the EM27™-spectrometer from Bruker. This spectrometer uses the
RockSolid™ pendulum interferometer with 2 cube-corner mirrors and a CaF2
beam-splitter, which offers very high stability with respect to thermal and mechanical
dis-turbances. The interferometer supports a beam diameter of 40 mm. The pendulum
5
is attached by springs, resulting in frictionless and wear-free movements. This princi-ple results in even higher reliability of the interferometer in comparison to the 125HR
setup. The latter suffers from wear due to use of friction bearings on the linearly moving
retroreflector. This wear introduces a shear misalignment and requires regular realign-ment (Hase, 2012).
10
The EM27 achieves 1.8 cm optical path difference equivalent to 0.5 cm−1resolution.
To realize this, the retroreflectors of the pendulum structure are moving by a geomet-ric distance of 0.45 cm. The sampling of the interferogram is controlled by a standard, not frequency-stabilized HeNe-laser. The sealed spectrometer compartment contains a desiccant cartridge; the radiation enters through a wedged fused silica window. So
15
the spectrometer withstands and can be operated in adverse environmental conditions,
e.g. high relative humidity. It measures approximately 35×40×27 cm and weights 25 kg
including our home-built tracker. Due to the current electronics, with a resolution of
0.5 cm−1, the spectrometer is capable of recording single-sided interferograms only,
however, an electronics update will overcome this limitation in the future. It is compact
20
enough to be carried by one person, but still offers sufficient space inside for
modifica-tions and alignments of the light path, allowing us to test various setups.
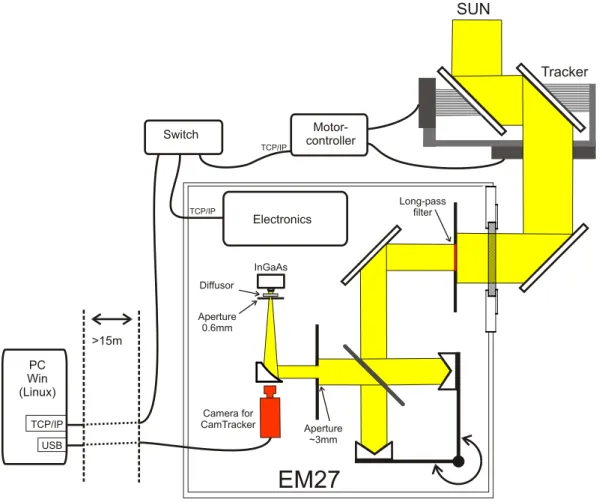
A schematic drawing of the EM27 with modifications is presented in Fig. 2. The tracker, which was described in Sect. 2.1, leads the solar radiation into the EM27 spec-trometer. We limit the beam to 25 mm free diameter by using a 750 nm long-pass-filter
25
AMTD
5, 5691–5724, 2012XCO2-measurements
with a tabletop FTS
M. Gisi et al.
Title Page Abstract Introduction Conclusions References Tables Figures
◭ ◮
◭ ◮
Back Close Full Screen / Esc
Printer-friendly Version Interactive Discussion
Discussion
P
a
per
|
Dis
cussion
P
a
per
|
Discussion
P
a
per
|
Discussio
n
P
a
per
After the radiation has passed the interferometer, it is blocked by an aperture (which forms the aperture stop of the optical system) with a diameter of 3 mm. We inserted this aperture for controlling optical aberrations (to achieve a near-theoretical instrumental line shape, see Sect. 3.1) and for avoiding nonlinear detector response. The remain-ing part of the radiation is appropriate for recordremain-ing solar absorption spectra. Finally
5
the beam is focused on a field stop with 0.6 mm diameter by a 90 degrees off-axis
paraboloid with an effective focal length of 101.6 mm. In combination, this results in
a semi Field of View (FOV) of 2.96 mrad. The field stop is inclined versus the optical axis by a few degrees to avoid channeling. As partially illuminated detectors show
un-wanted non-linear and ILS-effects, a diffuser was placed between the field stop and
10
the InGaAs-detector (size 1×1 mm2, spectral sensitivity 6000–9000 cm−1). The
detec-tor signal is DC-coupled, allowing to correct for solar intensity variations due to thin clouds (Keppel-Aleks et al., 2007).
The image of the sun on the field stop is recorded by the camera which then is used as the optical feedback for the tracker (CamTracker), as described in (Gisi et al., 2011).
15
This is a very precise method for controlling the actual line of sight of the spectrometer.
Changes of the alignment of any mirror, e.g. during transportation, have no effect on
the accuracy of the tracking and the resulting line of sight. An image of the sun on the aperture as it is recorded by the camera is shown in Fig. 3.
The tracker and the EM27-interferometer are connected to a controlling computer
20
via a standard network cable. The USB cable of the camera uses a separate outlet of the housing of the spectrometer and is connected with a 15 m active USB extension cable to the computer.
The controlling computer is equipped with an Intel 3.2 Ghz processor, runs Win-dows 7, the operating-software for the spectrometer (Opus 7) and the
CamTracker-25
AMTD
5, 5691–5724, 2012XCO2-measurements
with a tabletop FTS
M. Gisi et al.
Title Page Abstract Introduction Conclusions References Tables Figures
◭ ◮
◭ ◮
Back Close Full Screen / Esc
Printer-friendly Version Interactive Discussion
Discussion
P
a
per
|
Dis
cussion
P
a
per
|
Discussion
P
a
per
|
Discussio
n
P
a
per
|
3 Characteristics
3.1 Instrumental line shape
Any quantitative trace gas retrieval depends on a proper knowledge of the spectral degradation characteristics. For FTIR-spectrometers this instrumental line shape (ILS) is advantageously separated into one part which refers to the inherent self-apodization
5
of an FTS with circular field stop, and therefore also exists for an ideally aligned spec-trometer. This contribution can be calculated easily by the spectrometers field-of-view
and the optical path difference of the interferometer. The second component of the
ILS can be described by a complex modulation efficiency (represented by a
modula-tion amplitude and a phase error, both funcmodula-tions of optical path difference) which result
10
from misalignments and optical aberrations. These parameters have to be derived by experiment, e.g. by evaluating gas cell measurements (Hase et al., 1999).
A standard approach for the high-resolution FTIR-instruments is to use low-pressure gas cells. We checked the ILS of the EM27 by measuring the water vapor lines of about 2 m in ambient air using a collimated standard halogen bulb as light source. This
15
minimalistic approach makes a gas cell obsolete and can easily be performed, e.g. during measurement campaigns. To analyze these results and to obtain the modulation
efficiency and the phase error, we used the version 12 of the LINEFIT program (Hase
et al., 1999). The required parameters for the correct interpretation of the spectrum are the ambient temperature, the total pressure and the partial water pressure (the latter is
20
a by-product of the LINEFIT analysis).
We performed these measurements 2 times within the time series presented in this
paper. On 8 February 2012 and 22 May 2012 the derived modulation efficiencies were
0.9954 and 0.9910 respectively. However, as the water vapor lines in HITRAN which
we used contain inaccuracies, the absolute value for the derived modulation efficiency
25
AMTD
5, 5691–5724, 2012XCO2-measurements
with a tabletop FTS
M. Gisi et al.
Title Page Abstract Introduction Conclusions References Tables Figures
◭ ◮
◭ ◮
Back Close Full Screen / Esc
Printer-friendly Version Interactive Discussion
Discussion
P
a
per
|
Dis
cussion
P
a
per
|
Discussion
P
a
per
|
Discussio
n
P
a
per
of the modulation efficiency requires further study of the H2O line parameters in the
7000 cm−1
spectral region.
For our system with a spectral resolution of 0.5 cm−1an increase of 1 % of the
mod-ulation efficiency results in an XCO2 increase of 0.15 %. As in our time series the
assumed modulation efficiency changed by less than 0.5 %, we used a constant ideal
5
ILS in our retrievals. Note that no realignment of the spectrometer was performed over the whole period, although the spectrometer was transported frequently and was
ex-posed to temperatures between−10 and+40◦C. We estimate that our knowledge of
the absolute modulation efficiency is within 2 %, which implies that the systematic offset
between the EM27 and 125HR XCO2timeseries should be below 0.3 %
10
3.2 Ghost to parent ratio
For the recording of NIR spectra in the 6000 to 9000 cm−1 range, the IFG sampling
has to be performed at each rising and falling zero crossing of the laser AC signal. This makes the IFG recording prone to alternating sampling errors, which generates artifacts (ghosts) in spectral domain, as described in detail by Messerschmidt et al.
15
(2010). As this problem affected several TCCON measurement sites in the past, we
decided to check the GPR (ghost-to-parent ratio) for our setup.
In contrast to the IFS125HR-spectrometers, it is not possible to readjust the GPR with the currently available EM27 electronics. The laser-detecting photo diodes, however, are the same as used in the latest 125HR version.
20
With our EM27 spectrometer we measured a GPR of 2×10⁻⁴which is of the order
of the current TCCON recommendations (1×10⁻⁴). Hase recently suggested an IFG
resampling scheme (F. Hase, personal communication, 2011) which could be applied to reduce the GPR further, but we refrained for performing any correction because the GPR is rather small.
AMTD
5, 5691–5724, 2012XCO2-measurements
with a tabletop FTS
M. Gisi et al.
Title Page Abstract Introduction Conclusions References Tables Figures
◭ ◮
◭ ◮
Back Close Full Screen / Esc
Printer-friendly Version Interactive Discussion
Discussion
P
a
per
|
Dis
cussion
P
a
per
|
Discussion
P
a
per
|
Discussio
n
P
a
per
|
4 Measurements and analysis
4.1 Setup and operation of the spectrometers: EM27 and reference TCCON
spectrometer
We operated the EM27 spectrometer on the roof-terrace of our office-building at
133 m a.s.l. with the coordinates 49.094◦N and 8.4336◦E. The testing period covered
5
26 measurement days from 3 February 2012 to 22 June 2012. For each day of op-eration, the spectrometer was moved from its storing place in the fourth floor to the terrace on floor 7, see Fig. 1. As we used a simple unsprung trolley for transportation, the spectrometer was subject to significant mechanical vibrations. When placing the
spectrometer outside, we did not put much effort into a precise leveling or orientation.
10
A coarse orientation relative to the wall of the building was sufficient to enable the
CamTracker-program to detect the sun on the field plane and to center it to the field stop (see Fig. 3). During operation, the spectrometer experienced outside ambient
con-ditions. Temperatures in February were as low as−10◦C, in May the spectrometer was
heated to temperatures above 40◦C due to exposure to direct sunlight. We alternately
15
recorded single-sided interferograms with 0.5 cm−1 and double-sided interferograms
with 1 cm−1 resolution, with 10 averages each. The recording time for each of these
measurements (being an average of 10 IFGs) was about 34 s. The applied scanner
speed was 10 khz. For the further analysis in this work we only evaluated the 0.5 cm−1
resolution measurements, because a significant loss in contrast between the CO2lines
20
and the adjacent continuum is observed when the resolution is reduced to 1.0 cm−1,
as can be seen in Fig. 4.
The TCCON-instrument in Karlsruhe located about 700 m north of our office
build-ing at 110 m a.s.l. at the coordinates 49.100◦N and 8.4385◦E provided the reference
XCO2dataset. During each of the 26 EM27 measurement days, 125HR spectra were
25
recorded in parallel.
AMTD
5, 5691–5724, 2012XCO2-measurements
with a tabletop FTS
M. Gisi et al.
Title Page Abstract Introduction Conclusions References Tables Figures
◭ ◮
◭ ◮
Back Close Full Screen / Esc
Printer-friendly Version Interactive Discussion
Discussion
P
a
per
|
Dis
cussion
P
a
per
|
Discussion
P
a
per
|
Discussio
n
P
a
per
altitude are of relevance. These auxiliary data have been used for the analysis of the spectra (see Sect. 4.2).
4.2 Data processing and evaluation
The official analysis code for the TCCON network is GFIT. GFIT is maintained by G.
Toon at the California Institute of Technology and used by the TCCON as a part of
5
the software package GGG, which also includes preprocessing of the interferograms
and post-processing of the resulting XCO2. More details can be found in Wunch et al.
(2011). However, we preferred to use our own calibration tools and retrieval code PROFFIT Version 9.6 for the EM27 study. Our setup is well established for work within the NDACC FTIR network and has been validated in various studies (Schneider et al.,
10
2008, 2010; Sep ´ulveda et al., 2012). Therefore, we will first show that our setup well
reproduces the official TCCON 125HR XCO2 results for the high-resolution 125HR
spectra. Next we analyze the EM27 spectra and resolution-reduced 125HR spectra with our retrieval setup. The resolution-reduced 125HR spectra have been included to
discern instrumental effects from apparent XCO2changes when analyzing low
resolu-15
tion spectra.
We used the same O2 line list and the same CO2 and H2O a-priori mixing-ratio
profiles as used by the official TCCON analysis. For CO2 we used the HITRAN08
lines with own line-mixing parameters which we derived from a code provided by J.-M. Hartmann (Lamouroux et al., 2010).
20
The pressure and temperature profiles for all PROFFIT evaluations were taken from local meteorological measurements (ground pressure and tall-tower temperatures at 100 and 200 m altitudes) and the Merra-modeldata “IAU3D assimilated state on pres-sure(inst3 3d asm CP)” (http://disc.sci.gsfc.nasa.gov/daac-bin/DataHoldings.pl).
Be-sides other parameters, this provides the temperature and pressure on a 1.25×1.25
de-25
AMTD
5, 5691–5724, 2012XCO2-measurements
with a tabletop FTS
M. Gisi et al.
Title Page Abstract Introduction Conclusions References Tables Figures
◭ ◮
◭ ◮
Back Close Full Screen / Esc
Printer-friendly Version Interactive Discussion
Discussion
P
a
per
|
Dis
cussion
P
a
per
|
Discussion
P
a
per
|
Discussio
n
P
a
per
|
spatially inside the 3 dimensional model grid along the approximate path of the solar radiation.
No post-processing of the XCO2results has been performed within our analysis
se-quence apart from applying the TCCON calibration factor of 0.989 (Wunch et al., 2010)
to all XCO2results. In accordance with previous studies (Petri et al., 2012) we find that
5
reducing the spectral resolution significantly below the resolution applied by the
TC-CON network leads to a systematic increase of the retrieved O2 and CO2 columns.
The study by Petri et al. (2012) was performed using GFIT, we observe similar - but not identical - changes with our independent analysis setup. Therefore we assume that this
effect is partly introduced by deficiencies of the far-wing line shape model and partly
10
stems from approximations of the line-by-line calculation of absorption cross-sections.
Anyway, such a systematic offset can be removed by adjusting the XCO2 calibration
factor for a hypothetical EM27 network.
We processed and evaluated the data in 4 different ways which will later be denoted
as “EM27”, “HR High”, “HR Reduced” and “GFIT”:
15
– “EM27”: PROFFIT-evaluated averages 10 IFG of EM27 with 0.5 wavenumber
res-olution. The IFGs were apodized by a Norton-Beer-Medium function.
– “HR High”: PROFFIT-evaluated averages of 4 IFGs (2 forward, 2 backward) from TCCON-instrument with 0.014 wavenumber resolution.
– “HR Reduced”: The initial measurements are the same as in “HR High”, but the
20
interferograms were truncated to 0.5 wavenumbers resolution and apodized by a Norton-Beer-Medium function. The retrieval scheme then was the same as de-scribed in “EM27”.
– “GFIT”: GFIT-evaluated averages of 2 forward or 2 backward interferograms of the
TCCON-instrument with 0.014 wavenumbers resolution (forward and backward
25
AMTD
5, 5691–5724, 2012XCO2-measurements
with a tabletop FTS
M. Gisi et al.
Title Page Abstract Introduction Conclusions References Tables Figures
◭ ◮
◭ ◮
Back Close Full Screen / Esc
Printer-friendly Version Interactive Discussion
Discussion
P
a
per
|
Dis
cussion
P
a
per
|
Discussion
P
a
per
|
Discussio
n
P
a
per
figures containing the gas columns and the XCO2-values in the course of
mea-surement days. In any presented data, we applied the IFG preprocessing routines
from GGG, for XCO2-values we also applied the standard postprocessing,
includ-ing airmass-dependent corrections.
4.3 Spectral windows
5
In the official TCCON analysis, the CO2 column is evaluated in the spectral ranges
6180–6260 and 6297–6382 cm−1, for the O2 analysis the range 7765–8005 cm−
1
is applied. For the PROFFIT analysis of the 125HR and EM27 spectra, we adopted the
same O2window, but we merged the CO2windows into one broader region extending
from 6173 to 6390 cm−1.
10
An example of the spectral windows including the measurement, the fit and the residuum are presented in Fig. 5. For both windows the quality is very good and the
standard deviation of the residuum is 1σ=0.2 % for CO2and 0.17 % for O2. However,
several peaks appear in the EM27 residuals (in the graph of the O2marked with arrows)
which do not appear in the resolution-reduced 125HR spectra.
15
These residuals originate from the fact that the intensity and shape of the solar lines vary as function of the projected solar disc radius. Because the FOV of the EM27 in-strument of 2.95 mrad (semi-FOV) is by a factor of about 3 greater compared to the one of the IFS125HR, which has a semi-FOV of 0.957 mrad, the EM27 observes a sig-nificantly larger fraction of the solar disc. An image of the solar disc superimposed to
20
AMTD
5, 5691–5724, 2012XCO2-measurements
with a tabletop FTS
M. Gisi et al.
Title Page Abstract Introduction Conclusions References Tables Figures
◭ ◮
◭ ◮
Back Close Full Screen / Esc
Printer-friendly Version Interactive Discussion
Discussion
P
a
per
|
Dis
cussion
P
a
per
|
Discussion
P
a
per
|
Discussio
n
P
a
per
|
5 Results
In this section, we evaluate the results for the EM27 in comparison to the 125HR
ref-erence. In Sects. 5.1 and 5.2 we provide an exemplary overview of the CO2 and O2
columns and the resulting intraday variability of XCO2 during several sample days. In
Sect. 5.3, a statistical analysis for the whole set of measurements is provided.
5
5.1 CO2and O2-columns
Figures 6 and 7 collect the CO2and O2columns for the measurement days 21
Febru-ary 2012 and 28 March 2012. In each graph, the ambient air temperature on the ter-race is given for the beginning and the end of the EM27-measurements. In addition, the starting, the minimal and the last value for the solar zenith angle (SZA) of the
mea-10
surements are displayed. The values in the areas with a gray background are not taken into account in the statistical analysis of Sect. 5.3. The shaded areas filter out SZAs beyond 70 degrees and measurements taken within the first 30 min after the start of measurements. We added the latter restriction as the EM27 requires some startup time
before it operates in a stable manner. After moving it from the 20◦C lab-environment
15
to the outside temperature on the terrace, which was sometimes as low as−12◦C, the
HeNe reference laser tube temporarily undergoes fast temperature changes, thereby shifting the reference wavelength during a few scans.
Columns for O2 recorded on 2 days are presented in Fig. 6. The data processing
procedure for the 4 types of datapoints were described in Sect. 4. One observes a
dif-20
ference between the “HR High” and the “HR Reduced” columns, resulting from the
re-duction of the resolution. The “HR Reduced” columns of O2are 0.4 % higher than the
reference values. This systematic resolution-depending difference was also observed
before by Petri et al. (2012). Possible reasons for this discrepancy are discussed in Sect. 4.2. A closer inspection reveals that this is not a constant correction factor in
25
case of the CO2 column, but also a weaker airmass-dependent contribution can be
AMTD
5, 5691–5724, 2012XCO2-measurements
with a tabletop FTS
M. Gisi et al.
Title Page Abstract Introduction Conclusions References Tables Figures
◭ ◮
◭ ◮
Back Close Full Screen / Esc
Printer-friendly Version Interactive Discussion
Discussion
P
a
per
|
Dis
cussion
P
a
per
|
Discussion
P
a
per
|
Discussio
n
P
a
per
values. This finding is not surprising for an effect probably induced by line-shape
is-sues. Nevertheless, this is not an obstacle for a hypothetical EM27 network, but a mat-ter of adjusting the analysis procedures, as the TCCON network also performs some air-mass dependent tuning in the course of the analysis of the 125HR spectra.
One would expect the EM27 O2and CO2 columns to reproduce the “HR Reduced”
5
values. However, we observe values approximately 0.6 % lower. We are not sure about
the origin of this offset, as the retrieval scheme (a-prioris, pressure and temperature
profiles, used resolution,...) is exactly the same. As outlined in Sect. 3.1 the absolute
ILS calibration of the EM27 might be slightly off, and the observed discrepancies are
within the resulting error bar (moreover, the offset is nearly the same for CO2 and O2
10
columns as one would expect in this scenario). Therefore, we assume that the
uncer-tainty of the ILS calibration is the leading effect. In addition, the deficiencies of the solar
line model could trigger parts of the systematic offsets. The variation in the EM27-O2
-columns during the evaluated days is very low which proves the high stability of the EM27 spectrometer as well as the high performance of the CamTracker system. When
15
comparing the “GFIT” and “HR High” results generated with PROFFIT, one observes an air-mass dependent increase of the GFIT values. For this reason the TCCON
ap-plies an posteriori airmass correction to the XCO2-values. For the PROFFIT evaluated
O2columns this effect is not evident, although the same line lists are used.
When compared to the intraday variability of the O2 columns, the higher variability
20
of the CO2columns is obvious. These enhancements are indicated by both the EM27
and the 125HR and are discussed in Sect. 5.3.
5.2 XCO2
The XCO2values for 5 sample days are presented in Fig. 8. As described in Sect. 4.2,
all datasets are calculated by Eq. (1) and include the WMO calibration factor of 0.989.
25
AMTD
5, 5691–5724, 2012XCO2-measurements
with a tabletop FTS
M. Gisi et al.
Title Page Abstract Introduction Conclusions References Tables Figures
◭ ◮
◭ ◮
Back Close Full Screen / Esc
Printer-friendly Version Interactive Discussion
Discussion
P
a
per
|
Dis
cussion
P
a
per
|
Discussion
P
a
per
|
Discussio
n
P
a
per
|
Obviously the systematic differences between the 4 datasets cancel out very well
so that they agree within about 1 ppm. The intra-day variability differs strongly
be-tween the measurement days. During some days the values vary very smoothly (e.g. 22 March 2012), others, such as the 28 March 2012, show several short-term in-creases. As these are observed both by the EM27 and the 125HR and the
simulta-5
neously recorded CamTracker images look unsuspiciously, we are confident that these
enhancements reflect real increases in the atmospheric XCO2. The measurement site
is located in an urban area; it is surrounded by several coal- and gas power plants. The closest ones are in the town Karlsruhe (13 km to the South-West with 915 MW), in Mannheim (39 km to the North with 1675 MW) and in Heilbronn (57 km to the East
10
with 950 WM). At the 28 March the wind came from the North, so we suspect the CO2
increases to originate from the power plant in the city of Mannheim.
A slight air-mass dependent difference is visible between the 4 datasets. It is nearly
negligible between the 2 low-resolution datasets and biggest between the “EM27” and
the “HR High”. However, it is worth to mention that these effects are below 0.25 % and
15
could essentially be shifted into an airmass-dependent post-correction.
5.3 Comparisons
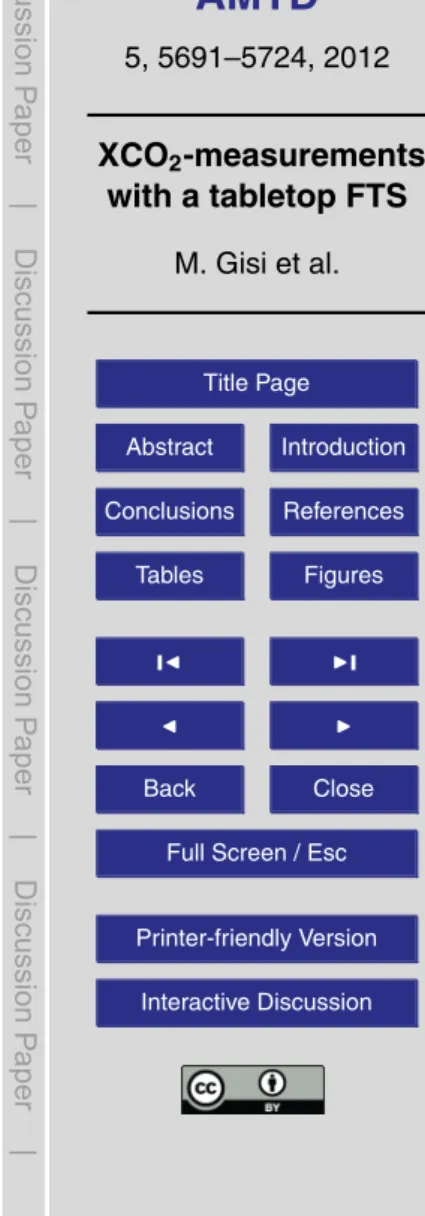
To compare the XCO2-results over the whole time series of 26 measurement days
between February and May 2012, we calculated the daily means which are shown in Fig. 9.
20
As the error bars for the daily mean values mainly result from the intra-day
vari-abilities, a more significant comparison can be done by calculating the differences
between the “EM27” values and the three other data-types “GFIT”, “HR High” and “HR Reduced” (see Sect. 4.2). To reduce temporal variabilities, only data were taken into account, which were recorded at nearly the same time. In addition, as described
25
above, only measurements were taken into account which had a corresponding SZA
lower than 70◦and were taken at least 30 min after the set-up of the instrument on the
AMTD
5, 5691–5724, 2012XCO2-measurements
with a tabletop FTS
M. Gisi et al.
Title Page Abstract Introduction Conclusions References Tables Figures
◭ ◮
◭ ◮
Back Close Full Screen / Esc
Printer-friendly Version Interactive Discussion
Discussion
P
a
per
|
Dis
cussion
P
a
per
|
Discussion
P
a
per
|
Discussio
n
P
a
per
forward and 2 backward IFGs), the data of 3 EM27 spectra (total duration 102 s; each spectrum containing 10 IFG) were averaged and used.
Following this procedure, the XCO2and the total O2-column values are investigated
in the following. The O2-column values offer the advantage that there is no significant
variability on short time scales which could superimpose the instrumental effects under
5
investigation.
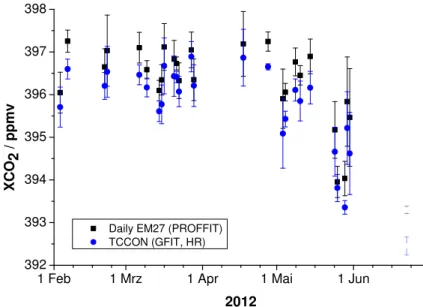
In Fig. 10 these O2-column differences are displayed, where the data is grouped in
single days. This grouping is made only for graphical reasons and not for the following statistical values. For all simultaneously measured results in the whole time series, the
differences in the O2-columns have the following values:
10
EM27-GFIT: (7±5)×1025molec m−2
b
=(0.15±0.11) %
EM27-HR High: (−7±4)×1025molec m−2
b
=(−0.15±0.09) %
EM27-HR Reduced: (−27±4)×1025molec m−2
b
=(−0.59±0.09) %
The mean differences show significant offsets, as already discussed in Sect. 5.1.
However, they compensate for the largest part when calculating the XCO2. The
scat-ter around the mean systematic offset, the precision, is impressively good by values
15
AMTD
5, 5691–5724, 2012XCO2-measurements
with a tabletop FTS
M. Gisi et al.
Title Page Abstract Introduction Conclusions References Tables Figures
◭ ◮
◭ ◮
Back Close Full Screen / Esc
Printer-friendly Version Interactive Discussion
Discussion
P
a
per
|
Dis
cussion
P
a
per
|
Discussion
P
a
per
|
Discussio
n
P
a
per
|
When moving on to the XCO2, one obtains results as shown in Fig. 11 and the
following statistical values:
EM27-GFIT: (0.46±0.32) ppm
b
=(0.12±0.08) %
EM27-HR High: (0.81±0.36) ppm
b
=(0.20±0.09) %
EM27-HR Reduced: (0.26±0.29) ppm
b
=(0.07±0.07) %
These values show a very good accuracy of better than 0.2 % relative to a
high-5
resolution instrument. We believe, that these could be absorbed by a global scaling factor for a hypothetical EM27 network (and an airmass-dependent correction term for reaching even higher accuracies), similar to the WMO-factor which is applied to the
TCCON XCO2 values, presuming the low resolution instruments are all identical in
construction. The scattering between the EM27 and the high-resolution data is lower
10
than 0.09 %, well inside the range of the stated precision of the TCCON network which is 0.25 % (Wunch et al., 2011).
5.4 XCO2-signal to noise
To approximately compare the Signal-to-Noise of the XCO2-values, we laid a smoothed
curve into the EM27 and GFIT(TCCON) values of a few days (see Fig. 12 for
15
22 March 2012) and calculated the scattering of the data. The GFIT values show a stan-dard deviation of 0.085 ppm for a recording time of 212 s (2 forward and 2 backward scans). The EM27-values which had a recording time of 34 s per datapoint (which
in-cludes 10 scans) have a 1σstandard deviation of 0.17 ppm. For an TCCON-equivalent
acquisition time of 212 s this value lies at approximately 0.17 ppm·
q
34 s/212 s=
20
AMTD
5, 5691–5724, 2012XCO2-measurements
with a tabletop FTS
M. Gisi et al.
Title Page Abstract Introduction Conclusions References Tables Figures
◭ ◮
◭ ◮
Back Close Full Screen / Esc
Printer-friendly Version Interactive Discussion
Discussion
P
a
per
|
Dis
cussion
P
a
per
|
Discussion
P
a
per
|
Discussio
n
P
a
per
EM27. In total the intensity on the EM27-detector is a factor of about 150 smaller than on the HR-detector. However, the photon-noise part of the Signal-to-Noise (SNR) ratio of a FTIR-spectrum also is dependent on the resolution, or more precisely the number
N of datapoints in the interferogram. This factor of
q
2/N leads to a comparable SNR
of the low-resolution measurements.
5
6 Conclusions
We presented the capabilities of retrieving atmospheric XCO2 values with a
NIR-modified version of the commercial EM27 FTIR spectrometer from Bruker, a low-resolution table-top FTS. We developed a small solar tracker with active control of the line-of-sight, which is attached to the spectrometer. The whole set-up is very portable.
10
To confirm the resulting data quality, we compared the EM27 results with simul-taneously recorded measurements of the high-resolution TCCON FTIR spectrometer located in the vicinity of the test setup.
This intercomparison demonstrates for the first time the applicability of a
well-characterized low-resolution FTS spectrometer for XCO2measurements. The precision
15
of the EM27-values found in this investigation is well inside the current network-wide
TCCON accuracy of 0.25 %. The differences of temporally coinciding measurements
for the retrieved XCO2were (0.12±0.08) % and (0.20±0.09) % when compared to
high-resolution TCCON spectra, analyzed with the official GFIT and PROFFIT algorithm,
respectively. The optical stability and the low influence of varying outside temperatures
20
(−10◦C to more than 40◦C) are promising features of the EM27 spectrometer, so our
study proves its high applicability especially for operation at remote sites and measure-ment campaigns.
Therefore, the EM27, with the modifications presented in this paper, seems a very promising candidate of an instrument supporting the core TCCON-stations for
increas-25
AMTD
5, 5691–5724, 2012XCO2-measurements
with a tabletop FTS
M. Gisi et al.
Title Page Abstract Introduction Conclusions References Tables Figures
◭ ◮
◭ ◮
Back Close Full Screen / Esc
Printer-friendly Version Interactive Discussion
Discussion
P
a
per
|
Dis
cussion
P
a
per
|
Discussion
P
a
per
|
Discussio
n
P
a
per
|
of EM27 spectrometers at places inaccessible with a TCCON spectrometer. Moreover, for the study of local emission sources as megacities, large power-plants, etc., several mobile EM27 units could be distributed.
Acknowledgements. “M. Gisi has been partially funded through grant BU2599/1-1 (RemoteC, http://www.imk-asf.kit.edu/english/RemoteC.php) within the Emmy-Noether programme of
5
Deutsche Forschungsgemeinschaft (DFG).”
We acknowledge Martin Kohler from the “Institute for Meteorology and Climate Research – Troposphere Research (IMK-TRO)” at the KIT for providing tall-tower meteorological data. We acknowledge the Global Modeling and Assimilation Office (GMAO) and the GES DISC for the dissemination of MERRA meteorological datasets.
10
The service charges for this open access publication have been covered by a Research Centre of the Helmholtz Association.
References 15
Chen, J., Gottlieb, E., and Wofsy, S.: Compact FTIR Spectrometer for total column mea-surement in urban environments, in: IRWG/TCCON Meeting, Wengen, Switzerland, 11– 15 June 2012. 5694
Geibel, M. C., Gerbig, C., and Feist, D. G.: A new fully automated FTIR system for total column measurements of greenhouse gases, Atmos. Meas. Tech., 3, 1363–1375,
doi:10.5194/amt-20
3-1363-2010, 2010. 5693
Gisi, M., Hase, F., Dohe, S., and Blumenstock, T.: Camtracker: a new camera controlled high precision solar tracker system for FTIR-spectrometers, Atmos. Meas. Tech., 4, 47–54, doi:10.5194/amt-4-47-2011, 2011. 5695, 5697
Hase, F.: Improved instrumental line shape monitoring for the ground-based, high-resolution
25
AMTD
5, 5691–5724, 2012XCO2-measurements
with a tabletop FTS
M. Gisi et al.
Title Page Abstract Introduction Conclusions References Tables Figures
◭ ◮
◭ ◮
Back Close Full Screen / Esc
Printer-friendly Version Interactive Discussion
Discussion
P
a
per
|
Dis
cussion
P
a
per
|
Discussion
P
a
per
|
Discussio
n
P
a
per
Hase, F., Blumenstock, T., and Paton-Walsh, C.: Analysis of the instrumental line shape of high-resolution fourier transform IR spectrometers with gas cell measurements and new retrieval software, Appl. Optics, 38, 3417–3422, doi:10.1364/AO.38.003417, 1999. 5698
Jones, N., Griffith, D., Velazco, V., Macatangay, R., O’Brien, D., Clark, A., and Rayner, P.: SolarFTS-lite down under, in: IRWG/TCCON Meeting, Wengen, Switzerland, 11–
5
15 June 2012. 5694
Keppel-Aleks, G., Toon, G. C., Wennberg, P. O., and Deutscher, N. M.: Reducing the impact of source brightness fluctuations on spectra obtained by Fourier-transform spectrometry, Appl. Optics, 46, 4774–4779, doi:10.1364/AO.46.004774, 2007. 5697
Kobayashi, N., Inoue, G., Kawasaki, M., Yoshioka, H., Minomura, M., Murata, I., Nagahama, T.,
10
Matsumi, Y., Tanaka, T., Morino, I., and Ibuki, T.: Remotely operable compact instruments for measuring atmospheric CO2 and CH4column densities at surface monitoring sites, Atmos. Meas. Tech., 3, 1103–1112, doi:10.5194/amt-3-1103-2010, 2010. 5694
Lamouroux, J., Tran, H., Laraia, A. L., Gamache, R. R., Rothman, L. S., Gordon, I. E., and Hartmann, J. M.: Updated database plus software for line-mixing in CO2 infrared spectra
15
and their test using laboratory spectra in the 1.5–2.3 µm region, J. Quant. Spectrosc. Ra., 111, 2321–2331, doi:10.1016/j.jqsrt.2010.03.006, 2010. 5701
Messerschmidt, J., Macatangay, R., Notholt, J., Petri, C., Warneke, T., and Weinzierl, C.: Side by side measurements of CO2by ground-based Fourier transform spectrometry (FTS), Tellus B, 62, 749–758, doi:10.1111/j.1600-0889.2010.00491.x, 2010. 5699
20
Messerschmidt, J., Geibel, M. C., Blumenstock, T., Chen, H., Deutscher, N. M., Engel, A., Feist, D. G., Gerbig, C., Gisi, M., Hase, F., Katrynski, K., Kolle, O., Lavriˇc, J. V., Notholt, J., Palm, M., Ramonet, M., Rettinger, M., Schmidt, M., Sussmann, R., Toon, G. C., Truong, F., Warneke, T., Wennberg, P. O., Wunch, D., and Xueref-Remy, I.: Calibration of TCCON column-averaged CO2: the first aircraft campaign over European TCCON sites, Atmos.
25
Chem. Phys., 11, 10765–10777, doi:10.5194/acp-11-10765-2011, 2011. 5693
Notholt, J., Toon, G., Rinsland, C., Pougatchev, N., Jones, N., Connor, B., Weller, R., Gautrois, M., and Schrems, O.: Latitudinal variations of trace gas concentrations in the free troposphere measured by solar absorption spectroscopy during a ship cruise, J. Geophys. Res.-Atmos., 105, 1337–1349, doi:10.1029/1999JD900940, 2000. 5694
30
AMTD
5, 5691–5724, 2012XCO2-measurements
with a tabletop FTS
M. Gisi et al.
Title Page Abstract Introduction Conclusions References Tables Figures
◭ ◮
◭ ◮
Back Close Full Screen / Esc
Printer-friendly Version Interactive Discussion
Discussion
P
a
per
|
Dis
cussion
P
a
per
|
Discussion
P
a
per
|
Discussio
n
P
a
per
|
Petri, C., Warneke, T., Jones, N., Ridder, T., Messerschmidt, J., Weinzierl, T., Geibel, M., and Notholt, J.: Remote sensing of CO2and CH4using solar absorption spectrometry with a low resolution spectrometer, Atmos. Meas. Tech., 5, 1627–1635, doi:10.5194/amt-5-1627-2012, 2012. 5694, 5702, 5704
Schneider, M., Hase, F., Blumenstock, T., Redondas, A., and Cuevas, E.: Quality assessment
5
of O3profiles measured by a state-of-the-art ground-based FTIR observing system, Atmos. Chem. Phys., 8, 5579–5588, doi:10.5194/acp-8-5579-2008, 2008. 5701
Schneider, M., Romero, P. M., Hase, F., Blumenstock, T., Cuevas, E., and Ramos, R.: Continu-ous quality assessment of atmospheric water vapour measurement techniques: FTIR, Cimel, MFRSR, GPS, and Vaisala RS92, Atmos. Meas. Tech., 3, 323–338,
doi:10.5194/amt-3-323-10
2010, 2010. 5701
Sep ´ulveda, E., Schneider, M., Hase, F., Garc´ıa, O. E., Gomez-Pelaez, A., Dohe, S., Blumen-stock, T., and Guerra, J. C.: Long-term validation of tropospheric column-averaged CH4mole fractions obtained by mid-infrared ground-based FTIR spectrometry, Atmos. Meas. Tech., 5, 1425–1441, doi:10.5194/amt-5-1425-2012, 2012. 5701
15
Wunch, D., Toon, G. C., Wennberg, P. O., Wofsy, S. C., Stephens, B. B., Fischer, M. L., Uchino, O., Abshire, J. B., Bernath, P., Biraud, S. C., Blavier, J.-F. L., Boone, C., Bow-man, K. P., Browell, E. V., Campos, T., Connor, B. J., Daube, B. C., Deutscher, N. M., Diao, M., Elkins, J. W., Gerbig, C., Gottlieb, E., Griffith, D. W. T., Hurst, D. F., Jim ´enez, R., Keppel-Aleks, G., Kort, E. A., Macatangay, R., Machida, T., Matsueda, H., Moore, F., Morino, I.,
20
Park, S., Robinson, J., Roehl, C. M., Sawa, Y., Sherlock, V., Sweeney, C., Tanaka, T., and Zondlo, M. A.: Calibration of the Total Carbon Column Observing Network using aircraft pro-file data, Atmos. Meas. Tech., 3, 1351–1362, doi:10.5194/amt-3-1351-2010, 2010. 5693, 5702
Wunch, D., Toon, G. C., Blavier, J.-F. L., Washenfelder, R. A., Notholt, J., Connor, B. J.,
Grif-25
AMTD
5, 5691–5724, 2012XCO2-measurements
with a tabletop FTS
M. Gisi et al.
Title Page Abstract Introduction Conclusions References Tables Figures
◭ ◮
◭ ◮
Back Close Full Screen / Esc
Printer-friendly Version Interactive Discussion
Discussion
P
a
per
|
Dis
cussion
P
a
per
|
Discussion
P
a
per
|
Discussio
n
P
a
per
Fig. 1.The EM27-Spectrometer with the attached tracker. Right panel: transportation to the
AMTD
5, 5691–5724, 2012XCO2-measurements
with a tabletop FTS
M. Gisi et al.
Title Page Abstract Introduction Conclusions References Tables Figures
◭ ◮
◭ ◮
Back Close Full Screen / Esc
Printer-friendly Version Interactive Discussion
Discussion
P
a
per
|
Dis
cussion
P
a
per
|
Discussion
P
a
per
|
Discussio
n
P
a
per
|
SUN
Electronics Switch controller
Motor-TCP/IP
TCP/IP
PC Win (Linux)
>15m
TCP/IP
USB
InGaAs
Diffusor
Aperture 0.6mm
Camera for CamTracker
Long-pass filter
Aperture ~3mm
Tracker
EM27
AMTD
5, 5691–5724, 2012XCO2-measurements
with a tabletop FTS
M. Gisi et al.
Title Page Abstract Introduction Conclusions References Tables Figures
◭ ◮
◭ ◮
Back Close Full Screen / Esc
Printer-friendly Version Interactive Discussion
Discussion
P
a
per
|
Dis
cussion
P
a
per
|
Discussion
P
a
per
|
Discussio
n
P
a
per
Fig. 3.Images of the solar image on the field stop of the EM27-spectrometer (left panel) and
AMTD
5, 5691–5724, 2012XCO2-measurements
with a tabletop FTS
M. Gisi et al.
Title Page Abstract Introduction Conclusions References Tables Figures
◭ ◮
◭ ◮
Back Close Full Screen / Esc
Printer-friendly Version Interactive Discussion
Discussion
P
a
per
|
Dis
cussion
P
a
per
|
Discussion
P
a
per
|
Discussio
n
P
a
per
|
6310 6320 6330 6340 6350 6360 6370 6380 0.08
0.10 0.12 0.14
In
te
n
s
it
y
[
a
.u
.]
Wavenumbers [1/cm]
0.5 cm-1 resolution 1.0 cm-1 resolution
Fig. 4.A section of the CO2retrieval window with 0.5 and 1 wavenumbers resolution. As for the
AMTD
5, 5691–5724, 2012XCO2-measurements
with a tabletop FTS
M. Gisi et al.
Title Page Abstract Introduction Conclusions References Tables Figures
◭ ◮
◭ ◮
Back Close Full Screen / Esc
Printer-friendly Version Interactive Discussion
Discussion
P
a
per
|
Dis
cussion
P
a
per
|
Discussion
P
a
per
|
Discussio
n
P
a
per
6200 6250 6300 6350
0.0 0.2 0.4 0.6 0.8
7800 7850 7900 7950 8000
0.0 0.2 0.4 0.6 0.8 1.0
T
ra
n
s
m
is
s
io
n
Measurement EM27 Fit
Residuum * 20
CO
2O
2T
ra
n
s
m
is
s
io
n
Wavenumber [cm-1
]
Meas. EM27 Fit
Residuum * 20
{
Fig. 5.Spectral windows used by PROFFIT to derive the CO2 and O2 columns. In the lower
AMTD
5, 5691–5724, 2012XCO2-measurements
with a tabletop FTS
M. Gisi et al.
Title Page Abstract Introduction Conclusions References Tables Figures
◭ ◮
◭ ◮
Back Close Full Screen / Esc
Printer-friendly Version Interactive Discussion
Discussion
P
a
per
|
Dis
cussion
P
a
per
|
Discussion
P
a
per
|
Discussio
n
P
a
per
|
10:00 12:00 14:00 16:00
4.57 4.58 4.59 4.60 4.61 4.62 4.63 4.64 4.65 4.66 4.67
08:00 10:00 12:00 14:00 16:00
4.56 4.57 4.58 4.59 4.60 4.61 4.62 4.63 4.64 4.65 4.66
UTC at 2012/02/21
EM27 O2 Column HR_Reduced O2 column HR_High O2 column GFIT O2 Column
O2
-C
o
lu
m
n
m
o
le
c
.
/
m
2 /
1
0
2
8
Tstart:-2°C, Tend: 5°C
SZAstart, min, end: 14°, 60°, 7°
Tstart:9°C, Tend: 19°C
SZAstart, min, end:71°, 46°, 79°
UTC at 2012/03/28
Fig. 6.O2-columns for the four datasets for two sample days. The observed intraday variability
AMTD
5, 5691–5724, 2012XCO2-measurements
with a tabletop FTS
M. Gisi et al.
Title Page Abstract Introduction Conclusions References Tables Figures
◭ ◮
◭ ◮
Back Close Full Screen / Esc
Printer-friendly Version Interactive Discussion
Discussion
P
a
per
|
Dis
cussion
P
a
per
|
Discussion
P
a
per
|
Discussio
n
P
a
per
10:00 12:00 14:00 16:00
8.55 8.60 8.65 8.70 8.75
08:00 10:00 12:00 14:00 16:00
8.50 8.55 8.60 8.65 8.70
Tstart:-2°C, Tend: 5°C
SZAstart, min, end: 14°, 60°, 7°
C
O2
-C
o
lu
m
n
m
o
le
c
.
/
m
2 /
1
0
2
5
UTC at 2012/02/21
Tstart:9°C, Tend: 19°C
SZAstart, min, end:71°, 46°, 79°
EM27 CO2 Column HR_Reduced CO2 column HR_High CO2 column GFIT CO2 Column
UTC at 2012/03/28
Fig. 7.CO2-columns for 2 days. The systematic offsets of the 4 datasets is very similar to those
AMTD
5, 5691–5724, 2012XCO2-measurements
with a tabletop FTS
M. Gisi et al.
Title Page Abstract Introduction Conclusions References Tables Figures ◭ ◮ ◭ ◮ Back Close Full Screen / Esc
Printer-friendly Version Interactive Discussion Discussion P a per | Dis cussion P a per | Discussion P a per | Discussio n P a per |
10:00 12:00 14:00 16:00
395 396 397 398 399
10:00 12:00 14:00 16:00
395 396 397 398 399
08:00 10:00 12:00 14:00 16:00
395 396 397 398
08:00 10:00 12:00 14:00 16:00
395 396 397 398
06:00 08:00 10:00 12:00 14:00
394 395 396 397 398 T start:-2°C
Tend: 5°C
SZAmin: 60°
X C O2 / p p m v
UTC at 2012/02/21
Tstart: 3°C Tend: 12°C, SZAmin: 49°
X C O2 / p p m v
UTC at 2012/03/20
Tstart: 7°C Tend: 19°C SZAmin: 48°
EM27 XCO2
HR_Reduced XCO2
HR_High XCO2
GFIT XCO2
X C O2 / p p m v
UTC at 2012/03/22
Tstart:9°C Tend: 19°C
SZAmin: 46°
X C O2 / p p m v
UTC at 2012/03/28
Tstart: 14°C
Tend: 22°C, SZAmin: 33°
X C O2 / p p m v
UTC at 2012/05/04
AMTD
5, 5691–5724, 2012XCO2-measurements
with a tabletop FTS
M. Gisi et al.
Title Page Abstract Introduction Conclusions References Tables Figures
◭ ◮
◭ ◮
Back Close Full Screen / Esc
Printer-friendly Version Interactive Discussion
Discussion
P
a
per
|
Dis
cussion
P
a
per
|
Discussion
P
a
per
|
Discussio
n
P
a
per
1 Feb 1 Mrz 1 Apr 1 Mai 1 Jun
392 393 394 395 396 397 398
Daily EM27 (PROFFIT) TCCON (GFIT, HR)
X
C
O2
/
p
p
m
v
2012
Fig. 9.Daily means of XCO2 values of the EM27 and the TCCON instrument. The last day is
AMTD
5, 5691–5724, 2012XCO2-measurements
with a tabletop FTS
M. Gisi et al.
Title Page Abstract Introduction Conclusions References Tables Figures
◭ ◮
◭ ◮
Back Close Full Screen / Esc
Printer-friendly Version Interactive Discussion
Discussion
P
a
per
|
Dis
cussion
P
a
per
|
Discussion
P
a
per
|
Discussio
n
P
a
per
|
1 Feb 1 Apr 1 Jun
-4.0 -3.5 -3.0 -2.5 -2.0 -1.5 -1.0 -0.5 0.0 0.5 1.0 1.5 2.0
EM27 - HR_Reduced(Proffit)
EM27 - TCCON(GFIT)
D
a
ily
d
if
fe
re
n
c
e
o
f
c
o
rr
e
s
p
.
O2
-c
o
lu
m
n
s
/
m
o
le
c
.
/
m
2 /
1
0
2
6
0
.2
%
1 Feb 1 Apr 1 Jun
2012
EM27 - HR_High(Proffit)
1 Feb 1 Apr 1 Jun
Fig. 10.Differences between the EM27-O2 total columns and the 3 other datasets, grouped
AMTD
5, 5691–5724, 2012XCO2-measurements
with a tabletop FTS
M. Gisi et al.
Title Page Abstract Introduction Conclusions References Tables Figures
◭ ◮
◭ ◮
Back Close Full Screen / Esc
Printer-friendly Version Interactive Discussion
Discussion
P
a
per
|
Dis
cussion
P
a
per
|
Discussion
P
a
per
|
Discussio
n
P
a
per
27 Jan 27 Mrz 27 Mai
-0.2 0.0 0.2 0.4 0.6 0.8 1.0 1.2 1.4
1.6 EM27
- HR_Reduced(Proffit)
EM27 - TCCON(GFIT)
D
a
ily
d
if
fe
re
n
c
e
s
o
f
c
o
rr
e
s
p
.
X
C
O2
m
e
a
s
.
/
p
p
m
v
0
.1
%
27 Jan 27 Mrz 27 Mai
2012
EM27 - HR_High(Proffit)
27 Jan 27 Mrz 27 Mai
Fig. 11.XCO2-values with the same data processing as for the O2-columns in Fig. 10 for the
AMTD
5, 5691–5724, 2012XCO2-measurements
with a tabletop FTS
M. Gisi et al.
Title Page Abstract Introduction Conclusions References Tables Figures
◭ ◮
◭ ◮
Back Close Full Screen / Esc
Printer-friendly Version Interactive Discussion
Discussion
P
a
per
|
Dis
cussion
P
a
per
|
Discussion
P
a
per
|
Discussio
n
P
a
per
|
395.5 396.0 396.5 397.0 397.5 398.0
08:00 10:00 12:00 14:00 395.0
395.5 396.0 396.5 397.0 397.5
EM27 40 point average
X
C
O 2
/
p
p
m
v
X
C
O2
/
p
p
m
v
22.3.2012 GFITXCO2 5 point average
Fig. 12.Sample day to derive the XCO2-noise of the EM27 and GFIT(TCCON) values. When