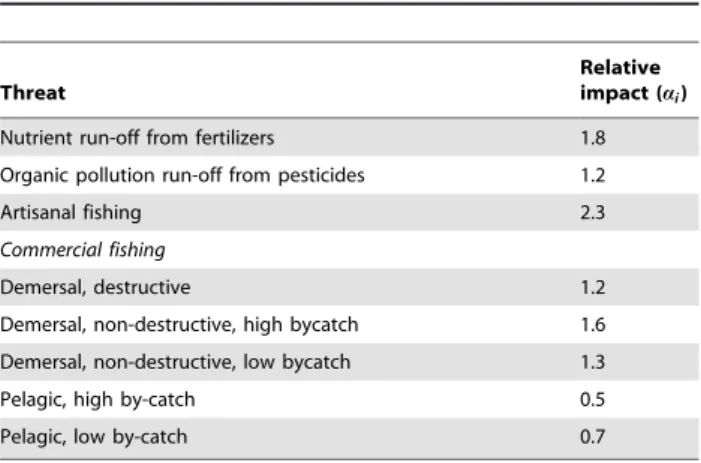
Prioritizing land and sea conservation investments to protect coral reefs.
Texto
Imagem


Documentos relacionados
Em se tratando de líquidos inflamáveis, não se pode determinar a periculosidade de forma simples. Devem ser verificados fatores como tempo de exposição, quantidade e distância
Com efeito, a solução Leixões tinha uma nova decisão governamental, datada de 19.2.1864, que nomeava Manuel Afonso de Espregueira para estudar os melhoramentos da barra e a
Este trabalho aborda a gestão educacional no meio rural e suas implicações para o desempenho estudantil em uma escola ribeirinha do município de Breves, tendo por base
Após inúmeras mudanças e transformações ao longo dos anos da história do ensino supe- rior e da extensão universitária no Brasil, o conceito de extensão hoje é considerado como:..
Agir como fornecedora de subsídios aos agentes da assistência, auxiliando os gestores nas tomadas de decisões quanto à implementação mais eficaz das
§ 1 o – A extinção da validade do Registro Provisório não isenta o profissional do pagamento da anuidade do exercício, devida ao CRB nos mesmos critérios vigentes
The path is characterized through a Picewise Deterministic Markov Processes (PDMP, see Davis [3]) where, for simplicity, the mobility of each node along the path is given by the
Neste sentido pode entender-se que esta visibilidade da experiência técnica torna a peça uma plataforma comunicacional, um denominador comum, logo um elemento
