ISSN: 1546-9239
© 2014 F. Alshammari, This open access article is distributed under a Creative Commons Attribution (CC-BY) 3.0 license
doi:10.3844/ajassp.2014.1234.1240 Published Online 11 (8) 2014 (http://www.thescipub.com/ajas.toc)
PATIENT SATISFACTION IN PRIMARY HEALTH CARE
CENTERS IN HAIL CITY, SAUDI ARABIA
Fares Alshammari
Department of Health Administration, University of Hail, Hail, Saudi Arabia
Received 2014-04-21; Revised 2014-04-24; Accepted 2014-05-02
ABSTRACT
The objectives of this study were to explore the factors contributing to patient Satisfaction in Primary Healthcare Centers (PHCCs) in Hail city, Saudi Arabia. A cross-sectional quantitative survey was conducted using an instrument with valid and reliable properties. Six dimensions of patient satisfaction were identified by factor analysis, with adequate to high levels of internal consistency reliability (Cronbach’s alpha = 0.645 to 0.857). The questionnaire was completed by 453 patients attending six PHCCs in June 2013 with an 83.8% response rate. The overall level of patient satisfaction on a scale from 1 to 5 was indicated by a mean score of 3.60 (95% CI = 3.53, 3.67) comparable with a previous survey of patient satisfaction in Hail city, conducted in 1999. The respondents reported their highest level of satisfaction for the quality of the services provided by the doctors and staff. The lowest level of satisfaction was for access to medical care and the availability of doctors. Different sectors of the population city were not equally satisfied with all aspects of the healthcare services they received. Older patients, especially those in the middle income category, were more satisfied with relationships with doctors and staff. The ease of seeing doctors was perceived to be the highest by the older patients, especially those in the lowest income category. Female patients with limited education perceived they received the highest levels of treatment, diagnosis and outcomes. Patients in the lower income categories perceived they had better access to medical care than patients in the highest income category. These relationships may help healthcare providers to meet the different needs of patients based on their gender, age and socio-economic status.
Keywords: Factor Analysis, Healthcare Services, Patient Satisfaction, Primary Healthcare
1. INTRODUCTION
Patient satisfaction is defined as judgments made by the recipients of healthcare as to whether or not their expectations have been met (Palmer and Donabedian, 1991). Surveys of patient satisfaction have been used to achieve three major objectives in the healthcare delivery sector. Firstly, patient satisfaction is interpreted as an indicator of healthcare quality (Aharony and Strasser, 1993; Grogan et al., 2000; Salisbury et al., 2005). Secondly, knowledge of patient satisfaction helps healthcare professionals and organizations to understand the patients’ point of view and to use this information to improve accountability and enhance their services (Brown and Bell, 2005). Thirdly, patient satisfaction may influence patients’
decisions as to where they may seek treatment and fulfill their needs for ongoing care (Ware et al., 1977; Patrick et al., 1983; Al-Doghaither and Saeed, 2000).
1.1. Patients’ Satisfaction Factors
patient, which have a positive influence on patient satisfaction (Mercer et al., 2008; Lin et al., 2010).
In the last twenty years, researchers in Saudi Arabia have reported the results of surveys of patient satisfaction mostly in Riyadh, the capital city (Mansour and Al-Osimy, 1993; Al-Faris et al., 1996; Harrison, 1996;
Makhdoom et al., 1997; Saeed et al., 2001; Al-Sakkak et al., 2008). One study measured patient
satisfaction in Hail city (Abdalla et al., 2005). This survey, conducted in 1999, indicated that the highest level of satisfaction was for the quality of the physicians. The lowest level of satisfaction was for the availability of services, such as laboratory investigations, tests and drugs, receptionist services and dental emergency. On a scale from 1 to 5 the overall consumers’ satisfaction level with the provided healthcare services was 3.68.
1.2. Objectives
The objectives of this study were to measure the levels of satisfaction of patients in the Primary Care Centers (PHCCs) of the Ministry of Health in Hail city, Saudi Arabia and to explore the relationships between different dimensions of patient satisfaction and socio-demographic factors (gender, age, marital status, socio-economic status and education). Understanding these relationships may help policy and decision makers to target improved healthcare services for defined sectors of the population.
2. MATERIALS AND METHODS
2.1. Study Design and Population
A cross-sectional quantitative survey was conducted to address the objectives. The population consisted of all the patients visiting six selected PHCCs in Hail during a one month period. These included two large centers (Algarbi and Alshargi); two medium sized centers (Alnuqrah and Alzahrah) and two small centers (Qnn’a and Alniusiah). The six centers were randomly selected according to their capacity and geographical location. This project received approval from the director of training and planning department, Ministry of Health (MOH) of Saudi Arabia, in Hail city.
2.2. Survey Instrument
The survey instrument was modified from the questionnaire originally devised by Ware et al. (1977). The modified instrument was developed in two phases. In the first phase, the items were examined for content validity by two academic faculty members from King Saud University and five postgraduate students in health
administration field. The questionnaire was translated into Arabic and translated back into English by an independent professional. The principles for writing a questionnaire (being specific, short questions, simple words, avoid vagueness and the use of respectful language), were the major focus of this stage (Fowler, 2002). In the second phase, a pilot study was conducted with 25 patients at (Algarbi) PHCC to check the language clarity and understanding of questions. Health service management students from the college of public health and health informatics in Hail University were available to answer the patients’ queries and help in filling in questionnaires for illiterate subjects. The instrument was amended to reflect the outcomes and comments of the pilot study.
The instrument developed for this survey contained 31 items with a closed-ended response format to collect information on (a) Socio-demographic factors (5 items); (b) Attitudes towards the services and facilities in the PHCCs (22 items using a 5-point item scale, with ordinal scores ranging from 1 = Very Poor, to 5, Very Good) and (c) Overall satisfaction level with the services and facilities in the PHCCs (4 items using a 5-point item scale, with scores ranging from 1 = Strongly Disagree to 5 = Strongly Agree). The item scores were used to operationalize six dimensions of patient satisfaction, termed interpersonal, technical, communication, accessibility, availability and overall. Each of these dimensions has been correlated with patient satisfaction in previous studies (Al-Faris et al., 1996; Harrison, 1996; Makhdoom et al., 1997; Gross et al., 1998; Saeed et al., 2001; Albalushi et al., 2012).
2.3. Sampling and Data Collection
A total of 540 questionnaires were distributed to every tenth patient aged 18 year or above visiting the six selected PHCCs for healthcare services in Hail city during a one month period (June 2013). A total of 453 completed questionnaires were returned, resulting in 83.8% response rate. The anonymity of all respondents was kept confidential.
2.4. Data Analysis
conducted to determine if the mean scores for the six dimensions of patient satisfaction varied significantly with respect to six socio-demographic factors (age, gender, age, marital status, socio-economic status and education). The factors and interactions that were not statistically significant (indicated by p>0.05 for the F test statistics) were excluded from the ANOVA models. Only the inferences that were declared significant at p<0.05 are reported.
3. RESULTS
3.2. Socio-demographic
Characteristics
of
Respondents
The sample consisted of 229 (50.6%) male and 224 (49.4%) female patients. Their socio-demographic characteristics, disaggregated by gender, are summarized in Table 1. The age-range of the patients was from 18 to >55 years, with 25-35 as the most frequent age-group (36.9%). The majority of the respondents (55.4%) were married and their income ranged from <SR 5,000 (42.2%) to >SR 15,000 (7.5%). The education of about half of the patients (48.3%) was secondary/high school and about one third (34.2%) had achieved University degrees.
3.2. Patient Satisfaction
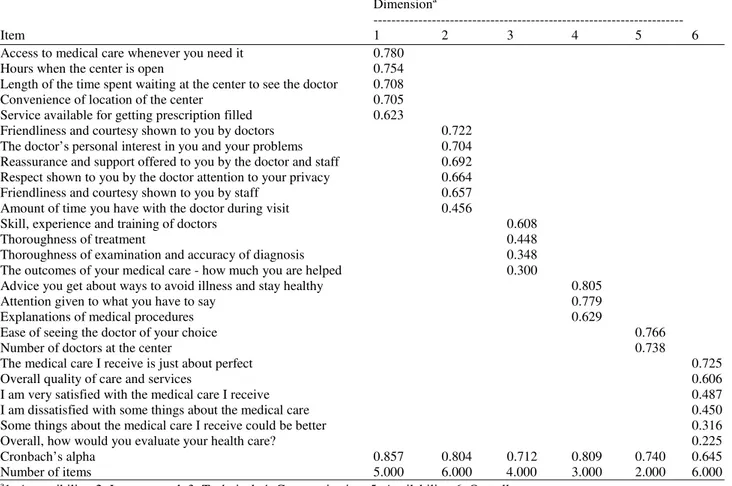
The solution to the Factor Analysis is presented in Table 2. The distributions of the factor loading coefficients revealed that the 26 items measuring patient satisfaction could be meaningfully restructured into six
dimensions, all with eigenvalues>1.0, collectively explaining 59.8% of the variance. Each dimension consisted of two to six items, exhibiting adequate to good internal consistency reliability (Cronbach's alpha = 0.645 to 0.857). Each dimension was operationalized by averaging the scores for its constituent items.
Interpersonal was the highest scoring dimension (M = 3.78) represented by six items measuring the friendliness, courtesy, personal interest, reassurance, respect, support and time offered to the patients by the physicians. Technical was the second highest scoring dimension (M = 3.76) represented by four items measuring the skill, experience and training of doctors, the thoroughness of treatment, examination and accuracy of diagnosis and the positive outcomes of medical care. Communication was the third highest scoring dimension (M = 3.64) represented by three items measuring the advice received about ways to avoid illness and stay healthy, attention given to what the patient had to say and explanations of medical procedures. Overall satisfaction was a moderately scoring dimension (M = 3.60) represented by six items measuring the general quality of the medical care and services received. The two lowest scoring dimensions were accessibility (M = 3.56) represented by five items measuring the access to and the convenience of medical care; and availability (M = 3.43) represented by two items measuring the ease of seeing the doctor of choice and the number of doctors at the center.
Table 1. Socio-demographic characteristics of the respondents
Characteristic Category Male Female Total (%)
Age (Years) 18-25 64 40 104 (23.0)
26-35 84 83 167 (36.9)
36-45 36 39 75 (16.6)
46-55 30 45 75 (16.6)
>55 15 17 32 (7.1)
Marital status Married 129 122 251 (55.4)
Single 87 64 151 (33.3)
Divorced 11 15 26 (5.7)
Widow 2 23 25 (5.5)
Income (SR) <5,000 97 94 191 (42.2)
5,000-9,999 86 78 164 (36.2)
10,000-15,000 38 26 64 (14.1)
>15,000 8 26 34 (7.5)
Education None/Elementary 22 57 79 (17.4)
Secondary/high school 120 99 219 (48.3)
University 87 68 155 (34.2)
Table 2. Factor analysis loadings reducing 26 items into six dimensions Dimensiona
---
Item 1 2 3 4 5 6
Access to medical care whenever you need it 0.780
Hours when the center is open 0.754
Length of the time spent waiting at the center to see the doctor 0.708
Convenience of location of the center 0.705
Service available for getting prescription filled 0.623
Friendliness and courtesy shown to you by doctors 0.722
The doctor’s personal interest in you and your problems 0.704
Reassurance and support offered to you by the doctor and staff 0.692
Respect shown to you by the doctor attention to your privacy 0.664
Friendliness and courtesy shown to you by staff 0.657
Amount of time you have with the doctor during visit 0.456
Skill, experience and training of doctors 0.608
Thoroughness of treatment 0.448
Thoroughness of examination and accuracy of diagnosis 0.348
The outcomes of your medical care - how much you are helped 0.300
Advice you get about ways to avoid illness and stay healthy 0.805
Attention given to what you have to say 0.779
Explanations of medical procedures 0.629
Ease of seeing the doctor of your choice 0.766
Number of doctors at the center 0.738
The medical care I receive is just about perfect 0.725
Overall quality of care and services 0.606
I am very satisfied with the medical care I receive 0.487
I am dissatisfied with some things about the medical care 0.450
Some things about the medical care I receive could be better 0.316
Overall, how would you evaluate your health care? 0.225
Cronbach’s alpha 0.857 0.804 0.712 0.809 0.740 0.645
Number of items 5.000 6.000 4.000 3.000 2.000 6.000
a
1: Accessibility; 2: Interpersonal; 3: Technical; 4: Communication; 5: Availability; 6: Overall
3.3. Relationships between Patient Satisfaction
and Socio-Demographic Factors
A significant interaction between age and income (F = 2.89, p = 0.001) characterized the effects of the socio-demographic factors on the interpersonal dimension. This interaction is illustrated by the comparison of the mean scores±95% CI in Fig. 1. The highest scores tended to be reported by patients with an income of SR 5,000-10,000. Within each of the income categories, the mean scores tended to increase with respect to the increasing age of the patients. The lowest scores were consistently reported by the youngest age group (18-25 years) and the highest scores were consistently reported by the oldest age group (>55 years).
A significant interaction between age and income (F = 2.11, p = 0.019) also characterized the effects of the socio-demographic factors on the availability dimension. This interaction is illustrated by the comparison of the mean scores±95% CI. The highest scores tended to be reported
by patients with an income < SR 5,000. Within each of the income categories, the mean scores tended to increase with respect to the increasing age of the patients. The lowest scores were consistently reported by the younger age groups (18-35 years) and the highest scores were consistently reported by the oldest age group (>55 years).
Gender (F = 8.61, p = 0.004) and education (F = 4.91, p = 0.009) were the main factors that influenced the scores for the technical dimension, with no interaction. These effects are illustrated by the comparison of the mean scores±95% CI in Fig. 2. Female patients consistently reported higher scores for the technical dimension than male patients. Patients with limited education (none, elementary, or less than elementary) reported significantly higher scores for the technical dimension than patients who were educated at secondary/high school or University.
Fig. 1. Mean Scores±95% CI for interpersonal classified by age and income
Fig. 2. Mean scores±95% CI for technical classified by gender and education
A comparison of the means scores±95% CI indicates that patients in the lower income categories (<SR 15,000) perceived they had better access to medical care than patients in the highest income category (>SR 15,000). No significant effects of socio-demographic factors were found for the communication dimension at the 0.05 level. Similarly, the mean scores for the overall level of satisfaction were not significantly related to the socio-demographic factors.
4. DISCUSSION
This study used a large sample size (453 patients) with high response rate (83.8%) and a valid and reliable instrument (established by Factor Analysis and
Cronbach’s alpha) to achieve its objectives of measuring the levels of satisfaction of patients in six PHCCs of the Ministry of Health in Hail city, Saudi Arabia and to explore the relationships between different dimensions of patient satisfaction and socio-demographic factors.
(Abdalla et al., 2005) was conducted in 1999 using a different instrument. This survey recorded a mean score (3.68) within the confidence limits that were recorded in this study.
The previous survey revealed that the highest level of satisfaction was for the quality of the physicians. Similarly the respondents in the current survey reported the highest level of satisfaction for the friendliness, courtesy, personal interest, reassurance, respect, support and time offered to the patients by the physicians and their skill, experience and training, the thoroughness of their treatment, examination, the accuracy of their diagnosis and the positive outcomes of medical care. The previous survey revealed that the lowest level of satisfaction was for the availability of services. Similarly, the respondents in the current survey reported their lowest level of satisfaction for access to medical care and the availability of doctors. The implications are that it appears that the quality of healthcare services in Hail city have not improved for over a decade.
Although the mean scores for overall satisfaction score did not vary significantly with respect to the socio-demographic characteristics of the patients, analysis of the different dimensions of satisfaction revealed socio-demographic differences. Irrespective of their socio-demographic status, the participants in the current study perceived that they received similar levels of advice about ways to avoid illness and stay healthy, attention given to what they had to say and explanations of medical procedures; however, different sectors of the population in Hail city were not equally satisfied with other aspects of the healthcare services they received. The doctors and staff were perceived to show greater friendliness, courtesy, personal interest, reassurance, respect, support and time to the older patients, especially those in the middle income category. The ease of seeing doctors was perceived to be the highest by the older patients, especially those in the lowest income category. Female patients with limited education perceived they received the highest levels of treatment, diagnosis and outcomes. Patients in the lower income categories perceived they had better access to medical care than patients in the highest income category. The relationships between the socio-demographic characteristics of patients and their different dimensions of satisfaction may help healthcare providers to meet the different needs of patients based on their gender, age and socio-economic status (Abutiheen, 2014; Mercer et al., 2008; Lin et al., 2010).
4.1. Limitation of the Study
This study was based on one population of patients visiting six PHCCs in Hail city for one month, which limits the generalizability of the findings. Further research is necessary to determine if the perceptions of the study population are representative of all patients in the Saudi population. The researcher assumed that the data were not limited by extreme response bias (i.e., a very strong polarization of good vs. bad quality judgments) which is a typical communication style found among Middle-Eastern Arab societies (Minkov, 2009).
5. CONCLUSION
The results of this study will support policy and decision makers to make better plans for the future by understanding that different socio-demographic groups within the population perceive different levels of satisfaction with the healthcare services provided by PHCCs. The development of such policies is particularly important to benefit those patients who appear to be the least satisfied with specified aspects of the services offered. Efforts should be targeted to improve the satisfaction levels of these groups of patients.
6. REFERENCES
Abdalla, A.M., A.A. Saeed, M. Magzoub and E. Reerink, 2005. Consumer satisfaction with primary health care services in Hail City, Saudi Arabia. Saudi Med. J., 26: 1030-1032. PMID: 15983707
Abutiheen, A.A.R.K., 2014. Clients’ ™ satisfaction with referral system in Karbala. Am. J. Applied Sci., 11: 216-222.
Aggarwal, A. and M. Zairi, 1998. Total partnership for primary health care provision: A proposed model-part II. Int. J. Health Care Q. Assurance, 11: 7-13. DOI:10.1108/09526869810199593
Aharony, L. and S. Strasser, 1993. Patient satisfaction: What we know about and what we still need to explore. Med. Care Rev., 50: 49-79. DOI: 10.1177/002570879305000104
Al-Doghaither, A.H. and A.A. Saeed, 2000. Consumers' satisfaction with primary health services in the city of Jeddah, Saudi Arabia. Saudi Med. J., 21: 447-454.
Al-Sakkak, M.A., N.A. Al-Nowaiser, H.I. Al-Khashan, A.A. Al-Abdrabulnabi and R.M. Jaber et al., 2008. Patient satisfaction with primary health care services in Riyadh. Saudi Med. J., 29: 432-436. PMID: 18327374
Albalushi, R.M., M.R. Sohrabi and A.A. Kolahi, 2012. Clients’ satisfaction with primary health care in Muscat. Int. J. Preventive Med., 3: 713-717.PMID: 23112898
Brown, R.B. and L. Bell, 2005. Patient-centred quality improvement audit. Int. J. Health Care Q.
Assurance, 18: 92-102. DOI:
10.1108/09526860510588124
Donabedian, A., 1991. Quality assurance. Structure, process and outcome. Nursing Standard, 7: 4-5. Fowler, F., 2002. Survey Research Methods. 3rd Edn.,
Thousand Oaks, Sage.
Grogan, S., M. Conner, P. Norman, D. Willits and I Porter et al., 2000. Validation of a questionnaire measuring patient satisfaction with general practitioner services. Q. Health Care, 9: 210-215. DOI:10.1136/qhc.9.4.210
Gross, D.A., S.J. Zyzanski, E.A. Borawski, R.D. Cebul and K.C. Stange, 1998. Patient satisfaction with time spent with their physician. J. Family Practice, 47: 133-137.PMID: 9722801
Harrison, A., 1996. Patients' evaluations of their consultations with primary health clinic doctors in the United Arab Emirates. Family Practice, 13: 59-66. DOI:10.1093/fampra/13.1.59
Lin, B.Y.J., C.C. Lin and Y.K. Line, 2010. Patient satisfaction evaluations in different clinic care models: Care stratification under a national demonstration project. Health Place, 16: 85-92. DOI:10.1016/j.healthplace.2009.08.008
Makhdoom, Y., A. Elzubier and M. Hanif, 1997. Satisfaction with health care among primary health care centers attendees' in Al-Khobar, Saudi Arabia. Saudi Med. J., 18: 227-230.
Mansour, A.A. and M.H. Al-Osimy, 1993. A study of satisfaction among primary health care patients in Saudi Arabia. J. Commun. Health, 18: 163-173. PMID: 8408747
Mercer, L.M., P. Tanabe, P.S. Pang, M.A. Gisondi and D.M. Courtney et al., 2008. Patient perspectives on communication with the medical team: Pilot study using the communication assessment tool-team (CAT-T). Patient Edu. Counseling, 73: 220-223. DOI: 10.1016/j.pec.2008.07.003
Minkov, M., 2009. Nations with more dialectical selves exhibit lower polarization in life quality judgments and social opinions. Cross-Cultural Res., 43: 230-250.DOI: 10.1177/1069397109334956
Palmer, R.H. and A. Donabedian, 1991. Striving for quality in health care: An inquiry into policy and practice, Health administration press Ann Arbor, Michigan.
Patrick, D.L., E. Scrivens and J.R. Charlton, 1983. Disability and patient satisfaction with medical care. Med. Care, 21: 1062-1075.PMID: 6228699
Saeed, A.A., B.A. Mohammed, M.E. Magzoub and Al- A.H. Doghaither, 2001. Satisfaction and correlates of patients' satisfaction with physicians' services in primary health care centers. Saudi Med. J., 22: 262-267.PMID: 11307115
Salisbury, C., A. Burgess, V. Lattimer, D. Heaney and J. Walker et al., 2005. Developing a standard short questionnaire for the assessment of patient satisfaction with out-of-hours primary care. Family Practice, 22: 560-569.PMID: 15964865