Rev Saúde Pública 2005;39(5) www.fsp.usp.br/rsp
INTRODUCTION
Chronic non-transmissible diseases comprise a large group of conditions that are by far the leading causes of deaths in the city of São Paulo and in Brazilian urban areas as a whole.* Individual population-based studies on the prevalence of recognized risk factors for these conditions have been performed in Brazilian communities as large as the city of São Paulo18 (popu-lation of 9.2 million in 1987) and as small as Bambuí9 (population of 21,000 in 1996-1997).
Although these studies were carried out with sound
Prevalence of a set of risk factors for chronic
diseases in the city of São Paulo, Brazil
Luiz Francisco M arcopitoa, Sérgio São Fins Rodriguesb, M aria Aparecida Pachecob, M írian M atsura Shirassub, Artur Jaques Goldfederb and M arco Antonio de M oraesb
aDepartamento de Medicina Preventiva. Universidade Federal de São Paulo. São Paulo, SP, Brasil. bDivisão de Doenças Crônicas Não-Transmissíveis. Centro de Vigilância Epidemiológica. Secretaria
de Estado da Saúde de São Paulo. São Paulo, SP, Brasil
*Datasus. Available from URL: http://tabnet.datasus.gov.br [fev 2004]
Funded by the Fundação de Amparo à Pesquisa do Estado de São Paulo (Fapesp - Grant n. 99/06187-6) Received on 26/2/2004. Reviewed on 31/5/2005. Approved on 17/6/2005.
Correspondence:
Luiz Francisco Marcopito
Departamento de Medicina Preventiva - Unifesp Rua Borges Lagoa, 1341
04038-034 São Paulo, SP, Brasil E-mail: [email protected] Keywords
Chronic disease, epidemiology. Morbidity surveys. Risk factors. Hypertension. Smoking. Obesity. Lipids. Diabetes mellitus. Prevalence.
Abstract
Objective
To estimate the prevalence of a set of risk factors for non-transmissible chronic diseases and compare it to that found 15-16 years ago in a similar survey.
Methods
A cross-sectional household survey was carried out comprising a random sample of people aged 15-59 years in the city of São Paulo between 2001 and 2002. The total of 2,103 people answered a questionnaire and had their blood pressure, weight, height, waist and hip circumferences measured. For a third of these participants, their total cholesterol, HDL-cholesterol, triglycerides and glucose levels were determined. Results
The total age-adjusted prevalences in the study age group were as follows: smoking, 22.6%; uncontrolled blood pressure, 24.3%; obesity, 13.7%; increased waist circumference, 19.7%; total cholesterol ≥240 mg/dL, 8.1%; HDL-cholesterol <40 mg/ dL, 27.1%; triglycerides ≥200 mg/dL, 14.4%; and blood glucose ≥110 mg/dL, 6.8%. Smoking, uncontrolled blood pressure, high total cholesterol, low HDL-cholesterol and high triglycerides were significantly more prevalent in men than women.
Conclusions
The prevalences of a set of risk factors for chronic diseases showed men to have a poorer condition than women. In comparison to the previous survey, the prevalence of uncontrolled blood pressure remained unchanged but the prevalence of smoking has significantly lowered.
Rev Saúde Pública 2005;39(5) www.fsp.usp.br/rsp
Risk factors for chronic diseases Marcopito LF et al
were later excluded because they were found to be pregnant or puerperal women.
The final sample was then composed of 2,103 peo-ple who answered a questionnaire applied by trained nurse interviewers, and had their blood pressure, weight, height, waist and hip circumferences meas-ured twice. Most (70.9%) interviews were performed on weekends (42.7% on Saturdays and 28.2% on Sundays), and 29.1% were equally distributed on the other five weekdays. A 10% randomly selected sub-sample of interviews had their integrity checked by telephone, and showed no discrepancies.
About a third of participants (759), randomly se-lected, answered a quantitative nutrition questionnaire and 700 had a fasting venous blood sample collected at home; as 59 (7.8%) refused to have their blood drawn. In order to minimize the interference of overeat-ing on weekends, blood collection was not carried out on Sundays and was avoided on Mondays. Blood sam-ples were processed for determinations of plasma glu-cose and serum total cholesterol, HDL-cholesterol and triglycerides. In order to check for fasting status blood glucose (≥126 mg/dl) and triglycerides (≥200 mg/dl) were cross-tabulated: only 13 subjects fell in both cat-egories, 11 of whom were known to have diabetes and/ or lipid disorder.
Blood pressure was measured using a mercury col-umn sphygmomanometer in the middle and at the end of questionnaire application: systolic and diastolic pressures were those of first and fifth Korotkoff’s phases, respectively. Height was deter-mined with the participant barefooted, using a tape measure fixed to a wall and a plastic square. Weight was measured using a portable digital dial scale, and participants wearing only underclothes. Waist and hip circumferences were taken with a tape measure, snug and parallel to the floor. As these measurements were taken twice, the average of both was considered for the analysis.
Participants were classified as smokers if they re-ported smoking on a daily basis, regardless the amount consumed. Participants with systolic blood pressure ≥140 mm Hg or diastolic ≥90 mm Hg were considered as having uncontrolled blood pressure, regardless any other circumstances. The body mass index cut-off point for obesity was ≥30 kg/m2 in both sexes, the cut-off point for increased waist circumfer-ence was >102 cm in males and >88 cm females. Prevalences of high serum total cholesterol (≥240 mg/ dl), low HDL-cholesterol (<40 mg/dl), high triglycerides (≥200 mg/dl), and elevated plasma
glu-*Datasus. Available from URL: http//tabnet.datasus.gov.br [2004 Fev]
The results on the prevalences of recognized risk factors for non-transmissible chronic diseases (smok-ing, excessive alcohol intake, uncontrolled blood pressure, diabetes, poor nutritional habits, lipid dis-orders, obesity, physical inactivity, stress) are incon-sistently published, usually making it difficult for external comparisons. In this regard, the World Health Organization22 has gathered additional information from authors of more recent studies in order to build a comparable international picture on the prevalence of such risk factors.
The 1987 survey in the city of São Paulo18 pro-vided statistics on smoking, blood pressure, body mass index, alcohol intake, and physical inactivity at that time. This present study was designed to esti-mate current statistics for the same risk factors plus others, making comparison when possible. Over those 15-16 years, however, the city has become more popu-lated (10.4 million in 2000) and more violent: the crude death rate for homicides increased 50% from 1987 to 2000.* As a result, it has become more diffi-cult to carry out household surveys.
M ETH O D S
A cross-sectional household survey was carried out comprising a random sample of people from four out of six homogeneous socio-economic areas20 of the city of São Paulo. Three districts in each of the four areas were selected, in order to cover similar geo-graphical area as surveyed in 1987.18 The sample size was estimated in 2,100 subjects, about 40% larger than that of the 1987 survey.
From the 12 chosen districts 96 census tracts were randomly selected and checked for the year 2001 and about 25,000 households were listed. By systematic sampling a large enough number of household were selected for reaching the estimated sample size. A total of 2,852 households were visited, of which 155 (5.4%) were vacant and 186 (6.5%) were occupied by people older than 59 years.The remaining 2,511 households were approached through an invitation letter. If resi-dents agreed to participate in the study, a list of all people aged 15-59 years was made up by an inde-pendent visitor, the list order following the pattern re-commended by Marques & Berquó,14 which consists of listing first from older to younger males. A total of 401 (16.0%) residents refused to participate.
!
Rev Saúde Pública 2005;39(5) www.fsp.usp.br/rsp
Risk factors for chronic diseases Marcopito LF et al
cose (≥110 mg/dl) were determined according to these cut-off points.
For purposes of external comparisons, age was di-vided into 10-year groups, except the youngest (15-29 years). Point estimate prevalences were presented in percentages, by age groups and sex with their 95% confidence intervals (95% CI), calculated using the exact probabilities given by the binomial distribu-tion, because in some cases the normal approxima-tion would not hold.
The crude total prevalences by sex were corrected for the sampling effect using the respective actual age compositions, according to Cochran’s4 technique for finite populations. The 95% CI were calculated using the normal approximation to the binomial dis-tribution:
95% CI = p ± 1.96 e ,
where e is the sampling error of p, obtained from the square root of the variance (e2) of p, as follows:
where
Ni is the population size in the ith age group,
ni is the sample size in the ith age group, and
pi is the sample prevalence in the ith age group.
This correction generated population estimates of total prevalences for both men and women. In order to eliminate possible distortions caused by different age compositions in both sexes, age-adjusted total prevalences in both sexes were calculated for com-parison purposes, using the age composition of total (male and female) target population as standard.
For statistical comparisons confidence intervals were used rather than p-values. Data entry was
dupli-cated. The electronic programs SPSS 10.0, Stata 7.0, and Excel 97 were used.
This study was approved by the Research Ethics Committee of the Universidade Federal de São Paulo. Participants were informed of their measurement re-sults and those with abnormal rere-sults were referred to the nearest health care center.
RESU LTS
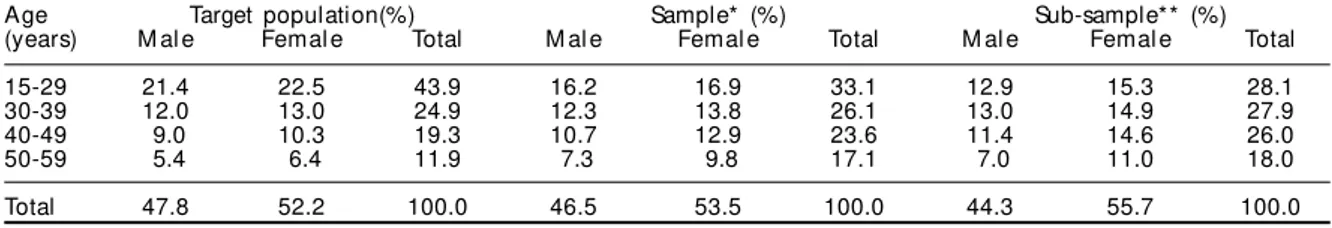
Table 1 shows the distribution by age and sex of the target population, total sample, and sub-sample. It was observed that, although the total proportion by sex in sample were quite similar to the target population, the sample and sub-sample were somewhat older and had a slightly higher female proportion, justifying correc-tions and adjustments for both variables.
The prevalences are showed by age groups, allow-ing for direct comparisons across age groups and in both sexes. The total prevalences are presented in two ways: those obtained in the sample (crude), and popu-lation estimates by sex (individually corrected for the actual population age composition of each sex).
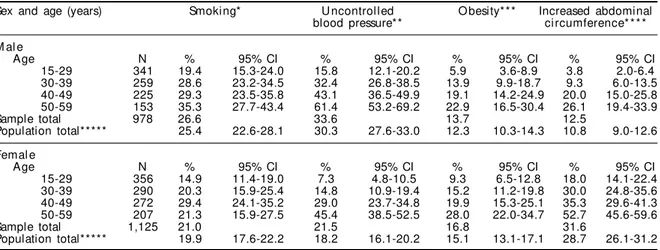
Table 2 shows age-specific and total (crude and cor-rected) prevalences by sex. Smoking consistently in-creased with age among men. Across age groups of both sexes, the prevalence of smokers in the 50-59 age group showed to be significantly higher in men. The prevalence of uncontrolled blood pressure increased with age in both sexes, and was statistically higher in males in all age groups. Population estimates of total prevalences of both smoking and uncontrolled blood pressure were statistically higher in men. Concerning obesity, there was a trend of increasing prevalences with age in both sexes, but differences across both fe-male and fe-male age groups were not significant. In-creased waist circumference statistically inIn-creased with age in both sexes, but the statistical differences be-tween both sexes were probably due to differences in cut-off points (102 cm and 88 cm).
Table 3 shows age group and total (crude and cor-rected) prevalences by sex obtained from the sub-sample of 700 participants. Population estimate of 1 pi (1-pi) (Ni- ni
e2 = ·Σ Ni2
(Σ Ni)2 ni (N - 1)
)
i
Table 1 - Age distribution by sex (%) of the target population, the total sample, and the sub-sample, São Paulo City, 2001-2002.
Age Target population(%) Sample* (%) Sub-sample** (%)
(years) M al e Femal e Total M al e Femal e Total M al e Femal e Total
15-29 21.4 22.5 43.9 16.2 16.9 33.1 12.9 15.3 28.1
30-39 12.0 13.0 24.9 12.3 13.8 26.1 13.0 14.9 27.9
40-49 9.0 10.3 19.3 10.7 12.9 23.6 11.4 14.6 26.0
50-59 5.4 6.4 11.9 7.3 9.8 17.1 7.0 11.0 18.0
Total 47.8 52.2 100.0 46.5 53.5 100.0 44.3 55.7 100.0
" Rev Saúde Pública 2005;39(5) www.fsp.usp.br/rsp
Risk factors for chronic diseases Marcopito LF et al
Table 3 - Prevalences* (%) of total cholesterol, triglycerides, and glucose, by age group and sex, in the actual population estimates. City of São Paulo, 2001-2002.
Sex and age Total cholesterol Tri gl yceri des Gl ucose
(years) ≥240 mg/dl ≥200 mg/dl ≥110 mg/dl
M al e
Age N % 95% CI % 95% CI % 95% CI
15-29 90 1.1 0.03-6.0 10.0 4.7-18.1 1.1 0.03-6.0
30-39 91 12.1 6.2-20.6 34.1 24.5-44.7 11.0 5.4-19.3
40-49 80 27.5 18.1-38.6 37.5 26.9-49.0 11.3 5.3-20.3
50-59 49 16.3 7.3-29.7 24.5 13.3-38.9 24.5 13.3-38.9
Sample total 310 13.5 26.5 10.3
Population total** 10.6 7.7-13.5 22.7 18.5-27.3 8.2 5.5-10.8
Femal e
Age N % 95% CI % 95% CI % 95% CI
15-29 107 2.8 0.6-8.0 0.9 0.02-5.1 0.9 0.02-5.1
30-39 104 2.9 0.6-8.2 6.7 2.7-13.4 3.8 1.1-9.6
40-49 102 4.9 1.6-11.1 7.8 3.4-14.9 10.8 5.5-18.5
50-59 77 20.8 12.4-31.5 18.2 10.3-28.6 15.6 8.3-25.6
Sample total 390 6.9 7.7 7.2
Population total** 5.5 3.4-7.5 5.9 3.8-7.9 5.4 3.4-7.4
*Regardless of specific treatment
**Corrected estimates for the actual population by sex
total prevalence of inadequate total cholesterol was significantly higher in men and it seemed to be more frequent in younger males. Across age groups of both sexes, the prevalence of inadequate total cholesterol in the 40-49 age group was statistically higher in men; the 50-59 age group was the one with the high-est prevalence among women. Population high-estimate of total prevalence of inadequate triglycerides was much higher in men due to increased prevalences in those aged less than 50 years. Although it was observed a trend of increasing prevalence of inadequate plasma glucose with age, there were no statistical differences between both sexes, neither across age groups nor in the population estimates of total prevalences.
Table 4 shows age-specific and total (crude and cor-rected) prevalences by sex of inadequate HDL-choles-terol in 684 participants who were tested for this sub-stance (16 were excluded due to lipidemia). There was
no consistent variation with age in both sexes. Across age groups in both sexes, the extreme age groups were different, and the population estimate of total preva-lence was statistically higher in men.
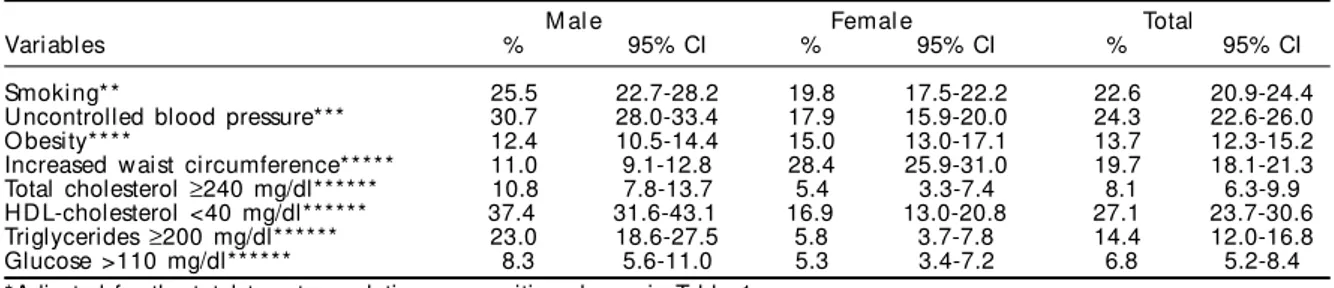
It can be observed that smoking, uncontrolled blood pressure, high total cholesterol, low HDL-cho-lesterol and high triglycerides remained significantly more prevalent in those men aged 15-59 years, even after adjustment for age (Table 5).
D ISCU SSIO N
The study sample was randomly drawn from a tar-get population comprising 88.6% of all São Paulo residents (population of 6,869,224) in the 15-59 age group studied. In such a household survey, the re-fusal percentage (16.0%) was considered acceptable in view of the violence situation in São Paulo, where Table 2 - Prevalence of smoking, uncontrolled blood pressure, obesity, and increased waist circumference by sex and age group in actual population estimates. City of São Paulo, 2001-2002.
Sex and age (years) Smoking* U ncontrolled O besity*** Increased abdominal
blood pressure** ci rcumference* * * *
M al e
Age N % 95% CI % 95% CI % 95% CI % 95% CI
15-29 341 19.4 15.3-24.0 15.8 12.1-20.2 5.9 3.6-8.9 3.8 2.0-6.4
30-39 259 28.6 23.2-34.5 32.4 26.8-38.5 13.9 9.9-18.7 9.3 6.0-13.5
40-49 225 29.3 23.5-35.8 43.1 36.5-49.9 19.1 14.2-24.9 20.0 15.0-25.8
50-59 153 35.3 27.7-43.4 61.4 53.2-69.2 22.9 16.5-30.4 26.1 19.4-33.9
Sample total 978 26.6 33.6 13.7 12.5
Population total***** 25.4 22.6-28.1 30.3 27.6-33.0 12.3 10.3-14.3 10.8 9.0-12.6
Femal e
Age N % 95% CI % 95% CI % 95% CI % 95% CI
15-29 356 14.9 11.4-19.0 7.3 4.8-10.5 9.3 6.5-12.8 18.0 14.1-22.4
30-39 290 20.3 15.9-25.4 14.8 10.9-19.4 15.2 11.2-19.8 30.0 24.8-35.6
40-49 272 29.4 24.1-35.2 29.0 23.7-34.8 19.9 15.3-25.1 35.3 29.6-41.3
50-59 207 21.3 15.9-27.5 45.4 38.5-52.5 28.0 22.0-34.7 52.7 45.6-59.6
Sample total 1,125 21.0 21.5 16.8 31.6
Population total***** 19.9 17.6-22.2 18.2 16.1-20.2 15.1 13.1-17.1 28.7 26.1-31.2
*Dainy smoking, regardless the amount
**Systolic blood pressure ≥140 mmHg or diastolic ≥90 mm Hg, regardless the use of anti-hypertensive drugs ***Body mass index ≥30 kg/m2
#
Rev Saúde Pública 2005;39(5) www.fsp.usp.br/rsp
Risk factors for chronic diseases Marcopito LF et al
the crude death rate for homicides (per 100,000 popu-lation) escalated from 38.8 in 1987 to 58.5 in 2000. Fear of violence must have been the main reason why people living in more privileged areas refused to par-ticipate. If, on the one hand, this was a limitation in coverage, on the other hand it made the target popu-lation similar to that surveyed in 1987.In general, the study showed men to have poorer risk factors for chronic diseases than women across age groups, and there was not a uniform trend of increasing preva-lence with age.
Comparisons between total prevalences found in this study with those obtained in the 1987 survey18 may not be completely accurate, as the standard age distributions used for adjustments were not the same in both studies. Fully comparable estimates will be showed in forthcoming reports, as the 1987 database was fully recovered and is available.
The adjusted prevalence of smoking in this present study was much lower than that found in 1987 sur-vey,18 both in males (from 44.6 to 25.4%) and females
(from 31.9 to 19.9%). Accordingly, the total smoking prevalence dropped from 37.9 to 22.6%. At least three factors may have contributed to this smoking reduc-tion in the interim of both studies: an actual reducreduc-tion of population’s purchasing power; income reduction due to increasing unemployment; and the impact of ongoing national campaigns against smoking.
No substantial changes were noted in the prevalences of uncontrolled blood pressure. Men continued to have a poorer condition (31.0% in 1987, 30.3% in the present study) than women (14.4 and 18.2%, respec-tively), and the total prevalence did not change at all (22.3 vs 24.3%). One may only speculate about this unchanged picture, since hypertension control depends on several factors such as access to health care, diag-nosis and treatment compliance.
Repeated cross-sectional surveys have the disad-vantage of showing twice the situations after, rather than during, a certain time period. What is available are two snapshots taken 15 years apart and no infor-mation of what happened in between. It is difficult, therefore, to match the declining mortality rates due to stroke*in São Paulo with the unchanged picture on uncontrolled blood pressure. A similar trend was seen in two surveys carried out 15 years apart in the southern Brazilian city of Porto Alegre.5
In regard to obesity, the results are not comparable to those of the 1987 survey18 due to differences in body mass index cut-off points. Waist circumference and blood levels of lipids and glucose were not de-termined in the 1987 survey.
Still in regard to blood pressure, it must be empha-sized that the numbers presented here do not refer to the prevalence of hypertension, as the working definition of hypertension usually takes into account the current intake of anti-hypertensive drugs. When there is any degree of control with the use of drugs, the prevalence Table 4 - Prevalence* of H D L-cholesterol by age group
and sex in the actual population estimates. City of São Paulo, 2001-2002.
HDL-cholesterol <240 mg/dl
M al e
Age N % 95% CI
15-29 90 37.8 27.8-48.6
30-39 85 34.1 24.2-45.2
40-49 75 36.0 25.2-47.9
50-59 49 44.9 30.7-59.8
Sample total 299 37.5
Population total** 37.3 31.6-43.1
Femal e
Age N % 95% CI
15-29 107 14.0 8.1-22.1
30-39 103 18.4 11.5-27.3
40-49 101 20.8 13.4-30.0
50-59 74 17.6 9.7-28.2
Sample total 385 17.7
Population total** 16.9 13.0-20.8
*Regardless the use of specific treatment
**Corrected estimates for the actual population in each sex
Tabela 5 - Prevalências (%) ajustadas* das variáveis por idade, sexo e total. Cidade de São Paulo, 2001-2002.
M al e Femal e Total
Variables % 95% CI % 95% CI % 95% CI
Smoki ng* * 25.5 22.7-28.2 19.8 17.5-22.2 22.6 20.9-24.4
Uncontrolled blood pressure*** 30.7 28.0-33.4 17.9 15.9-20.0 24.3 22.6-26.0
O besity**** 12.4 10.5-14.4 15.0 13.0-17.1 13.7 12.3-15.2
Increased w aist circumference***** 11.0 9.1-12.8 28.4 25.9-31.0 19.7 18.1-21.3
Total cholesterol ≥240 mg/dl****** 10.8 7.8-13.7 5.4 3.3-7.4 8.1 6.3-9.9
HDL-cholesterol <40 mg/dl****** 37.4 31.6-43.1 16.9 13.0-20.8 27.1 23.7-30.6
Triglycerides ≥200 mg/dl****** 23.0 18.6-27.5 5.8 3.7-7.8 14.4 12.0-16.8
Glucose >110 mg/dl****** 8.3 5.6-11.0 5.3 3.4-7.2 6.8 5.2-8.4
*Adjusted for the total target population composition shown in Table 1 **Daily smoking, regardless the amount
***Systolic blood pressure ≥140 mmHg or diastolic ≥90 mm Hg, regardless the use of anti-hypertensive drugs ****Body mass index ≥30 kg/m2
*****Waist circumference >102 cm in men or >88 cm in women ******Regardless the use of specific treatment
$ Rev Saúde Pública 2005;39(5) www.fsp.usp.br/rsp
Risk factors for chronic diseases Marcopito LF et al
REFEREN CES
1. Ayres JEM. Prevalência de hipertensão arterial na cidade de Piracicaba. Arq Bras Cardiol
1991;57(1):33-6.
2. Barreto SM, Passos VMA, Firmo JOA, Guerra HL, Vidigal PG, Lima-Costa MFF. Hypertension and clustering of cardiovascular risk fctors in a community in Southeast Brazil: the Bambuí Health and Ageing Study. Arq Bras Cardiol 2001;77(6):576-81.
3. Cochran WG. Sampling techniques. New York: John Wiley & Sons; 1953. p. 330.
4. Freitas OC, Carvalho FR, Neves JM, Veludo PK, Parreira RS, Gonçalves RM, Lima SA, Bestetti RB. Prevalence of hypertension in the urban population of Catanduva, in the State of São Paulo, Brazil. Arq Bras Cardiol 2001;77(1):16-21.
5. Fuchs FD, Moreira LB, Moraes RS, Bredemeier M, Cardozo SC. Prevalência de hipertensão arterial sistêmica e fatores associados na região urbana de Porto alegre. Estudo de base populacional. Arq Bras Cardiol 1994;63(6):473-9.
6. Gigante DP, Barros FC, Post CL, Olinto MT. Prevalên-cia de obesidade em adultos e seus fatores de risco. Rev Saúde Pública 1997;31:236-46.
7. Klein CH, Araújo JWG, Leal MC. Inquérito epidemio-lógico sobre hipertensão arterial em Volta Redonda, RJ. Cad Saúde Pública 1985;1:58-70.
8. Klein CH, Souza e Silva NA, Nogueira AR, Bloch KV, Campos LHS. Hipertensão arterial na Ilha do Governador, Brasil. II. Prevalência. Cad Saúde Pública 1995;11:389-94.
of hypertension usually is higher than the prevalence of uncontrolled blood pressure, because drug-controlled people are considered to have hypertension.
For purposes of comparison there were selected some Brazilian population-based studies in which working definitions matched those applied in this study. Due to differences in the age and sex composi-tion among studies, it was opted for comparing age-specific prevalences in both sexes. When these strata were not available in the original publications, it was search for additional information in the WHO Global NCD Infobase.22
When compared to the prevalences found in the small communities of Ilha do Governador (a district of the city of Rio de Janeiro)8 and Bambuí (state of Minas Gerais),2 respectively in 1991-1992 and 1996-1997, age-specific point prevalences of uncontrolled blood pressure are much higher (about two to three times) in the city of São Paulo. They are even higher than those age-specific point prevalences of hyper-tension found in 1998 in the medium-sized (popula-tion: 103,000) urban community of Catanduva (state of São Paulo).4
Age-specific prevalences of smoking observed are much lower than those seen in Araraquara (state of São Paulo)12 in 1987. When compared to Bambuí,9 the prevalence of smoking in men aged 50–59 years was the same, but much lower in younger age groups. Among women, the prevalence of smoking in the 50-59 age group is twice as high in the present study, but lower in younger age groups.
In younger age groups of both sexes, point prevalences of obesity are similar to those found in
1987 in Araraquara11 and in 1994 in Pelotas (state of Rio Grande do Sul),6 but in older age groups the prevalences vary according to sex and age. As com-pared to the results obtained in a large Brazilian sur-vey16,22 in 1997, the prevalences of obesity are higher in all age groups of both sexes, but may not be com-parable because the available data refer to both ur-ban and rural populations.
The prevalences of inadequate total cholesterol in women are very similar to those obtained in Bambuí.9,22 In men, however, the 40-49 age group shows a prevalence 2.5 times higher than that in Bambuí. This may be a feature of São Paulo popula-tion or may be due to sampling error.
No comparable Brazilian data on the prevalences of inadequate serum triglycerides, plasma glucose and waist circumference are available for external com-parisons. Result interpretation on increased waist cir-cumference must take into account the different cut-off points for men and women.
External comparisons with the results of other Bra-zilian studies are difficult because the available sta-tistics were generated in different urban areas at dif-ferent points in time.
ACKN O W LED GEM EN TS
%
Rev Saúde Pública 2005;39(5) www.fsp.usp.br/rsp
Risk factors for chronic diseases Marcopito LF et al
9. Lima-Costa MF, Barreto SM, Uchoa E, Firmo JO, Vidigal PG, Guerra HL. The Bambui Health and Ageing Study (BHAS): prevalence of risk factors and use of preventive health services. Rev Panam Salud Publica 2001;9:219-27.
10. Lolio CA. Prevalência de hipertensão arterial em Araraquara. Arq Bras Cardiol 1990;55(3):167-73.
11. Lolio CA, Latorre MRDO. Prevalência de obesidade em localidades do estado de São Paulo, Brasil, 1987. Rev Saúde Pública 1991;25:33-6.
12. Lolio CA, Souza JMP, Santo AH, Buchalla CM. Prevalência de tabagismo em localidade urbana da região sudeste do Brasil. Rev Saúde Pública 1993;27:262-5.
13. Malerbi DA, Franco LJ. Multicenter study of the prevalence of diabetes mellitus and impaired glucose tolerance in the urban Brazilian population aged 30-69 yr. The Brazilian Cooperative Group on the Study of Diabetes Prevalence. Diabetes Care
1992;15:1509-16.
14. Marques RM, Berquó E. Seleção da unidade de informação em estudos de tipo “ survey” : um método para a construção das tabelas de sorteio. Rev Saúde Pública 1976:10:81-92.
15. Martins IS, Coelho LT, Mazzilli RN, Singer JM, Souza CU, Antonieto Jr AE et al. Doenças cardiovasculares ateroscleróticas, dislipidemias, hipertensão, obesida-de e diabetes melito em população obesida-de área metropo-litana da região sudeste do Brasil. I- Metodologia da pesquisa. Rev Saúde Pública 1993;27:250-61.
16. Monteiro CA, Benicio MHDA, Conde WL, Popkin BM. Shifting obesity trends in Brazil. Eur J Clin Nutr 2000;54:342-6.
17. Piccini RX, Victora CG. Hipertensão arterial sistêmica em área urbana no sul do Brasil: prevalência e fatores de risco. Rev Saúde Pública 1994;28:261-7.
18. Rego RA, Berardo FAN, Rodrigues SSF, Oliveira ZMA, Oliveira MB, Vasconcellos C et al. Fatores de risco para doenças crônicas não-transmissíveis: inquérito domiciliar no município de São Paulo, SP (Brasil). Metodologia e resultados preliminares. Rev Saúde Pública 1990;24:277-85.
19. Rouquayrol MZ, Veras FM, Vasconcelos JS, Bezerra RC, Gomes IL, Bezerra FA. Fatores de risco na doença coronária. Inquérito epidemiológico em estratos habitacionais de um bairro de Fortaleza. Arq Bras Cardiol 1987;49(6):339-47.
20. Sposati A, coordenador. Mapa da inclusão/exclusão social da cidade de São Paulo: Editora da PUC-SP; 1996. p. 124.
21. Trindade IS, H eineck G, M achado JR, Ayzemberg H , Formighieri M , Crestani M , Gusso J. Prevalência da hipertensão arterial sistêmica na população urbana de Passo Fundo (RS). Arq Bras Cardiol
1998;71(2):127-30.