FACULDADE BOA VIAGEM
MESTRADO PROFISSIONAL EM GESTÃO EMPRESARIAL
CENTRO DE PESQUISA E PÓS-GRADUAÇÃO EM ADMINISTRAÇÃO
PARTNER SELECTION IN STRATEGIC ALLIANCES
IN THE BRAZILIAN ETHANOL INDUSTRY
Camilla Falk
Camilla Falk
PARTNER SELECTION IN STRATEGIC ALLIANCES
IN THE BRAZILIAN ETHANOL INDUSTRY
Dissertation presented as a
requisite for the procurement of
the Master’s in Management of
the Center of Research and
Graduate Studies in Business of
Faculdade Boa Viagem.
Supervisor: Walter Fernando Araújo de Moraes, Ph.D
ACKNOWLEDGMENTS
A research of this nature is never possible without the help of many people. Therefore, I would like to give a special thanks to those whom helped make it possible.
To my supervisor, Professor Walter Moraes, I would like to thank the wisdom, patience and time dispended helping me complete the dissertation. Without your inestimable guidance, this research would not have been possible.
To Professors Augusto César S. de Oliveira and Janann J. Medeiros, I would like to thank the insights and suggestions in the project phase as they helped to enrich the research .
To the Ricardo Brennand Group, in special Mr. Celimar Mavignier, I would like to thank the support and encouragement that has always been given to both my academic and professional growth.
To all the professors whom I had the privilege of meeting during the course of the program, I will be eternally thankful for the wisdom and enthusiasm shared. The lessons learned here will always be remembered and used for many years to come.
To Faculdade Boa Viagem, I would like to thank the partial scholarship granted throughout the course.
To the employees of the Faculdade Boa Viagem, especially Albina and Kássia, I would like to thank all the help provided and constant good mood.
To my family and friends, thank you for the support and eventual prayers needed. Thankfully, our prayers were answered and the research is now complete.
To Rodrigo, I would like to thank your patience, love and understanding. Even though I had to be absent many times, you have always provided constant support.
ABSTRACT
The subject of partner selection criteria in the specific literature of strategic alliances is a subject that has not been much explored in academic researches. This research investigates the possible associations of the partner selection criteria in firms of the Brazilian ethanol industry as well as if there is a specific set of criteria preferred by these firms. In order to assess this, questionnaires that were sent by postal mail were used. The data was analyzed through statistical techniques such as descriptive statistics, factor analysis, correlation analysis and reliability tests. Results indicate that most partner selection criteria dimensions studied are positively associated amongst each other, with the exception of control. Additionally, there are evidences which indicate that there is in fact a preferred set of partner selection criteria for the firms in the Brazilian ethanol industry. It is suggested that firms who wish to enter into this specific industry must consider all dimensions of the partner selection in order to have a greater chance of success in the strategic alliance.
RESUMO
Critério de seleção de parceiros na literatura específica acerca de alianças estratégicas não é um tema que tem sido muito explorado em pesquisas acadêmicas. O presente estudo se propõe a analisar as possíveis associações entre os critérios de seleção de parceiros entre as empresas da indústria brasileira de etanol assim como a possibilidade de haver um conjunto de critérios específicos preferidos por estas empresas. Para tal, questionários enviados por meio do correio foram utilizados. Os dados foram analisados através de técnicas estatísticas tais como estatísticas descritivas, análise fatorial, análise de correlação e testes de confiabilidade. Os resultados indicam que a maior parte das dimensões que envolvem os critérios de seleção de parceiro estudados possui associações positivas entre si, com a exceção da dimensão de controle. Adicionalmente, há evidências de que há de fato um conjunto de critérios preferidos pelas empresas na indústria brasileira de etanol. É sugerido que as empresas que desejem entrar nesta indústria específica deverão considerar todas as dimensões de escolhe de parceiro para que tenha uma maior chance de sucesso na aliança estratégica.
LIST OF TABLES
Table 01 - Evolution of Brazilian Alcohol Production ...20
Table 02 – Evolution of Brazilian Alcohol Exportation...20
Table 03 – Exportation Rank of Brazilian Alcohol by Country...21
Table 04 - Strategic Contributions of Joint Ventures ...28
Table 05 - Partner Characteristic Definitions and Examples ...37
Table 06 – Variables versus theory and authors used ...46
Table 07 – Outline of the Questionnaire ...48
Table 08 – Location Region of the Company...51
Table 09 – Sugarcane grinding capacity of company (per year)...51
Table 10 – Percentage that alcohol production represents in the revenue...52
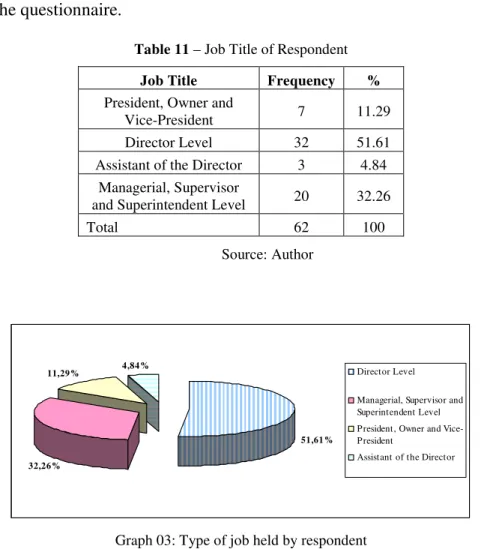
Table 11 – Job Title of Respondent...53
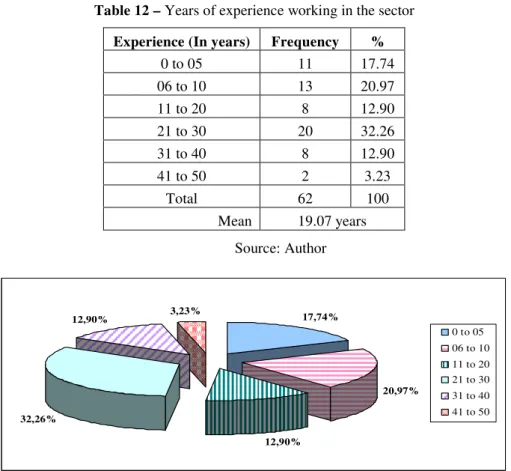
Table 12 – Years of experience working in the sector ...54
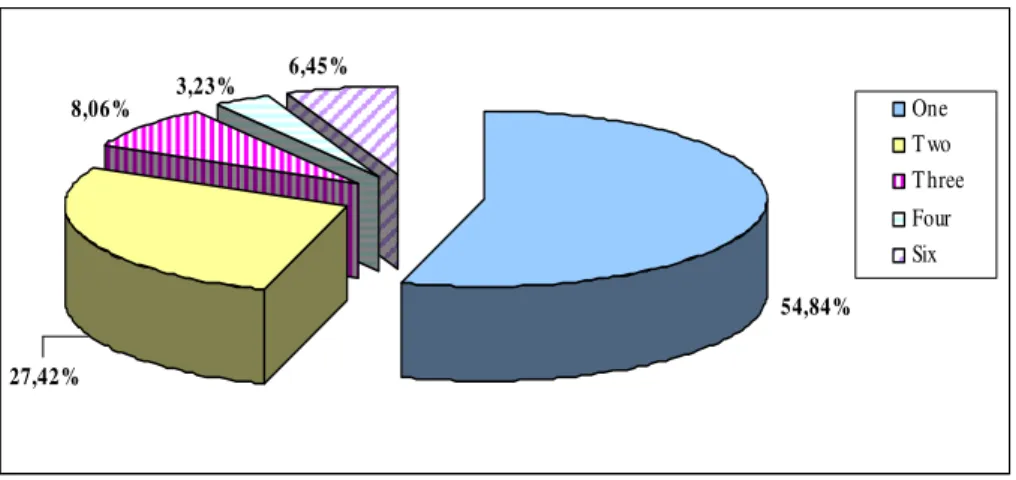
Table 13 – Number of Production Units in the group ...54
Table 14 – Descriptive statistics regarding previous alliance experience ...55
Table 15 – Descriptive statistics regarding previous alliance experience - Existence ...56
Table 16 – Descriptive statistics regarding previous alliance experience - Nature...57
Table 17 – Descriptive statistics regarding nature of alliance to establish...58
Table 18 – Probability of establishing an alliance in near future ...59
Table 19 – Importance of trust and deterrence of deceitful behavior factors...60
Table 20 – Paired Samples Test for Difference of Means...61
Table 21 – Total Variance Explained - Alliance Forms...63
Table 22 – Varimax Rotated Component Matrix - Alliance Forms ...64
Table 23 – One-Sample Kolmogorov-Smirnov Test - Alliance Forms Factors...64
Table 24 – Total Variance Explained - Assets ...65
Table 25 – Varimax Rotated Component Matrix - Assets ...66
Table 26 – One-Sample Kolmogorov-Smirnov Test - Assets...66
Table 27 - Total Variance Explained - Intrinsic Knowledge Component...67
Table 28 – Varimax Rotated Component Matrix - Intrinsic Knowledge Component ...68
Table 29 – One- Sample Kolmogorov-Smirnov Test - Intrinsic Knowledge Component...68
Table 30 – Total Variance Explained - Capability Component ...69
Table 31 – Rotated Component Matrix - Capability Component ...70
Table 32 – One- Sample Kolmogorov-Smirnov Test - Capability Component...70
Table 33 – Total Variance Explained - Attractiveness Component ...71
Table 35– One- Sample Kolmogorov-Smirnov Test - Attractiveness Component...72
Table 36– Total Variance Explained - Control ...73
Table 37 – Rotated Component Matrix - Control...74
Table 38 – One- Sample Kolmogorov-Smirnov Test - Control ...74
Table 39 – Analysis of the Assets Component...75
Table 40 – Analysis of Intrinsic Knowledge Component ...76
Table 41 – Analysis of the Capability Component ...77
Table 42– Analysis of the Attractiveness Component ...77
Table 43 – Analysis of the Control Component...78
LIST OF GRAPHS
Graph 01: Sugarcane Grinding Capacity of Firms (per year) ...51
Graph 02: Percentage that Alcohol Represents in the Revenue ...52
Graph 03: Type of Job Held by Respondent ...53
Graph 04: Years of Experience Working in the Sector...54
Graph 05: Number of Production Units in the Group ...55
Graph 06: Frequency of Previous Alliance Experience ...56
Graph 07: Frequency for Existence of the Alliance ...56
Graph 08: Type of Partner Chosen to Form Alliance...57
Graph 09: Type of Partner Would be Chosen to Form Alliance ...58
Graph 10: Probability of Forming a New Alliance in the Near Future ...59
Graph 11: Means for Alliances Form (Question 06)...63
Graph 12: Means for Assets (Question 08) ...65
Graph 13: Means for Intrinsic Knowledge (Question 09)...67
Graph 14: Means for Capabilities (Question 10)...69
Graph 15: Means for Attractiveness (Question 11)...71
CONTENTS
CHAPTER 01: INTRODUCTION...11
1.1 Strategic Alliances...11
1.2 Background to the problem ...14
1.3 Justification and Relevance of the Study...23
1.4 Research Questions ...24
1.5 Research Objectives ...24
1.5.1 General ...24
1.5.2 Specific ...24
1.6 Logical Structure of the Dissertation...25
CHAPTER 02: THEORETICAL FRAMEWORK ...26
2.1 Strategic Alliances...26
2.2 International Strategic Alliances ...30
2.3 Trust in Strategic Alliances ...31
2.4 Control in Strategic Alliances ...33
2.5 Partner Selection Criteria ...35
CHAPTER 03: METHODS ...41
3.1 Research Outline...41
3.1.1 Type of Study ...41
3.1.2 Population and Sample ...42
3.1.3 Research Hypotheses...43
3.1.4 Definition of Variables ...44
3.1.5 Instrument for Data Collection...45
3.1.6 Method for Data Collection...48
3.2 Limitations of the Study ...49
CHAPTER 04: DATA ANALYSIS ...50
4.1 Descriptive Analysis...50
4.1.2 Previous Experience with Alliances ...55
4.1.3 Probability of establishing an alliance in the near future ...59
4.1.4 Level of importance for trust and deterrence of deceitful behavior factors ...60
4.2 Factor Analysis of Strategic Alliance Components...61
4.2.1 Forms of Alliance Component ...62
4.2.2 Assets Component ...64
4.2.3 Intrinsic Knowledge Component...66
4.2.4 Capabilities Component ...68
4.2.5 Attractiveness Component...70
4.2.6 Control Component ...72
4.3 Test of Hypotheses ...74
4.3.1 Test of Hypothesis One ...74
4.3.2 Test of Hypothesis Two...79
CHAPTER 05: CONCLUSIONS...82
BIBLIOGRAPHICAL REFERENCES...86
CHAPTER 01: INTRODUCTION
1.1 Strategic Alliances
The matter of strategic alliances has been growing considerably in importance throughout the decades. Strategic alliances have been popular, according to Hitt et al. (1999,
p. 296-297) because they allow partnering with an experienced player already in the targeted market. Many studies have been undertaken regarding the subject and the subsequent literature is quite vast.
Strategic alliance is a form of cooperative alliance, for which Child and Faulkner (1998, p. 1) state that:
“(…) Is the attempt by organizations to realize their objectives through cooperation with other organizations, rather than in competition with them. It focuses on the benefits that can be gained through cooperation and how to manage the cooperation as to realize them. A cooperative strategy can offer significant advantages for companies which are lacking in particular competences or resources to secure these through links with others possessing complementary skills or assets; it may also offer easier access to new markets, and opportunities for mutual synergy and learning”.
There are many different aspects of strategic alliances that can be studied, which include but are not limited to: partner selection criteria, types of alliances and governance structure, deceitful behaviors, trust, learning, value creation, and international strategic alliances.
In the view of Contractor and Lorange (2004), strategic alliances can achieve at least seven partially overlapping objectives. Some of these objectives include risk reduction, economies of scale and/or rationalization, and technology exchanges, amongst others. On the other hand, Doz and Hamel (1998, p. 4-5) argue that alliances have only three primary purposes: co-option, cospecialization and also learning and internalization.
supplier relationships, technology licensing, technology exchange and research and development agreements (DAS and TENG, 1996, p. 827).
Differentiation is equally considered between equity and non-equity structures. Equity arrangements refer to structures that include some form of ownership such as minority investment of one firm in other or joint ventures. Non-equity arrangements refer to long-term contracts or agreements with no ownership involved such as supply, manufacturing, marketing, and technology exchange and licensing agreements and cooperative R&D (WISNIESKI and SONI, 2004, p. 74).
Concerning the subject of cooperative behavior of alliance partners, experts have stated: “Given that it is often impossible to identify who is likely to act opportunistically, the interesting question is what enables alliance partners to garner enough confidence in partner cooperation so that they are not overwhelmed by the potential hazards in alliances” (DAS and TENG, 1998, p. 491). Low confidence levels arising from deceitful behavior not only discourage the formation of alliances but also perpetuate suspicion among partners even after the alliances are formed (DAS, 2005, p. 706-707). It can be noted, therefore, that the matters of trust versus deceitful behaviors are closely linked to one another.
Trust, as defined by Doney et al. (1998, p. 604), is the “willingness to rely on another
party and to take action in circumstances where such action makes one vulnerable to the other party”. In other words, it is the expectation that the other party will not act in a deceiving manner, if presented with the opportunity. According to Krishnan et al. (2006, p. 895), this
expectation is confirmed when parties (i) demonstrate reliability by carrying out their promises, (ii) act fairly when dealing with each other, and (iii) exhibit goodwill when unforeseen contingencies arise.
leveraging of cospecialized resources, and the learning and internalization of critical skills. What makes the difference between these three different options is the value creation logic that the company conceived for the alliance.
Learning from partners, according to Hamel et al (2002, p. 04) is paramount. Successful companies view each alliance as a window on their partner’s broad capabilities. They use skills in areas outside the formal agreement and systematically diffuse new knowledge throughout their organizations. Because of this, companies must take great care not to disclose their core competencies to their partner through the learning process. Management should implement some form of filters in order to avoid that critical information be disclosed to other parties.
Cross-border alliances, as defined by Jagersma (2005, p. 42), are ‘international agreements on collaboration between two or more independent companies who exploit a tangible or intangible asset’. He also states that most cross-border alliances are concentrated in relatively few industries – those typified by high entry costs, globalization, scale economies, and rapidly changing technologies. It is also important to note that international strategic alliances are rather more difficult to manage for they many times involve different cultures, languages and set of rules which have to be respected and dealt with by the foreign company.
The particular subject of partner selection criteria has not been highly explored by researchers as have been other aspects of strategic alliances. The typology which has served as the basis for many studies in the area is that developed by Geringer (1988). Some studies, however, have developed their own model such as Dacin et al (1997). In their paper, it is
capabilities and unique competencies. Depending on national and/or organizational culture, firms can deem one set of characteristics more important than another.
The study in question relates the subject of strategic alliances to the specific context of the Brazilian ethanol industry. A more thorough explanation of this specific context can be found in the subsequent section.
1.2 Background to the problem
The perspective of a petroleum shortage and, consequently, the rising of prices have caused a real possibility of a global energy crisis. In an attempt to diminish the impact of the crisis, leaders of various nations, especially the United States’ president George W. Bush and the Brazilian president Luiz Inácio Lula da Silva, are seeking alternative energy sources, which are derived from natural, renewable and clean resources. Because it possesses all three characteristics mentioned above, ethanol has become one of the most promising alternative sources to petroleum, as can be noticed by recent media coverage (JC ONLINE, 2007, 2007a).
The scenario plotted for the market of ethanol in the year of 2010 predicts that the demand in the United States will be from 18 to 20 billion liters1 (4.76 and 5.28 billion gallons), fifteen to 18 billion liters (3.96 and 4.76 billion gallons) in Brazil, from 6 to 12 billion liters (1.59 and 3.17 billion gallons) in Japan, nine and 14 billion liters (2.38 and 3.70 billion gallons) in the European Union, and between 1 to 2 billion liters (264 and 528 million gallons) in Eastern Europe as well as Canada (CARVALHO, 2003, pg. 9). This can signify an annual production of up to 68 billion liters (17.97 billion gallons). At present, Brazil and the United States are responsible for 70% of the world’s production of ethanol, adding up to 35 billion of liters (9.25 billion gallons) per year. The world production isn’t more than 50 billion
1
liters (13.21 billion gallons) and Brazilian annual production of ethanol is currently 18 billion liters (4.76 billion gallons). The prediction made by Brazilian producers is that by the year of 2013, the national production capacity will rise to 30 billion liters (7.93 billion gallons) annually (JC ONLINE, 2007, p. 1).
Ethanol can be basically extracted from three main sources: beets, cereals (mainly corn) and sugarcane. A recent study from the International Agency for Energy (IAE), however, indicates that only ethanol produced from sugarcane, as is the Brazilian case, can compete with petroleum prices and generate grand environmental benefits. The types of ethanol that are derived from beets (as the European) and cereals (as the North-American) can cost up to 30% more than petroleum and don’t significantly reduce the emissions of CO2,
according to IAE.
Brazilian ethanol production is much more efficient than that of the United States, where the ethanol is derived almost exclusively from corn. Production per hectare is twice than that in the US and the energy used per unit from planting to processing is more than five times more efficient (WHEATLEY, 2007). For these technological reasons, ethanol extracted from sugarcane is much more advantageous for the fuel market, which provides Brazil a very favorable and competitive position.
A good example of how the North-American ethanol production has directly affected products in other countries can be observed in Mexico. In this case, the price of the main product consumed by the population, tortilla, which uses corn as its main ingredient, hit in 2007 the decade’s highest prices. The main reason for this significant raise in the price is directly explained by United States’ increased search for corn as the resource used for ethanol production as well as for food (NETO, 2007).
On this note, a critical discussion to the future of the expansion of ethanol production has been the discussion around what is being called in Brazil the “Food Crisis”. The prices of basic foods such as corn, soy, rice, beans and wheat have been soaring in the second trimester of 2008 and the major blame for this has fallen on ethanol production. Important representatives of global organizations such as Jean Ziegler of the United Nations have made serious accusations against the large scale ethanol production going as far as classifying it is a “crime against humanity”. However, these statements were directed mainly to the United States and Europe, due to their use of corn and grains in ethanol production (JC ONLINE, 2008, p. 1; COHEN, 2008, p.1, GLOBO, 2008, p. 1).
Brazil has a long history in sugarcane production, ever since the time it was still a Portuguese colony in the 16th century. The colonizers brought the first sugarcane plants to Brazil in 1532, in the expedition of Martim Afonso de Souza. In the country, the plant spread in the fertile soil, with a boost from the hot tropical climate and slave labor brought from Africa. It was the beginning of the first Brazilian economical cycle, the ‘Sugarcane Cycle’ (UNICA, 2007a, p. 1).
During the late 16th and early 17th centuries, the Dutch had the control over the transport, refinement and distribution of Brazilian sugar. However, in the year of 1580, with the death of the Portuguese king and no direct heirs to the throne, Filipe II, the king of Spain, overtook the Portuguese throne and controlled the country during sixty years, which included the control over Brazil. In control of Portugal, King Filipe II forbid that the sugar from Brazil be exploited in any way by the Dutch people. In retaliation, after several frustrated attempts, the Dutch managed in 1630 to invade the Northeast portion of Brazil (mainly the state of Pernambuco) and there remained until expelled definitely in 1654 (COSTA and MELLO, 1999).
Although the Dutch were successfully expelled from Brazil, they took with them the knowledge and experience acquired in sugarcane production. With this, they set up their own plantations in the Antilles, located in the Caribbean Sea. Thereupon, the Brazilian sugar won a major competitor in the global market along with the sugar derived from beats, which was being largely produced in Europe ever since the 17th century. Also, the heavy taxes practiced by many governments for the importation of the product served as another obstacle to its commerce (UNICA, 2007c, p. 20). The sugarcane cycle, therefore, entered a period of decline until its resurrection in the 1970’s.
alternative to diminish it’s oil vulnerability, the Brazilian government created in 1975 the National Alcohol Program (Proalcool), which diversified the sugar industry with large investments supported by the World Bank, making it possible to increase the areas dedicated to the plantation of sugarcane and the establishment of new alcohol distilleries (UNICA, 2007a, p. 3). Additionally, the program helped boost the ethanol production in the country and helped transform this Brazilian industry into one of the most modern in the world (LEMOS, 2007, p. 40-41).
Currently with 389 industrial plants in operation and over one hundred projects in implementation, Brazil is the second largest producer and the largest exporter of ethanol in the world (LEMOS, 2007, p. 40). The Brazilian alcohol production in 2005/2006 was of 17 billion liters (4.49 billion gallons) per year (in average), which is sufficient to meet the demand for the internal automotive fleet, as well as providing enough extra fuel for the mixture of over 20% of alcohol with automotive gasoline (BERTELLI, 2006, p. 1).
Investments being made in the sugar-alcohol sector already add up to 14.6 billion Reais (currently around 8.1 billion US Dollars), according to UNICA, which is the Union of the Sugercane Industry for the state of São Paulo and also the major representative of the sector in the country. Most part of the investments are being made by national companies, with small amounts of foreign capital also being used in the sector. A good example is that of the firm Sempra Energy of the United States, which has agreed with local partners to build twelve alcohol refineries in northern Brazil for US$ 4.2 billion. Others already committed include Cargill from the United States, Louis Dreyfus of France, the Noble Group of Singapore and Infinity Bio-energy of the United Kingdom (WHEATLEY, 2007).
advantage is the extensive know-how acquired in ethanol production throughout the centuries, besides the technology developed specifically for the sector. A third advantage is that Brazil can guarantee the supply of ethanol to the market during the entire year since the country has two harvests per year, for each main production region have harvest in two different time periods.
The North-Northeast region has harvest through the months of September and March and the Center-South region through the months of May and November. According to UNICA (2004, p. 11-12), the sugarcane culture in that area represents nearly 85% of the Brazilian production and is formed by the states of São Paulo, Paraná, Goiás, Mato Grosso, Mato Grosso do Sul, Minas Gerais, Rio de Janeiro and Espírito Santo. The North-Northeast region is responsible for the other 15% of sugarcane production and is formed mainly by the states of Alagoas, Pernambuco, Paraíba, Sergipe, Rio Grande do Norte and Bahia. Of the 320 sugarcane processing units operating in the harvest of 2003/2004, two hundred and twenty six were situated in the Center-South region. The state of São Paulo has the greatest concentration of processing units.
In 2006, the Brazilian ethanol production reached its record of 17 billion liters (4.5 billion gallon), up nearly 10% from the previous year. Meanwhile, exports raised 20% to a record of 3.2 billion liters (845 million gallons). Analysts of the sector expect Brazilian production to raise 10% more in 2007. In fact, the volume of Brazilian alcohol exported is modest in comparison to the totality of alcohol produced in the country and its growth potential over a short period of time, without the need for large investments (VIDAL et al.,
2006, p. 15).
production of 15.9 billion liters (4.26 billion gallons). UNICA president, Eduardo Pereira de Carvalho, estimates that the demand of alcohol will reach, in a conservative approach, in 2013/2014 the mark of 24.95 billion liters (6.59 billion gallons) for the internal consumption and 5.90 billion liters (1.56 billion gallons) for exports, which gives a total demand of 30.85 billion liters. This is the equivalent to 8.15 billion gallons (CARVALHO, 2006).
Table 01 - Evolution of Brazilian Alcohol Production
HARVEST VOLUME (m(In thousand) 3) HARVEST VOLUME (m(In thousand) 3)
90/91 11,515 98/99 13,869
91/92 12,716 99/00 13,022
92/93 11,695 00/01 10,593
93/94 11,285 01/02 11,536
94/95 12,685 02/03 12,623
95/96 12,590 03/04 14,809
96/97 14,372 04/05 15,413
97/98 15,399 05/06 15,936
Source: UNICA, 2007d, adapted
Contrary to the alcohol production, exports volume of Brazilian alcohol has had an accentuated growth tendency since the end of the 20th Century (see Table 02). As a matter of fact, the volume has gone from 117.9 million liters (31.2 million gallons) in 1998 to 3.4 billion liters (902.64 million gallons) in 2006. The market expectation is that this volume of exports will continue to grow even more, as well as the production and internal market demand.
Table 02 – Evolution of Brazilian Alcohol Exportation
YEAR NET WEIGHT (ton) (in million) US$ FOB (in thousand) M3 US$/m3
1998 94.34 35.52 117.93 301,21
1999 345.37 71.79 431.71 166,29 2000 181.81 33.97 227.26 149,47 2001 276.54 92.15 345.67 266,57 2002 607.21 169.15 759.02 222,86 2003 609.72 159.02 762.15 208,65 2004 1,926.63 497.74 2,408.29 206,68 2005 2,080.49 765.52 2,600.61 294.36 2006 2,733.24 1,604.73 3,416.55 469.69
As can be observed in Table 03, the main countries who imported the Brazilian alcohol in the year of 2006 were the United States (1.7 billion liters/462.1 million gallons), followed by the Netherlands (344.5 million liters/91 million gallons), Japan (227.7 million liters/60.1 million gallons), Sweden (201.3 million liters/53.2 million gallons) and El Salvador (182.7 million liters/48.3 million gallons). The average price was US$ 469.69/m3, with a maximum of US$ 626.01 (Venezuela) and a minimum of US$ 360.74 to South Korea.
Table 03 – Exportation Rank of Brazilian Alcohol by Country
CLASSIF. COUNTRIES JANUARY TO DECEMBER - 2006
NET WEIGHT
(ton)
US$ FOB (in million)
M3
(in thousand) US$/m3
BRAZIL 2,733.2 1,604.7 3,416.5 469.69
1 UNITED STATES 1,399.4 882.4 1,749.2 504.43 2 NETHERLAND 275.6 151.3 344.5 439.35 3 JAPAN 182.1 95.2 227.7 418.15 4 SWEDEN 161.1 79.3 201.3 394.04 5 EL SALVADOR 146.2 80.3 182.7 439.41 6 JAMAICA 106.4 56.1 133.0 421.70 7 VENEZUELA 82.7 64.7 103.3 626.01 8 SOUTH KOREA 74.7 33.7 93.4 360.74 9 COSTA RICA 73.8 34.8 92.2 376.92 10 TRINDAD & TOBAGO 57.9 33.4 72.3 461.13
Source: UNICA, 2007f, adapted
The demand for ethanol in the domestic market is a consequence mainly of the growing popularity of biofuel car motors among Brazilian consumers, known as “flex” motors. This type of motor allows the car to function with both gasoline and ethanol, as well as any degree of blend between these two types of fuels. Around 80% of all new automobiles produced in Brazil have a “flex” motor. Additionally, the Brazilian market is, by far, the one that most uses biofuel: ethanol is presently added to the gasoline in the amount of 23% of the volume (WHEATLEY, 2007).
tariff in that country is US$ 0.54/per liter and an additional tax of 2.5% (JC Online, 2007). Besides taxation barriers, the governments of many developed countries are giving incentives and/or providing subsidies to their local ethanol producers. The United States, for example, has spent U$51 billion between 1995 and 2005, which is twice as much as wheat subsidies and four times that of soybean subsidies (KASOTIA, 2008). It is necessary to keep in mind, therefore, that strong competition exists in the sector and that new investments will be necessary to guarantee the competitiveness of Brazilian ethanol industry.
Besides the economical impacts of the sugar and alcohol sector, there is also the social impact: the sugarcane industry is characterized as one of the main job creating activities in the rural area. The industry accounts for one million jobs, with 511 thousand in the field and the remaining in the industrial production of sugar and alcohol. Additionally, six percent of the jobs generated in the agriculture industry in Brazil are linked with the sugarcane sector, which itself corresponds to 14% of all Brazilian occupations (BARROS, et al, 2004 apud VIDAL et al., 2006, p.2 e 4).
It must be pointed out, however, that the sector is loosing its importance in direct job generation in rural areas due to the growing use of modern technologies in the agricultural and industrial segments, especially among the worker class with a lower educational level. In general, the sector generates a five month job during the harvest and five more months for the renewal of the culture (VIDAL et al., 2006, p. 5).
imported. It is estimated that the program avoided the emission of 403 million tons of carbonic gas in the atmosphere from the years of 1975 to 2000 (BERTELLI, 2006).
Another benefit brought by the production of ethanol is the provision of a substantial amount of vegetal material residues, which can be consumed in the generation of electricity, thus reducing the amount of garbage for disposal. Nowadays, there are examples of sugar and alcohol distilleries which are capable of producing all the electricity consumed in their industrial process, by means of the use of sugarcane residue and even have a surplus of electricity for sale to local distribution system. Therefore, the co-generation of bio-electricity can be acknowledged as a sub-product of the sugar and alcohol production in the most modern industrial units (THAME, 2007, p. 2).
In general terms, the sale of electricity by sugar and alcohol plants already represents 8% of the invoicing of sugar mills. The investment cost for the generation of electricity from sugarcane residue varies between US$ 1.00 and US$ 1.20 per kilowatt. An example of a significant investment is the enterprise projected for 2009, by the Brazilian group Cosan, with figures in the order of US$ 700 million. It will produce 700MW of electricity, a sufficient volume to supply a city of 3 million people in Brazil (THAME, 2007, p. 2).
1.3 Justification and Relevance of the Study
The ethanol industry has recently become a matter of great interest to major countries due to the constant rise of petroleum barrel prices in the market and has experienced some shifts in its characteristics. This industry has a tendency for rapid growth for it is the most promising substitute for petroleum. The mentioned industry is a traditional sector in Brazil, dating back as to when the country was still a Portuguese colony, where most of the sugar mills were family-owned and passed on for many generations. The increase of the interest from foreign investors in the Brazilian ethanol industry has started to bring shifts in its characteristics, making this study very interesting.
Another contribution of this study is to test the existing theory on partner selection criteria under a new point of view. Generally, the studies on the subject focus on the point of view of the foreign country entering a new market in an emerging country. In this study, the focus was based on the point of view of the firm immersed in an emerging market country and their preferences in establishing a strategic alliance with another firm, being it foreign or not.
1.4Research Questions
Which criteria do firms in the Brazilian ethanol industry consider using when they decide to form strategic alliances?
How do these criteria relate amongst themselves?
1.5 Research Objectives
1.5.1 General
Test whether the existing theory on partner selection in strategic alliances can be applied in the specific context of the ethanol industry in Brazil.
1.5.2 Specific
- To measure the degree of importance given to the criteria for forming strategic alliances, drawn from the literature review, among the firms of the ethanol industry;
- To identify how the criteria are related and/or associated amongst themselves. 1.6 Logical Structure of the Dissertation
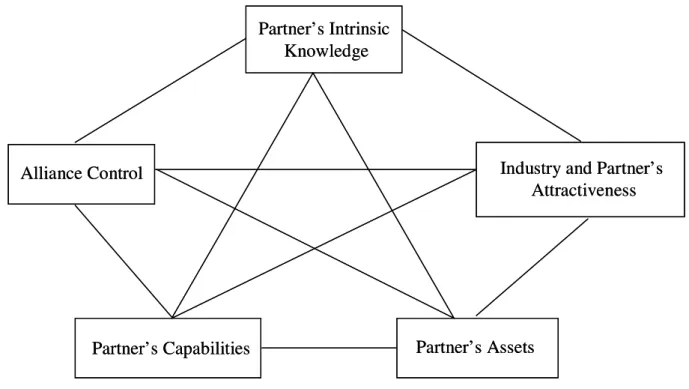
Figure 01 presents the logical structure of the dissertation.
Figure 01: Logical Structure of the Dissertation
Chapter 01: Introduction
• Strategic Alliances
• Background to problem;
• Justification and Relevance;
• Research Question;
• Research Objectives;
• Logical Structure of the Dissertation.
Chapter 02: Theoretical Framework
• Strategic Alliances;
• International Strategic Alliances;
• Trust in Strategic Alliances;
• Control in Strategic Alliances;
• Partner Selection Criteria.
• Research Outline
• Limitations of the Study
Chapter 03: Methods
Bibliographical References Chapter 04: Data Analysis
• Descriptive Analysis
• Factor Analysis
• Test of Hypothesis
Chapter 05: Conclusions
CHAPTER 02: THEORETICAL FRAMEWORK
2.1 Strategic Alliances
The subject of strategic alliances is not new in the business literature, dating as far back as the 70’s and, there have been numerous studies relating to the subject as well as to the different aspects of this phenomenon. These include: purposes of forming alliances (DOZ and HAMEL, 1998; CONTRACTOR and LORANGE, 2004), governance structure (WISNIESKI and SONI, 2004; DAS and TENG, 1996; HITT et al, 1999), deceitful behaviors and
opportunism (DAS, 2005; LUO, 2007), partner selection criteria (DACIN, HITT and LEVITAS, 1997; GERINGER, 1988; LUO 1997 and 1998), trust and cooperative behavior amongst alliance partners (MADHOK 2006; ARIÑO et al 2005), and
international/cross-border strategic alliances (HITT et al., 1999; BLEEKE and ERNST, 2002).
A set of concepts for strategic alliances is presented in the literature. Hitt et al. (1999,
p. 314) define it as “partnerships between firms whereby their resources, capabilities, and core competencies are combined to pursue mutual interests in developing, manufacturing, or distributing goods or services”. Alliance activities, according to Dacin et al. (2007, p. 172),
involves the capture and sharing of risks as well as a variety of tangible and intangible resources (individual skills, knowledge, and contacts).
The strategic alliance form that has been most studied and appears most often in the literature is denominated joint venture. It occurs when two or more firms pool a portion of their resources within a common legal organization (KOGUT 1988, p. 319). It is important to note, however, that joint ventures are not always seen as a form of strategic alliance. Wild et al. (2005, p. 391), for example, argue that a strategic alliance is “a relationship whereby two
or more entities cooperate (but do not form a separate company) to achieve the strategic goals of each”. Existing typologies of strategic alliances do not typically include mergers and acquisitions, wholly-owned subsidiaries, exporting, or arm’s-length transactions carried out in spot markets (DACIN et al., 2007, p. 170).
The different types of strategic alliances can be broadly categorized as being equity or non-equity. Equity arrangements refer to structures that include some form of ownership such as minority investment of one firm in other or joint ventures. Partners own different percentages of equity in the new venture, such as 60 and 40 percent. Non-equity arrangements refer to long-term contracts or agreements with no ownership involved such as supply, manufacturing, marketing, and technology exchange and licensing agreements and cooperative research and development (WISNIESKI and SONI, 2004, p. 74; HITT et al,
1999, p. 314).
Table 04 - Strategic Contributions of Joint Ventures
Risk Reduction: Product portfolio diversification; dispersion and/or reduction of fixed cost; lower total
capital investment; faster entry and payback.
Economies of Scale and/or Rationalization: Lower average cost from larger volume; lower cost by using
comparative advantage of each partner.
Complementary Technologies and Patents: Technological synergy; exchange of patents and territories. Co-opting or Blocking Competition: Defensive joint ventures to reduce competition; offensive joint ventures
to increase costs and/or lower market share for a third company.
Overcoming Government-mandated Investment or Trade Barrier: Receiving permit to operate as a “local”
entity because of local partner; satisfying local content requirements.
Initial International Expansion: Benefit from local partner’s know-how
Vertical Quasi Integration: Access to materials; access to technology; access to labor; access to capital;
regulatory permits; access to distribution channels; benefits from brand recognition; establishing links with major buyers; drawing on existing fixed marketing establishment.
Source: Contractor and Lorange, 2002, p. 27 - Adapted from Farok J. Contractor, “An Alternative View of International Business,” International Marketing Review, Spring 1986
As pointed out by Doz and Hamel (1998, p. 4-5), the purpose of a strategic alliance can either be: co-option, cospecialization or learning and internalization. Co-option turns potential competitors into allies and providers of complimentary goods and services that allow new businesses to develop. Cospecialization is the synergistic value creation that results from the combining of previously separate resources, positions, skills, and knowledge sources. Alliances may also be a field for learning and internalizing new skills, in particular those which are tacit, collective, and embedded (and thus hard to obtain and internalize by other means).
phase five, as old-married couples, each company discovers that it has changed internally as a result of its accommodation to the ongoing collaboration.
Despite the many advantages the use of strategic alliances confers, there can also be disadvantages. One risk from strategic alliances is known as partner opportunism or deceitful behaviors. The threat of potential deceitful behavior hinders the collaborative efforts of member firms in alliances, destroys inter-partner trust and confidence, confers uncertainties about alliance performance, and leads, eventually, to alliance termination (DAS, 2005, p. 706).
Deceitful behavior refers to “the self-interest seeking behavior of alliance firms that involve deceit” (DAS, 2005, p. 706). Similarly, ‘opportunism’, in a joint venture setting, is defined by Luo (2007, p. 41) as:
“an act or behavior performed by a party to seek its own unilateral gains at the substantial expense of another party and/or the joint venture entity by breaching the contract or agreement, exercising private control, withholding or distorting information, withdrawing commitment, shirking obligation or grafting joint earnings.”
There are, however, several means to avoid partner opportunism in strategic alliances. Some of the more significant deterrence mechanisms for controlling deceitful behavior are: contracts, governance structure, mutual hostages, monitoring, participatory decision making, and staffing and training (DAS, 2005, p. 708).
Another downfall in strategic alliances is related to the transfer of core skills. According to Hamel et al. (2002, p. 8), the challenge is to share enough skills to create
2.2 International Strategic Alliances
An alliance or joint venture is considered to be international if at least one parent is headquartered outside the venture’s country of operation or if the joint venture has a significant level of operation in more than one country (GERINGER and HEBERT, 1989, p. 235). On the other hand, Jagersma (2005, p. 42) defines cross-border alliances as “international agreements on collaboration between two or more independent companies who exploit tangible or intangible assets”.
Firms can create more corporate flexibility and extend or leverage their core competencies in new geographic regions by developing international strategic alliances, according to Hitt et al. (1999, p. 334). It is important to note, however, that these alliances are
often more difficult to manage and more risky than domestic ones due to differences in such things as national culture, language, management styles, amongst others. According to Jagersma (2005, p. 43), cross-border joint ventures represent “the highest level of interaction, shared commitment, and administrative complexity among the forms of cooperative agreements’.
For example, Sirmon and Lane (2004, p. 307-308) argue that cultural differences stemming from national, organizational and professional cultures inhibit the employee ability of the international partners to interact effectively. Additionally, of the three types, they argue that professional cultural differences are often the most relevant and salient ones that the interacting employees face. As such, it can be said that they are the most disruptive barriers to the alliance’s effectiveness in achieving its primary value creating activities.
vehicles for international strategy. Among the alliances analyzed, 51% were successful for both partners and only 33% resulted in failure for both partners. Some of the important findings of this study are: (i) acquisitions work well for core businesses and existing
geographic areas while alliances are more effective for edging into related businesses or new geographic markets; (ii) alliances between strong and weak companies rarely work; (iii) the
hallmark of successful alliances that endure is their ability to evolve beyond initial expectations and objectives; (iv) alliances with a even split of financial ownership are more
likely to succeed that those in which one partner holds a majority interest due to clear matters of management control; and (v) more than 75% of terminated alliances ended with an
acquisition by one of the parents.
When taking in part an international strategic alliance, both firms must compromise, understand and take into consideration the differences that exist amongst them. This is an alliance form that requires great care for many complications can appear if the obstacles aren’t well managed. Statistics aren’t favorable: according to Jagersma (2005, p. 48), cross-border alliances often fail and rarely continue in force longer than seven years.
2.3 Trust in Strategic Alliances
In the world of business cooperation, according to Child and Faulkner (1998, p. 45), trust means having sufficient confidence in a partner to commit valuable know-how or other resources to transactions with it despite the fact that, in so doing, there is a risk of the partner taking advantage of this commitment. The matter of trust is, therefore, very important in the process of partner selection.
On the other hand, Ariño et al (2005, p. 15-16), argue that trust is an individual-level
phenomenon and therefore can not be used in an organizational context. They do agree, however, that ‘an ability to rely on inter-personal trust is essential to efficient and equitable business relationships.’ Nevertheless, they propose the concept of relational quality as an alternative construct to the notion on inter-organizational trust. They define relational quality as ‘the extent to which the principals and agents of alliance partners feel confident in dealing with their counterparts’ organizations.
It is important to note that trust and partner opportunism are closely linked. In an alliance where both partners trust each other, the likelihood that one would engage in deceitful behaviors is diminished. A notion that has been presented in both issues is that of the degree of trust/partner opportunism in volatile environments. According to Shah and Swaminathan (2008, p. 475), given that trust can help overcome potential opportunism, its importance in partner attractiveness should be greater when the uncertainty in the alliance is high and the consequent risk of opportunism greater. Likewise, Madhok (2006, p. 32) argues that trust is especially important in situations of uncertainty, since, in its presence, less stringent contracting can occur in the expectation that the social dimensions of the relationship will encourage mutually desirable behavior.
equity joint ventures in a foreign emerging market. Additionally, perceived law enforceability, which is common in emerging markets, increases the incidence of opportunistic behavior by both foreign and local parties. As also predicted by them, perceived information unverifiability increases foreign partner opportunism.
2.4 Control in Strategic Alliances
Control is considered a critical issue for the successful management and performance of strategic alliances (CHILD and FAULKNER, 1998, p. 184). The reason for it to be such an important issue is due to the fact that, depending on the form used, the alliance can become highly bureaucratic and slow to respond to shifts in the environment. Control, according to
Luo et. al. (2001, p. 42), is “a daunting task due to partner differences in culture, objectives,
experience, and social background”. The key, therefore, is to make a trade-off between the levels of control relinquished from one partner to the other in order to maintain the strategic alliance effectively functioning.
Control in strategic alliances refers to the process by which the partners influence, to varying degrees, the behavior and output of the other partners and managers of the alliance itself (CHILD and FAULKNER, 1998, p. 187). Their influence may be exercised on the basis of a number of attributes including:
• power, such as the command of resources that are key for the alliance’s success;
• authority, such as the rights deriving from majority equity share;
• expertise, such as the possession of specialized expertise relevant to the alliance’s
operation;
• rewards, such as the ability to deliver good returns to other, less active, partners and to
Geringer and Hébert (1989, p. 237) in their review of the literature, identified three very different dimensions of international joint venture control that could be found in the studies. The first dimension is the mechanisms by which control may be exercised, such as the
right of veto, representation in management bodies and special agreements related to either technology or management. The second dimension would be that of the extent of control
exercised over an international joint venture. Most studies examining this latter dimension have conceptualized control as being dependent upon the centralization or the locus of the decision making process. The third dimension is that of focus, in which the partner firms may
choose to exercise control over a relatively wider or narrower scope of the international joint ventures’ activities.
The control mechanism dimension can be further divided into three components, according to Geringer and Hebert (1989, p. 241). First, control mechanisms may be context-oriented, in which they encompass a wide variety of informal and cultural-based mechanisms and their essential purpose is to establish an organizational context appropriate for the achievement of parent company objectives. In the second dimension, which is content-oriented, rather than relying on organizational setting, parent firms rely on more direct interventions, either by top managers or by the international joint ventures’ board of directors. Process-oriented mechanisms, the third dimension, is that in which parent firms exercise control through reporting relationships or influence on the international joint venture planning and decision making process.
Furthermore, Luo et al (2001, 44), differentiate between specific and overall control.
decision-making power; specific control selectively targets functional areas such as production, marketing, financial management, or distribution. On the other hand, overall control often seeks joint gains such as international joint ventures’ superior overall performance in profitability, reputation and process efficiency. In contrast, specific control has the tendency to pursue individual, one-party benefits such as knowledge acquisition or protection. Finally, overall control will probably cost more than specific control in executive time, budget, expatriation of managers, and other key resources.
Shah and Swaminathan (2008) sought to test a management control theory-based contingency framework, which suggests that the criteria that determine partner attractiveness and, in turn, partner selection will vary by alliance project context. Their research demonstrated that alliance project type is an important consideration influencing relative importance of various factors that may impact partner attractiveness and partner selection.
Geringer (1988), in his study, hypothesized that control would affect the partner selection criteria. He believed that the extent of shared control would be positively correlated with partner-related criteria valences. However, after undergoing the data collection and analysis, he found that his hypothesis was not generally supported. That is, there were very few correlations found, with some even being negative.
2.5 Partner Selection Criteria
The subject concerning partner selection criteria has not been widely studied in the strategic alliance literature, even though many authors recognize that it is one of the most important phases of alliance formation (GLAISTER and BUCKLEY, 1997, p. 200; ARIÑO,
et al, 1997, p. 20; LUO, 1997, p. 649). Despite the limited number of major studies on the
One of the first studies to be undertaken that studied partner selection procedure in strategic alliances was that of James W. C. Tomlinson in 1970. This study, however, had some intrinsic limitations such as the timeline for the alliances studied dating as far back as twenty years prior to the study and also the use of categories that were not mutually exclusive (AL-KHALIFA and PETERSON, 1999). For this reason, the breakthrough study on the specific subject of partner selection is considered to be that of Geringer (1988). To this day, the typology suggested by him is still widely used. It is based on the distinction between task-related criteria and partner-task-related criteria (GLAISTER and BUCKLEY, 1997, p. 201).
The difference between these two criteria is explained by Geringer (1991) as:
“(…) The operational skills and resources which a venture requires for its competitive success are the “task-related” and criteria associated with the efficiency and effectiveness of partner’s cooperation is “partner-related”. More specifically, “task-related” criteria refer to those variables which are intimately related to the viability of a proposed venture’s operations regardless of whether the chosen investment mode involves multiple partners. (…) In contrast, “partner-related” criteria refer to those variables which become relevant only if the chosen investment mode involves the presence of multiple partners”.
Task-related criteria include knowledge of market conditions, knowledge of environment, and political influence. Partner-related criteria include reputation, potential to maintain a continuing and stable relationship, position within the industry, professionalism, honesty and seriousness, fit, and enthusiasm for the project (ARIÑO et al., 1997, p. 23).
The weighting of selection criteria should reflect the perceived relative importance to the firm of various contributions a partner can make toward improving the competitive position and developing a sustainable competitive advantage (GERINGER, 1991).
While the typology suggested by Geringer has been greatly used, there are authors who have developed other criteria for partner selection. For example, Dacin et al. (1997) in
product/service, willingness to share expertise, partner’s ability to acquire your firm’s special skills, previous alliance experience, special skills that you can learn from your partner and technical capabilities. A more thorough explanation of each criterion has been suggested by Dacin et al. (1997) and can be found in Table 05.
Table 05 - Partner Characteristic Definitions and Examples
1. Financial Assets: Resources that reflect liquidity/financial health (e.g. lines of credit, costs of capital, and debt/equity positions.
2. Complementarity of Capabilities: The degree to which a partner’s resources can be used in conjunction with those of your firm. (For example, the distribution channels of a partner are complementary if those channels can be used to market your firm’s products.)
3. Unique Competencies: Abilities or skills possessed by a partner but not by other firms. (If a partner produces a product that cannot be imitated by other firms, it possesses unique competencies.)
4. Industry Attractiveness: The degree to which an industry presents a favorable environment in which to achieve a firm’s goal. (An industry composed of a small number of competitors and/or potentially large number of buyers may be viewed as attractive.)
5. Cost of Alternatives: The cost to your firm of alternatives to the joint venture. (For example, an alternative to a joint venture may be the development of a wholly owned subsidiary.)
6. Market Knowledge/Access: The expertise or ability of a partner to effectively operate in a market or industry (e.g. understanding competitors and customers, experience with government regulations, knowledge of culture.)
7. Intangible Assets: Assets which are not reflected in financial statements (e.g. firm reputation, brand name, human resources).
8. Managerial Capabilities: The ability of managers to guide their firm efficiently and effectively (e.g. the ability to build consensus among groups or an ability to recognize demographic changes in customers).
9. Capabilities to Provide Quality Product/Service: The ability of a partner to provide buyers with the quality of products they desire (e.g. low defect rates, strong manufacturing facilities).
10. Willingness to Share Expertise: The degree to which a partner is willing to allow your firm to acquire its capabilities (e.g. share technological knowledge, marketing know-how).
11. Partner’s Ability to Acquire your firm’s Special Skills: The ability of a partner to learn/acquire skills which your firm possesses (i.e. experience acquiring skills of partners in joint ventures).
12. Previous Alliance Experience: The number of alliances in which a partner has engaged (e.g. prior participation in joint ventures resulting from formal agreements).
13. Special Skills That you can Learn from your Partner: The ability of your firm to learn/acquire skills which a partner possesses (e.g. partner has technology or marketing know-how that your firm does not possess but whishes to learn).
14. Technical Capabilities: The ability of a partner to develop new process or product technologies (e.g. significant R&D operations; develops and commercializes new products).
Source: Dacin, Hitt and Levitas (1997, p. 10)
embedded, different strategic orientations amongst managers from different countries, and economic factors (LUO, 1997, p. 655; DACIN et al., 1997, p. 8). Important works comparing
the partner selection criteria chosen by different countries, aiming mainly at the differences in choice made by each specific country have been presented by Dacin et al (1997) and Hitt et al
(2004).
In the research examining the differences between Korean and U.S. executives strategic orientations, Hitt et al (1997) found that firms based in different home countries may
approach the same strategic opportunities and global markets in different ways due to their different strategic orientations. They also suggest how different national priorities and institutional arrangements can affect the strategic orientations of managers/firms.
Luo (1997, p. 650) makes a thorough explanation of newly emerging economies concerning industry characteristics. He states that in such economies, even where some economic sectors have been decentralized and privatized, governments still hinder industrial and market structural adjustments. In this situation, local partners can be of great value to foreign firms for they make investment in restricted industries possible and help multinational corporations to gain access to marketing channels and meet government requirements for local ownership.
Moreover, local partners can assist foreign partners in obtaining insightful information and country-specific knowledge concerning governmental policies, local business practices, operational conditions, and the like (LUO, 1998, p. 147).
(1997), who analyzed the companies based in France, Italy and Spain that were using joint ventures to penetrate the Russian market.
These studies are important for they enhance the literature on the subject as well as the knowledge of how specific countries choose their partners. This knowledge can be of great assistance to firms considering on undertaking strategic alliances in these countries. For example, Luo’s (1997) study proposes some important advice, based on his findings, to firms seeking to enter the Chinese market. Such propositions include the notion of what type of partners those firms should seek, depending on their objective.
Shah and Swaminathan (2008, p. 472), on the other hand, performed an extensive review of more than 40 studies in the literature on strategic alliances in strategic management and related fields and uncovered four key factors that have been shown to influence partner selection and subsequent strategic alliance performance. These factors are: (1) trust; (2) commitment; (3) complementarity; and (4) value, or financial payoff.
Another front being opened in the partner selection criteria studies includes alliance legitimacy. Dacin et al. (2007, p. 172) state that legitimacy “pertains to the extent to which a
firm’s structures and activities appear to conform with social norms, values, and expectations of the firms economic and social environment”. Therefore, they propose a framework where there are five distinct types of legitimacy needs in alliance formation. These play an important role in yielding significant technical benefits for firms and their alliances. These types of legitimacy needs are market, relational, social, investment and alliance legitimacy. The legitimacy need that most directly impacts the partner selection criteria is the relational need.
Relational legitimacy, in the view of Dacin et al. (2007, p. 174-175), has to do with a
trading, as well as trustworthiness, and integrity established from prior experience and/or referrals.
Firms that are perceived as attractive and capable partners accrue relational legitimacy, which enables them to demonstrate their viability and predictability as alliance partners, and potentially enhances their access to, and ability to select from a greater pool of high-quality alliance partners. Relational legitimacy is efficient in that firms are able to reduce search costs for partners as their own partner attractiveness (relational legitimacy) serves to draw in prospective partners. The need for relational legitimacy will be particularly important for firms in environments where competition for attractive partners is intense (DACIN et al.,
2007, p. 175).
CHAPTER 03: METHODS
3.1 Research Outline
This study had the objective of identifying which strategic alliance criteria were most often used or were likely to be used by Brazilian firms which sought or are seeking to form strategic alliances in the ethanol market. Furthermore, the study takes into consideration the association amongst those criteria. For such, a thorough review of the strategic alliance literature, and particularly that pertaining to partner selection criteria, trust, control and deceitful behavior was necessary.
3.1.1 Type of Study
The research is descriptive in nature for it represented the first attempt to test the existing theory to the Brazilian reality (COOPER and SCHINDLER, 2003, p. 131). The study was also cross-sectional for it was the attempt to determine the preferences in a given time and date, besides the fact that the questionnaires were only applied once for each company. Due to time restraints, it was not possible in this study to apply the questionnaire in different time periods, in order to assess if the industry preferences will change throughout time.
The research used quantitative data, captured by a survey questionnaire, which was constructed based on the literature review conducted. After the data collection, a factor analysis was run in order to measure the preferences of the industry in Brazil.
Factor analysis is a statistical technique used to identify a relatively small number of factors that can be used to represent relationships among sets of many interrelated variables (Norusis, 1990, p. 313). According to Hair et al (1998, p. 98), a researcher should not
3.1.2 Population and Sample
The culture of sugarcane in Brazil is scattered around the Center-South and North-Northeast region of the country, occupying 2.4% of the agricultural land and nearly 5.5 million hectares. The state of São Paulo, in the Center-South region, concentrates the great majority of the sugarcane processing units in this country.
The population consisted of firms related to the sugar and ethanol industry. According to the latest information from UNICA (2007, p. 03), there are currently 325 production units for ethanol in Brazil. For the harvest of 2007/2008, the Center-South region will present 19 new mills and for the next harvest, there will be more 31 new units. On the other hand, the Ministry of Agriculture presents a list of 366 production units for industries in the above mentioned sector. The listed used for the calculation of the sample size was that of the Ministry of Agriculture, that is, the one that contained 366 production units.
For the calculation of the sample size for finite populations, the following formulas described were used (LEVINE, BERENSON, STEPHAN, 2000, p. 303-305), for a confidence level of 95% and a relative error of 5%.
Calculation of the sample size, for an infinite population, without considering the correction factor of a finite population (cffp):
no = Z² * σ² no = 1.96² * 0.5² no = 385
e² 0.05² Where,
n0 – Initial size of the sample without considering the cffp;
Z – Degree of confidence (1.96);
σ – Standard-deviation of the population;
e – Error in the interval.
Calculation of the sample size considering the correction factor of a finite population (cffp):
n = no * N n = 385 * 366 n = 188
no + (N-1) 385 + 365
Where,
n – Sample size considering the cffp;
n0 – Sample size without considering the cffp;
As consequence, the number of questionnaires to be obtained should have been of 188, answered by firms in the Brazilian ethanol industry. However, only 62 valid questionnaires were received, which represents about 33% of the sample intended. As a consequence, for a confidence level of 95%, the relative error of the sample is 11.4%.
3.1.3 Research Hypotheses
As seen earlier, the research questions of the study at hand are: (i) which criteria do
firms in the Brazilian ethanol industry consider using when they decide to form strategic alliances; and (ii) how do these criteria relate amongst themselves. Likewise, the general
research objective is to test how the existing theory on partner selection in strategic alliances can be applied in the specific context of the ethanol industry in Brazil.
In order to achieve this main objective, three specific objectives were presented. They are: (i) define which criteria are taken into consideration when firms of the ethanol industry in
Brazil are forming strategic alliances; (ii) measure the degree of importance given to the
criteria for forming strategic alliances among these firms; and (iii) analyze how the criteria are
associated amongst themselves.
With these objectives in mind, two general hypotheses have been formulated with basis on the existing theory, as presented in Chapter 02. The test for Hypotheses 1 and 2 will be made possible by the analysis of the sets of the questionnaire pertaining to partner selection criteria, namely questions 8 through 12. The hypotheses suggested are:
Hypothesis 1 – About Partner Selection Criteria
Null Hypothesis H0: There is not an established set of criteria preferred by