E
NERGY AND
E
NVIRONMENT
Volume 5, Issue 6, 2014 pp.669-678
Journal homepage: www.IJEE.IEEFoundation.org
Modeling the importance of biomass qualities in biomass
supply chains for bioenergy production
T.P. Upadhyay, J. H. Greibrokk
University of Tromsø –Arctic University of Norway, School of Business and Economics, Campus Alta, Follumsvei 31, N-9509 Alta, Norway.
Abstract
A tactical-operational level quantitative model can be an important decision support tool for bioenergy producers. Goal programming approach can help analyze the costs and volume implications of various competing goals in terms of biomass characteristics on part of the bioenergy producers. One cost and six quality characteristics goals, namely moisture and ash contents, and thermal values of two types of biomass (forest harvest residue and un/under-utilized species) are selected for the four bioenergy producers in northwestern, Ontario, Canada. We run four models cenarios: i) benchmark total cost and ceilings of mean values of six biomass qualities (Initial Goals), ii)relaxing the quality goals by 10% from the Initial Goals scenario, iii) increasing the conversion efficiency by 10%, and iv) all goals as in Initial Goals except the Atikokan Generating Station (AGS)being supplied with only un/under-utilized biomass. The smaller power plants have relatively less per unit biomass procurement cost. While per unit procurement costs increased, the total costs and biomass volume required to produce the same amount of bioenergy for each power plant decreased in all scenarios compared to the benchmark costs. The goal programming approach, and the results thereof are found to be useful in making effective decisions in the biomass supply chains for bioenergy production.
Copyright © 2014 International Energy and Environment Foundation - All rights reserved.
Keywords: Combined heat and power (CHP); Decisions support system; Forest harvest residue; Northwestern Ontario; Supply chain modeling; Woody biomass.
1. Introduction
Globally forest land-use has significant potential to reduce greenhouse gas (GHG) emissions if managed and used properly. However, it can manifest differently in different regions of the globe depending on the level of development. For example, halting deforestation and forest/soil degradation and enhancement of carbon pool in managed forest ecosystems in developing countries can reduce the GHGs emissions to a large extent [1-3]. Similarly, use of forest residues and un-merchantable trees (mainly under-utilized hardwood species) from sustainably managed forests for bioenergy production in the developed world can replace the fossil fuel-based energy usages, thereby helping reduce the present level of GHGs emissions. Further, use of woody biomass for bioenergy production has many environmental
and socioeconomic benefits –this being sustainable renewable and CO2-neutral resource, reducing risk of
higher costs of production if the environmental and other benefits not taken into account which is the case at present [5, 6]. Moreover, as more biomass-based power plants come into operation in the near future there would be higher volume demand for biomass feedstock that results in an increase in transportation distance, and hence the higher biomass procurement costs [6-8]. In order to analyze decisional problems of such supply/value chains strategic, tactical and operational level planning models are used depending on the scales in terms of planning horizons in general. In this context, a tactical-operational level goal programming (GP) model can be an important decision tool for bioenergy producers in general. The modelling approach in this study, therefore, exemplifies the biomass procurement cost structures under various resource constraints with varying biomass quality, and procurement cost goals on part of the power plants under various model scenarios.
Globally, fossil fuels burning and land-use changes are the major contributors for the GHG emissions [2]. In this context, various international climate policies have exerted pressure on reducing GHG emissions for developed countries in which the Canadian government has also made a commitment to reduce GHG emissions from its major industrial sectors. The forest products industry of Canada, which requires a huge amount of energy to operate, has been a leader in utilizing bioenergy (e.g., burning black liquor and hog fuel for a major part of their energy needs). Beyond the forest industry, several independent power plants generate electricity from forest biomass. For example, utilization of wood biomass for bioenergy production has recently increased dramatically in northwestern Ontario (NWO) with four major energy plants with estimated biomass demand of about 2.21 million green tonnes [9]. Currently, three major combined heat and power(CHP) plant developments in NOW have the potential to use forest biomass feedstock for bioenergy production. These include Resolute Forest Products Thunder Bay CHP Plant (ABTB), Resolute Forest Products Fort Frances CHP Plant (ABFF) and Domtar Dryden CHP Plant (DDPP) with different levels of electrical and thermal power production capacities. The Atikokan Generating Station (AGS), another power plant in NWO, is currently being converted to use
forest biomass feedstock instead of coal. Its power generating capacity is 230 MWe, with a plan to run at
10% capacity [10]. With the development of these biomass based bioenergy plants, the entire bioenergy system in the NWO will generate major socio-environmental consequences in terms of reducing GHG emissions and stabilizing the economy of many small rural communities.
The two types of woody biomass used for this study are: FHR - forest harvest residue which includes tops and branches and wood left after stand harvesting; and UUW - un/under-utilized wood which includes un-harvested tree species that are not commercially important for timber. These biomass sources have variable costs and qualities in terms of thermal value, moisture content and ash content. A power plant manager can have various biomass quality goals as well as the cost target so that the plant can be run cost effectively. This kind of decision problem in a biomass supply chain can best be handled by using GP modeling technique. However, we found very few studies on modeling the wood biomass for bioenergy supply chains in Canada that consider multiple goals in terms of biomass qualities. Most of the existing studies focus mainly on optimizing harvesting and transportation of raw material for forest products industries from forest management units (FMUs) to the processing facilities [11, 12].
can be easily adapted to the similar cases elsewhere. Hence, the importance of this work is of global nature in the era of emerging sustainable energy development around the globe in order to mitigate the GHGs emissions.
2. Data and method 2.1 Study area and data
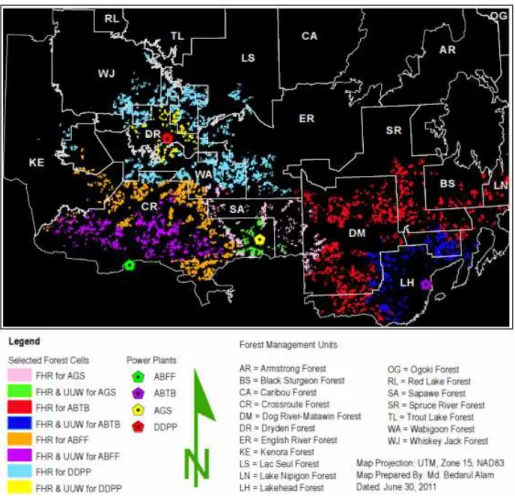
The study area consists of 18 forest management units (FMU) west of Lake Nipigon in NWO where four power plants are running with biomass as their feedstock (Figure 1). The NWO study area is 167,184
km2, with an annual average harvest of 60,867 ha (2002-2009) which is 0.61% of the productive forest
area per year. GIS data related to forest areas and depleted forest for the period 2002-2009 were collected from Land Information Ontario, Sustainable Forest Licence (SFL) holders, and consultant companies in the formats of Shapefile and Geodatabase. The entire modeling system undergoes into two steps. First a database relating to the logistics costs to transport the biomass from each forest cells to the four power plants are estimated by road network optimization model [9]. Then the database thus obtained is used in GP model to estimate the optimal costs structures for biomass supply chains for each of the power plant.
Figure 1. Map of study area (Source: [14])
In the first step, the original vector data is converted to raster and finally to spatial database text files for the entire research area using Arc GIS software. Three main spatial layers (land use, forest depletion and
cost layers) were prepared on a raster grid size of 1 km×1 km (1 km2), and this study examines 20,315
productive forest cells where the timber harvesting activities occurred from 2002 to 2009. The detailed methodology for estimating forest harvest residue and un/under-utilized biomass availability for all 20,315 forest depletion cells is described in Alam et al.[9].
Table 1. Estimates of parameters used in the model
Descriptions Unit Estimates Remarks
Harvesting and processing costs (FHR) CAD/gt 26 [15]
Harvesting and processing costs (UUW) CAD/gt 31 [15]
Fixed cost due to load/unload overhead CAD/gt 4.85 [9]
Electrical Capacity of ABTB Power plant MWe 61 Power Plant data
Thermal Capacity of ABTB Power plant MWth 16 Power Plant data
Electrical Capacity of ABFF Power plant MWe 50 Power Plant data
Thermal Capacity of ABFF Power plant MWth 61 Power Plant data
Electrical Capacity of DDPP Power plant MWe 30 Power Plant data
Thermal Capacity of DDPP Power plant MWth 37 Power Plant data
Electrical Capacity of AGS Power plant MWe 23 Power Plant data
Harvesting factor* % of BM 67 [4]
Number of forest depletion cells ** No 20,315 New estimate
Note: CAD = Canadian Dollar, BM = Biomass, gt = green tonne, yr = year *The percentage of total biomass that can be extracted from the given area **1kmX1km grid of depletion cells in harvesting sites
Descriptive statistics of biomass qualities for all 20,315 forest depletion cells, which are updated version from our previous study, are as depicted in Table 2. This helps to get the initial target levels for each of the quality goals. We select six quality characteristic related goals, namely moisture and ash contents of both forest biomass types (four goals) and thermal value of each forest biomass type (two goals) that give us a fairly good account of biomass quality information to feed into the GP model. Although estimating the values of all these parameters for the 20,315 individual forest depletion cells is a daunting task, we use [16] and Hosegood [17] to approximate the estimates of these parameters.
Table 2. Descriptive statistics of biomass quality and target levels by scenarios (n=20,315)
Moisture content FHR
(% gw basis)
Thermal value FHR (GJ/ODt)
Ash content FHR (%)
Moisture content UUW (% gw basis)
Thermal value UUW (GJ/ODt)
Ash content UUW (%)
Mean 33.48 18.92 1.59 39.89 16.99 1.87
Minimum 31.97 18.50 1.30 30.15 15.30 1.00
Maximum 39.96 20.00 3.00 55.34 18.50 2.50
Standard Deviation
2.23 0.47 0.56 9.66 1.29 0.45
Initial goals 34.00 19.00 2.00 40.00 17.00 2.00
10 % relaxation 37.40 17.10 2.20 44.00 15.30 2.20
10 % increase in efficiency
34.00 19.00 2.00 40.00 17.00 2.00
UUWAGS No FHR for AGS only, but other plants
are using it.
40.00 17.00 2.00
Note: FHR = Forest Harvest Residue, UUW = Un/under-utilized wood biomass, gw= green weight
2.2 GP model for biomass procurement
In the past, the multi-criteria decision making models, which is a common name given to all relevant models of multi-objective decision model (MODM) techniques and other related simulation models, have been applied to solve complex production and management problems in natural resources management fields including forestry [1, 18]. The goal programming model, a variant of MODM, is found to be more useful in production systems analysis because it can handle continuous problems that involve the optimisation of several simultaneous objectives. A brief sketch of GP model has been presented in [13].
positive deviations of cost and heat values of FHR and UUW for each forest depletion cell and negative deviations of moisture and ash contents of two types of biomass – FHR and UUW. The formal GP model is specified as below.
Minimize
∑
∑
∑
∑
∑
∑
= = = = = = + + + + + + = 20315 1 4 20315 1 3 20315 1 2 20315 1 1 20315 1 3 20315 1 2 1 j j j j j j j j j j j
j p n n n n
p p
Z (1)
Subject to
C
p
TC
PUC
XUNB
TC
PRC
XRES
ij iji j ij
i j
ij
+
+
∑ ∑
+
−
≤
∑ ∑
= = = =1
))
(
(
))
(
(
4 1 20315 1 4 1 20315 1 (2)XRESij*(MCRj+n1j)≤g1*XRESij (3)
XUNBij*(MCUj+n2j)≤g2*XUNBij (4)
XRESij*(AshRj+n3j)≤g3*XRESij (5)
XUNBij*(AshUj+n4j)≤g4*XUNBij (6)
XRESij*(TVRj-p2j)≥g5*XRESij (7)
XUNBij*(TVUj–p3j)≥g6*XUNBij (8)
j i ij ARES XRES ≤
∑
= 4 1 (9) j i ij AUNB XUNB ≤∑
= 4 1 (10)6
.
3
*
24
*
350
*
1000
*
i lTCAP
THE
=
(11)6
.
3
*
24
*
350
*
1000
*
i lECAP
EE
=
(12)i i i
l
THE
EE
DB
TE
=
+
=
(13)) * 2164 . 0 ( * ) * 2164 . 0 ( * 20315 1 , 20315 1 , j j j j i j j j j i
i XRES TVR MCR XUNB TVU MCU
XTB=
∑
− +∑
−= =
(14)
i i
DB
XTB
≥
(15)0
,
XUNB
and
deviations
≥
XRES
ij ij (16)where, p1, p2j and p3j are the positive deviations from the total cost target (C) thermal values target of
FHR (g5) and UUW (g6) for each forest depletion cells, respectively;
n1j, n2j and n3j and n4j are negative deviations from target/goal levels of moisture contents of FHR (g1) and
UUW (g2), and ash contents of FHR (g3) and UUW (g4) for each forest depletion cell j, respectively;
PRC is processing (harvesting and grinding/chipping) cost ($·gt-1) of FHR at roadside;
PUC is processing (harvesting and grinding/chipping) cost ($·gt-1) of UUW at roadside;
DBi is annual forest biomass demand converted to energy units (GJ) of power planti ;
ARESj is annual technical availability (gt) of FHR in forest depletion cell j;
AUNBj is annual technical availability (gt) of UUW in forest depletion cell j;
TCijis biomass transportation cost ($·gt-1) from the jth forest depletion cell to the ith power plant including
loading/unloading overhead;
XRESij is amount of annual FHR harvested (gt) from the jth forest depletion cell for the ith power plant;
XUNBij is amount of annual UUW harvested (gt) from the jth forest depletion cell for the ith power plant;
THEi and EEi are the total annual thermal and electrical energy to be produced by each plant and TCAPi
and ECAPi are the thermal and electrical capacity of each plant (cf. Table 2). We assume to run the
power plant for 350 days in a year and 24 hours a day. The value of 3.6 in eqns. (11, 12) is the amount of GJ energy in one kilo watt hour of power production. The parameter and equation to estimate the energy content of each type of biomass from each forest cells, which is a function of thermal value and the moisture contents (that vary among the biomass types in each depletion cells) are taken from [19].
In the above model specification, equations 11-14 are the engineering equations, which are new to this paper and that make the model more practical. Equations 2-8 are the goal constraint equations where the right hand side scalars are chosen as the goal or target, each representing the decision maker’s objectives
to be met with some relevant deviations by selecting the optimal choice variables XRESij and XUNBij.
The cost target is selected based on the total cost obtained from the linear programming (LP) model
without putting any goal constraints with the same technical constraints, benchmark scenario. Different
quality targets are selected based on four goal set scenarios as mentioned above. The Initial Goals scenario selects the ceiling of mean values of each of the six biomass quality characteristics as shown in Table 2. Equations (9) and (10) represent harvesting constraints, suggesting the annual harvest for each type of biomass should not exceed the available biomass in each forest depletion cell. Equation (15) constrains the total amount of energy (GJ per annum) derived from the optimal level of forest biomass
harvested for ith power plant should at least meet the energy production (GJ per annum) level of that
plant. The general algebraic modeling system (GAMS) optimization software has been used to solve this complex problem.
2.3 Model scenario
Four different model scenarios in terms of goals sets and technical efficiency are used in order to test the various situations of multiple objectives of biomass procurement decisions for the four power plants. Before running the GP models, we ran the benchmark LP model with total cost (sum of the costs for all four plants) minimization objective with usual constraints without any quality targets (no target level set on moisture contents, thermal values and ash contents). Results of the benchmark LP model gave an idea of cost goal and results for comparisons of the biomass procurement costs for different scenarios in the GP model.
The first scenario, Initial Goals, includes a goal set with biomass qualities (MC and ash contents, and
thermal values) having ceilings of mean values of the corresponding variables (Table 2). This scenario is set to establish a baseline goals relating to the quality of biomass, where the power plant manager may want to have higher quality feedstock as defined by these threshold goals/targets. This goal set will introduce constraints in the model as the biomass to be harvested should have MC and ash contents not more than the targets and the thermal value should be at least equal to the target. The second scenario
with 10% Relaxation deals with goal sets that relax target values for biomass qualities (the target values
are as shown in Table 2) from the Initial Goals scenario by 10%. These two scenarios are run to test the sensitivity of the changes in goal levels (targets) to the costs structures of biomass procurement problems, which exemplify the importance of biomass qualities in biomass supply chains for bioenergy
production. The third scenario, 10 % increase in conversion efficiency, tests the sensitivity of costs and
biomass volume to be harvested under new technological era. The fourth scenario is to use only
un/under-utilized biomass for the AGS (UUWAGS scenario) power plant as it is planning to use UUW
to produce pellets for power production in the future. Due to strict ash content requirements (<1% ash) of high quality pellets, only un/under-utilized biomass can be used for this purpose as logging residues would result in excessive bark and thus more ash content. In the last two scenarios, other quality goals
remain same as in the Initial Goals scenario.
3. Results and discussion
procurement cost (cf. Table 3).On the other hand, Abitibi Bowater Thunder Bay CHP plant is located in the southeastern part of research area, where there is no competing power plant on its northern, eastern and southern sides in the research area. The other two power plants (ABFF and AGS) need to compete more for the forest biomass as they are located close to each other in the research area (Figure 1). Here the biomass procurement costs per gt depend on two factors, namely, location and competition as per the total volume requirements for each nearby power plants. A final note on the results of both the LP and GP models with various scenarios - this modeling approach gives the optimal network of selected forest cells to harvest both FHR and UUW biomass to meet the biomass requirements for the four power plants.
Figure 2. Optimal harvest of FHR and UUW biomass for four power plants with benchmark LP model
The models choose the most efficient forest cells out of 20,315 cells to meet the demands for all the four plants developing different networks of distribution of forest harvest cells along with the volume harvested for each scenario. We have developed a map producing application in Visual Basic, which takes the optimal cells generated by either LP or GP model as an input, and produce the visual map as shown in Figure 2. These results are very important in developing a decision support system for biomass supply chain for bioenergy productions anywhere in the world, where the similar datasets are available. Table 3 presents the average cost estimates of per green tonne harvestin relation to various goals set and technical efficiency increase scenarios by power plants. While comparing the per gt cost in each scenario with respect to the benchmark results, we can see that per unit costs have increased significantly as we are looking for high quality biomass, thus end up paying higher per unit prices. However, the per gt costs have decreased in 10% relaxation scenario (column 3, Table 3) when compared with the Initial Goals scenario (column 3, Table 3) as this scenario allows relatively lower quality biomass than the Initial goals scenario. We can also observe that DDPP being suitably located around the dense forest areas with no nearby competing power plant has the lowest per gt cost in all scenarios. On the other hand, AGS power plant which has the lowest total volume of biomass requirement has the second least cost option to produce bioenergy, except in the UUWAGS scenario.
hardwood biomass for better quality pellet production in this case. Thus, Atikokan plant has to pay more per gt, while at the same time other competing plants have an option to grab the low cost FHR biomass previously used by AGS, thereby reducing their unit procurement costs (compare the costs with Initial Goals scenario in Table 3). These results can be useful for power plant managers to evaluate the effect of trade-offs between qualities and the costs, as well as the impacts on costs of the strategy of other competing plants. The 10% increase in conversion efficiency scenario shows the lower per gt cost as compared to the Initial goals scenario. The modeling approach developed for this study can accommodate other relevant goals or technical scenarios as well as need be to analyze the sensitivity of changing parameters on the procurement costs and forest cells network as shown in Figure 2.
Table 3. Biomass procurement costs in each scenario by power plants (CAD/gt)
Power plants
Benchmark Initial
Goals
10% Relaxation
10% increase in efficiency
UUWAGS
ABTB 38.11 41.16 38.41 40.85 41.15
ABFF 38.77 40.21 38.99 39.88 39.99
DDPP 35.74 37.57 36.00 37.34 37.54
AGS 36.13 37.46 35.96 37.21 39.11
The more important results of this improved modelling work can be observed while looking at the total volume and thereby total costs required to produce the same amount of bioenergy as discussed in our previous paper [13]. The total cost estimates are not presented here as it is obvious from the total biomass volume, which is directly proportional to the costs. Once engineering equations are introduced in the model, and with the introduction of goals constraints in the biomass qualities, we require the less total volume of biomass to produce the same amount of bioeenrgy. Table 4 summarizes the results in terms of total biomass volume required in each scenario for each power plant. We can see the drastic reduction of volume of biomass with respect to the benchmark LP scenario as we are using higher quality biomass in our GP model scenarios. The figures in the parentheses in Table 4 show the percentage reduction of total biomass requirement from the benchmark case for each power plant by model scenarios. These are important results of this study while compared with the results of [13] where total biomass volumes were kept constant for each power plant in all the model scenarios. The most drastic reduction of total biomass requirement is found in the technological improvement scenario, where about 33% reduction is observed. In rest of the scenarios, we can observe the reduction in biomass harvest in the range of 25%-27% with respect to the benchmark case.
Table 4. Total volume of biomass procurement in each scenario by power plants (gt/yr)
Power plants
Benchmark Initial
Goals
10% Relaxation
10% increase in efficiency
UUWAGS
ABTB 730,000 536,642 (-26.49)
541,051 (-25.88)
487,026 (-33.28)
536,404 (-26.52) ABFF 800,000 586,713
(-26.66)
589,268 (-26.34)
532,440 (-33.45)
584,889 (-26.89) DDPP 480,000 351,669
(-26.74)
355,162 (-26.01)
319,276 (-33.48)
351,548 (-26.76) AGS 200,000 147,163
(-26.42)
148,204 (-25.90)
133,653 (-33.17)
149,361 (-25.32)
There are many important ongoing discussions about increasing the share of renewable energy into the entire energy portfolio due to various sustainability implications in the recent past. Lund [3] brings three aspects of sustainable energy development strategy, namely, energy saving on the demand side, efficiency improvements in the supply side, and replacement of fossil-based fuels by renewable energies. Our findings can shed light on the energy efficiency scenario, and how cost-effectively renewables with biomass sources can be produced in order to fulfill the rural energy demands. This study further aids in the literature of biomass supply chain modelling with multi criteria decision-making approach by explicitly capturing the effects of biomass qualities as goals sets on the procurement costs for multiple power plants in NWO region of Ontario. This differs with the past studies in this area with similar paradigm [8, 11, 12]. Regarding technological development, we would expect an improved efficiency of CHP and power only plants with the use of higher quality biomass (as discussed in this study) in the future [20]. The trade-off between increase in conversion efficiency and the supply chain costs can be modeled by using this approach.
4. Summary and conclusions
Biomass procurement problems for four bio-energy power plants in NWO have been modelled using GP method with engineering equations and improved dataset. The approach taken in this study can greatly help in day to day operational planning problems of biomass supply chain management for bioenergy production in general. The biomass currently utilized is mainly mill and logging residues, but in future there will be a need to utilize under-utilized species and un-merchantable standing trees to meet the growing demands for biomass. All of the biomass sources have variable costs and qualities, and potential impact on other wood users (e.g., utilizing standing trees for energy would compete with other users). In this study, six quality characteristics goals, namely moisture and ash contents and thermal values of both forest biomass types are taken into account, which give a fairly good account of biomass quality information to feed into the GP model. After establishing the cost and physical quality goals characteristics we ran four different scenarios with different sets of quality goals and technological improvement situation in order to analyze the sensitivity of these scenarios on the procurement costs. The results are contrasted with the benchmark LP model, which give very good policy and operational indications for biomass supply chain management on part of the bioenergy producers.
This work represents an extension and improvement upon Upadhyay et al. [13]that helps us to find the practical real time solutions for impacts of higher quality biomass goals and potential improvement in technology on biomass procurement cost structures both in terms of per gt and total volume by model scenarios. It is found that total wood biomass harvested is reduced significantly in the bioenergy supply chains, even though the delivered per unit costs are higher. The trade-off between quality and cost has been demonstrated in this modeling effort, where the total biomass demand for each power plant has been endogenized through engineering process equations. The impacts of changing goals are found to be inter-dependent between plants; changing a goal in one plant affects costs at other plants
Conflict of interests disclosure
The authors declare that there is no conflict of interests regarding the publication of this article.
References
[1] Upadhyay, T.P., B. Solberg, and P.L. Sankhayan, Use of models to analyse land-use changes,
forest/soil degradation and carbon sequestration with special reference to Himalayan region: A review and analysis. Forest Policy and Economics, 2006.9: p. 349-371.
[2] IPCC, Climate Change 2007: Mitigation. Contribution of Working Group III to the Fourth
Assessment Report of the Intergovernmental Panel on Climate Change [B. Metz, O.R. Davidson, P.R. Bosch, R. Dave, L.A. Meyer (eds)], 2007.Cambridge University Press, Cambridge, United Kingdom and New York, NY, USA., XXX pp.
[3] Lund, H., Renewable energy strategies for sustainable development. Energy, 2007. 32: p. 912-919.
[4] Gan, J., and C.T. Smith, Availability of logging residues and potential for electricity production
and carbon displacement in the USA. Biomass and Bioenergy, 2006.30: p. 1011-1020.
[5] Ballarin, A., D. Vecchiato, T. Tempesta, F. Marangon, and T. Troiano, Biomass energy production
in agriculture: A weighted goal programming analysis. Energy Policy, 2011.39: p. 1123-1131.
[6] Rauch, P., and M. Gronalt, The Terminal Location Problem in the Forest Fuels Supply Network.
[7] Tahvanainen, T., and A. Perttu, Supply chain cost analysis of long-distance transportation of energy wood in Finland. Biomass and Bioenergy, 2011. 35: p. 3360-3375.
[8] Tenerelli, P., and S. Carver, Multi-criteria, multi-objective and uncertainty analysis for
agro-energy spatial modeling. Applied Geography, 2012. 32: p. 724-736.
[9] Alam, M.B., R. Pulkki and C. Shahi, Road network optimization model for supplying wood
biomass feedstock for energy production in northwestern Ontario. The open forest science Journal, 2012. 5:p. 1-14
[10] Ontario Power Generation Inc. (OPG), Atikokan Generation Station Biomass Repowering Project.
Ontario Power Generation Inc.). 2010.
http://www.opg.com/power/thermal/
AtikokanFactSheet1009.pdf
, [Accessed May 25, 2013].[11] Pulkki, R. Role of supply chain management in the wise use of wood resources, Southern African
Journal, 2001.191:p. 89-95.
[12] Chauhan, S.S., J.M. Frayret, and L. LeBel, Multi-commodity supply network planning in the forest
supply chain. European Journal of Operational Research, 2009. 96: p. 688–696.
[13] Upadhyay, T.P., M.B. Alam, R. Pulkki, C. Shahi and M. Leitch, Integrating goal programming in
biomass procurement for bio-energy value chains J-FOR, 2011. vol. 1, no. 2, pp. 45–53.
[14] Ontario Ministry of Natural Resources (OMNR). Map of Ministry office locations.
http://www.mnr.gov.on.ca/en/ContactUs/1ColumnSubPage/STEL02_179001.html
, 2014. [Accessed May 25, 2014].[15] Ontario Ministry of Energy (OME). An Assessment of the Viability of Exploiting Bio-Energy
Resources Accessible to the Atikokan Generating Station in Northwestern Ontario. 2006.A consultancy report prepared by Forest BioProducts Inc. Sault Ste. Marie, Ontario, Canada.
[16] Gautam, S., Assessment of Fuel Quality Changes during Storage of Biofibre and Its Effect on
Cost. M.Sc. Thesis, 2010. Lakehead University, Thunder Bay, Ontario.
[17] Hosegood, S. Fuel Characteristics of Seven Northwestern Ontario Tree Species. M. Sc. Thesis,
2010.Lakehead University, Thunder Bay, Ontario.
[18] Romero, C., and T. Rehman, Multiple Criteria Analysis for Agricultural Decisions. 1989.
Amsterdam: Elsevier.
[19] Woodenergy.net.
http://www.woodenergy.ie/frequentlyaskedquestions/
, 2013.[Accessed May27, 2013].
[20] U. S. Environmental Protection Agency (EPA). Biomass Combined Heat and Power Catalog of
Technologies (
www.epa.gov/chp
). 2007.USA.T.P. Upadhyay has obtained his Ph.D. degree in resource and environmental economics in 2007.He is
currently working as an Associated Professor at School of Business and Economics, University of Tromsø- The Arctic University of Norway. He has extensive work experience from Canada, Nepal, Norway and the USAin the field of economic modelling for natural resources management. Dr. Upadhyay has published various research papers relating to economics of natural resources management and value chain optimization. His main research interest is to apply the dynamic optimization tools for sustainable use of natural resources.
E-mail address: thakur.upadhyay@uit.no
J. H. Greibrokk has obtained his Master’s degree in resource and environmental economics from
University of Oslo in 1996. He has also taken Ph.D. course in environmental economics from Norwegian University of Science and Technology. He is currently working as a Head of Department and as an assistant Professor at School of Business and Economics, Campus Alta, UiT – the Arctic University of Norway. He has published, among others, in the field of endogenous forces and credit cycles and risk and incentives in the housing market. His main research interests are environmental issues and sustainability, and the housing market. He has been active in the entrepreneurial education for students, which is inspired by his personal experience as an entrepreneur.
![Figure 1. Map of study area (Source: [14])](https://thumb-eu.123doks.com/thumbv2/123dok_br/17063138.234949/3.892.206.689.401.949/figure-map-study-area-source.webp)