EUROPEAN ECONOMY VS THE TRAP OF THE
EUROPE 2020 STRATEGY
Romeo-Victor IONESCU*
Abstract: The paper deals to the analysis of Europe 2020 Strategy goals’ viability under the new global socio-economic context. These goals are analyzed using comparative analysis, regression and a cluster approach. A distinct part of the analysis is focused on forecasting procedures. The first conclusion of the paper is that the disparities between Member States are too high to allow achieving the Strategy’s goals until 2020. Moreover, these disparities will maintain or will increase in 2020. A t least two clusters can be built using the Member States’ performances. The whole analysis and its conclusions are supported by the latest official statistic data, pertinent tables and diagrams.
Keywords: economic disparities; economic clusters; employment rate; expenditure in R&D; greenhouse gas emissions; tertiary educational attainment; poverty risk; economic forecasting
Introduction
European Union was built as a huge socio-economic and political regional project able to put the organization as main global actor. The positive economic results were not followed by a political consensus regarding a European Constitution. On the other hand, the economic potential advantages continued to attract new states to adhere to the EU. Unfortunately, the adhering economic criteria were replaced by political and strategic interests and some economies faced to great problems in order to achieve the EU average economic development. This is why only Croatia adhered to the EU in the latest seven years. In order to reinforce the social and economic cohesion across the Member States, Europe 2020 Strategy was implemented. This strategy covers concrete targets related to employment, investment in R&D, environment protection, education and poverty (European Commission, 2010, p.3).
The success of the Strategy’s implementation will represent argue to enlargement. But a possible failure of the Strategy will bring a lot of problems related to the organization’s viability.
The paper realizes a complex analysis of the EU’s socio-economic performances in the context of the Strategy’s targets. Moreover, a distinct part of
*
the paper deals to forecasting procedures in order to demonstrate the ability of the Member States to achieve the Strategy’s targets in 2020.
1. Literature review
There are a lot of new scientific researches focused on Europe 2020 Strategy’s goals. Some specialists analyzed the positive impact of the labor mobility on employment across the Europe. The analysis is realized on two levels: national and sub-national, in order to highlight the determinants of mobility flows. A distinct part of the analysis is focused on studying the dynamic response of labor mobility to the asymmetric demand shocks, using a vector auto regression (VAR) analysis. The main conclusion of the analysis is that the EU labor increased mobility significantly. This process was not the same for all Member States. As a result, the employment and unemployment rates are different. On the other hand, labor mobility is able to absorb 25% of the shock within 1 year and about 60% after 10 years (Arpaia et al., 2014).
Kiss at al. (2014) studied employment trying to find the answer to the question regarding the present unemployment type. The analysis covers the European labor market after the global crisis’ impact. The intermediate conclusion of the paper is that unemployment is cyclical or structural in different Member States and it influences the employment dimension and structure. The second intermediate conclusion is that the European labor market deteriorated after the crisis and this process supported heterogeneity across the EU countries. The solution proposed by the authors is implementing of active labor market policies together with increasing macroeconomic efficiency.
Turrini at al. (2014) moved the employment analysis in connection to the labor market reforms. They were focused on the EU labor market reforms during 2000-2011, using the LABREF database developed in DG ECFIN of the European Commission. According to this analysis, 2008 was the moment when the macroeconomic policies increased. These policies were focused on employment protection legislation, unemployment benefits and wage setting and tried to implement economic reform. The results of these reforms varied across the EU. The authors used econometric approach in order to quantify them.
R&D development represents another goal of Europe 2020 Strategy. Some papers proposed better cooperation in R&D activities under specific networks. Bernard at al. (2007), for example, used a binary choice model in order to highlight the existence of network and spatial effects alongside other microeconomic determinants of cooperation. The analysis tried to compare the social distance to spatial (geographical) distance and to highlight their impact on R&D cooperation. The main conclusion of the analysis was that the social distance had more importance than the geographical distance in building such R&D networks.
specialists saw the change in EU R&D policy as a complex consensus-building process. Moreover, they proposed a R&D policy in a multi-level governance system (Edler et al., 2003).
A distinct analysis was made in order to connect R&D activities to European Funds. Paiera and Scherngella (2011), for example, analyzed the joint research projects funded within the European Framework Programmes for Research and Technological Development (EU-FPs). Their analysis was based on a discrete choice model, which was able to quantify data on EU-FP projects from the EUPRO. Moreover, they realized a representative survey of participants. The main conclusion of the analysis was that R&D cooperation across the EU is facilitated by prior acquaintance, thematic proximity and geographical proximity. On the other hand, the impact of the geographical effects increases for more intensive collaboration in R&D activities.
The environment protection represents another target of Europe 2020 Strategy. The Strategy is focused especially on the air pollution. As a result, the European Environment Agency (2014) realized a research related to the air pollution from EU industry. According to this analysis, the aggregate damage cost by pollutants achieved 189 billion Euros in 2012 (at 2005 prices). It decreased from 251 billion Euros in 2009 (EEA, 2014, p.53). The thematic strategy on air pollution was analyzed in the latest EEA Report (2014), in order to highlight the policy responses at national, regional and local levels in Member States. The radiography of the sources and emissions of air pollutants was followed by a description of the adverse effects of the air pollution on the human wealth. Finally, the analysis was focused on the air pollution effects on the climate change.
Europe 2020 Strategy highlights as an important target the education support for the sustainable development. This action will follow the Strategy for Education for Sustainable Development adopted in 2005, by incorporating the education strategy into formal, non-formal, and informal education. The Strategy for Education for Sustainable Development was updated in 2009, in order to promote the behavioral changes and citizens with the key competences needed to achieve sustainable development (AEGEE Europe, 2013).
Even Europe 2020 Strategy document stipulates the challenges for the Member States which have a direct impact on the ability of higher education systems: broadening access to higher education, reducing drop-out rates and the time it takes to complete a degree and improving the quality of higher education and making it more relevant (p.3). The last goal of the Europe 2020 Strategy is focused on poverty and social exclusion. Lelkes and Zolyomi (2011) analyzed the poverty risk rates and the social exclusion during 2004-2007. Moreover, they found a direct connection between the measures of poverty, deprivation and low work intensity.
2. Socio-economic analysis under Europe 2020 Strategy’s goals
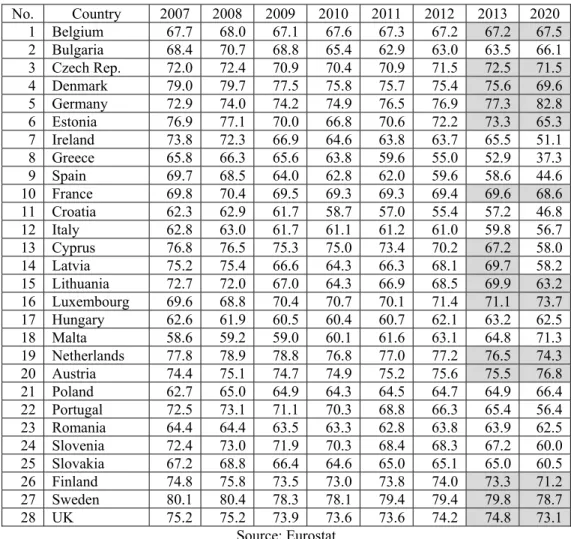
According to Europe 2020 Strategy, 75% of the 20-64 year-olds has to be employed until 2020. Some Member States (Bulgaria, Denmark, Germany, Estonia, Netherlands, Austria, Finland and Sweden) established higher rates, while other Member States (Belgium, Ireland, Greece, Spain, Croatia, Italy, Latvia, Lithuania, Luxembourg, Malta, Poland, Romania and Slovakia) fixed lower targets. On the other hand, there are great disparities across the EU28 related to this indicator. This observation is supported by the latest official statistical data (see Table 1).
Table 1 – Employment rate (%)
No. Country 2007 2008 2009 2010 2011 2012 2013 2020 1 Belgium 67.7 68.0 67.1 67.6 67.3 67.2 67.2 67.5 2 Bulgaria 68.4 70.7 68.8 65.4 62.9 63.0 63.5 66.1 3 Czech Rep. 72.0 72.4 70.9 70.4 70.9 71.5 72.5 71.5 4 Denmark 79.0 79.7 77.5 75.8 75.7 75.4 75.6 69.6 5 Germany 72.9 74.0 74.2 74.9 76.5 76.9 77.3 82.8 6 Estonia 76.9 77.1 70.0 66.8 70.6 72.2 73.3 65.3
7 Ireland 73.8 72.3 66.9 64.6 63.8 63.7 65.5 51.1
8 Greece 65.8 66.3 65.6 63.8 59.6 55.0 52.9 37.3
9 Spain 69.7 68.5 64.0 62.8 62.0 59.6 58.6 44.6
10 France 69.8 70.4 69.5 69.3 69.3 69.4 69.6 68.6
11 Croatia 62.3 62.9 61.7 58.7 57.0 55.4 57.2 46.8
12 Italy 62.8 63.0 61.7 61.1 61.2 61.0 59.8 56.7
13 Cyprus 76.8 76.5 75.3 75.0 73.4 70.2 67.2 58.0
14 Latvia 75.2 75.4 66.6 64.3 66.3 68.1 69.7 58.2
15 Lithuania 72.7 72.0 67.0 64.3 66.9 68.5 69.9 63.2 16 Luxembourg 69.6 68.8 70.4 70.7 70.1 71.4 71.1 73.7
17 Hungary 62.6 61.9 60.5 60.4 60.7 62.1 63.2 62.5
18 Malta 58.6 59.2 59.0 60.1 61.6 63.1 64.8 71.3
19 Netherlands 77.8 78.9 78.8 76.8 77.0 77.2 76.5 74.3 20 Austria 74.4 75.1 74.7 74.9 75.2 75.6 75.5 76.8
21 Poland 62.7 65.0 64.9 64.3 64.5 64.7 64.9 66.4
22 Portugal 72.5 73.1 71.1 70.3 68.8 66.3 65.4 56.4
23 Romania 64.4 64.4 63.5 63.3 62.8 63.8 63.9 62.5
24 Slovenia 72.4 73.0 71.9 70.3 68.4 68.3 67.2 60.0 25 Slovakia 67.2 68.8 66.4 64.6 65.0 65.1 65.0 60.5 26 Finland 74.8 75.8 73.5 73.0 73.8 74.0 73.3 71.2 27 Sweden 80.1 80.4 78.3 78.1 79.4 79.4 79.8 78.7
28 UK 75.2 75.2 73.9 73.6 73.6 74.2 74.8 73.1
Source: Eurostat
In order to simplify the analysis, the Member States were divided into two clusters, as in Table 1. The first cluster covers: Belgium, Czech Republic, Denmark, Germany, Estonia, France, Cyprus, Latvia, Lithuania, Luxembourg, Netherlands, Austria, Finland, Sweden and UK, while the second cluster is formed from: Bulgaria, Ireland, Greece, Spain, Croatia, Italy, Hungary, Malta, Poland, Portugal, Romania, Slovenia and Slovakia. The viability of this approach is supported by Figure 2, where the cluster quality is good enough (0.7).
Figure 1. Employment rate under cluster analysis
Source: personal contribution using IBM-SPSS software
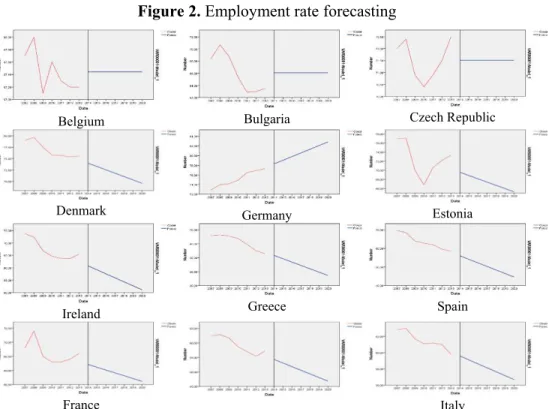
The real challenge for the analysis is to demonstrate if the Member States will be able to achieve the Europe 2020 Strategy’s target of 75% in 2020. The individual performances for each Member States are presented in Figure 2.
Figure 2. Employment rate forecasting
Belgium Bulgaria Czech Republic
Denmark Germany Estonia
Ireland Greece Spain
Croatia
Cyprus Latvia Lithuania
Luxembourg Hungary Malta
Netherlands Austria Poland
Portugal Romania Slovenia
Slovakia Finland Sweden
UK
Source: personal contribution using IBM-SPSS software
According to Figure 2, the Europe 2020 Strategy’s goal for employment will not be achie ved by many Member States. Moreover, the disparities regarding employment between the Member States will increase in 2020 compared to 2013. The relative disparity will increase from 1:1.51 in 2013, to 1: 2.11 in 2020. On the other hand, the cluster approach for 2013 can be used in 2020.
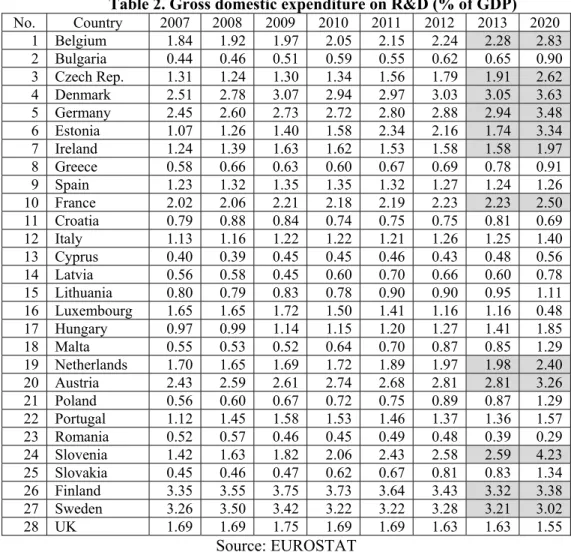
other hand, the latest official data highlight low performances regarding the investment in R&D (see Table 2).
Table 2. Gross domestic expenditure on R&D (% of GDP)
No. Country 2007 2008 2009 2010 2011 2012 2013 2020 1 Belgium 1.84 1.92 1.97 2.05 2.15 2.24 2.28 2.83 2 Bulgaria 0.44 0.46 0.51 0.59 0.55 0.62 0.65 0.90 3 Czech Rep. 1.31 1.24 1.30 1.34 1.56 1.79 1.91 2.62 4 Denmark 2.51 2.78 3.07 2.94 2.97 3.03 3.05 3.63 5 Germany 2.45 2.60 2.73 2.72 2.80 2.88 2.94 3.48 6 Estonia 1.07 1.26 1.40 1.58 2.34 2.16 1.74 3.34 7 Ireland 1.24 1.39 1.63 1.62 1.53 1.58 1.58 1.97 8 Greece 0.58 0.66 0.63 0.60 0.67 0.69 0.78 0.91
9 Spain 1.23 1.32 1.35 1.35 1.32 1.27 1.24 1.26
10 France 2.02 2.06 2.21 2.18 2.19 2.23 2.23 2.50 11 Croatia 0.79 0.88 0.84 0.74 0.75 0.75 0.81 0.69
12 Italy 1.13 1.16 1.22 1.22 1.21 1.26 1.25 1.40
13 Cyprus 0.40 0.39 0.45 0.45 0.46 0.43 0.48 0.56
14 Latvia 0.56 0.58 0.45 0.60 0.70 0.66 0.60 0.78
15 Lithuania 0.80 0.79 0.83 0.78 0.90 0.90 0.95 1.11 16 Luxembourg 1.65 1.65 1.72 1.50 1.41 1.16 1.16 0.48 17 Hungary 0.97 0.99 1.14 1.15 1.20 1.27 1.41 1.85
18 Malta 0.55 0.53 0.52 0.64 0.70 0.87 0.85 1.29
19 Netherlands 1.70 1.65 1.69 1.72 1.89 1.97 1.98 2.40 20 Austria 2.43 2.59 2.61 2.74 2.68 2.81 2.81 3.26
21 Poland 0.56 0.60 0.67 0.72 0.75 0.89 0.87 1.29
22 Portugal 1.12 1.45 1.58 1.53 1.46 1.37 1.36 1.57 23 Romania 0.52 0.57 0.46 0.45 0.49 0.48 0.39 0.29 24 Slovenia 1.42 1.63 1.82 2.06 2.43 2.58 2.59 4.23 25 Slovakia 0.45 0.46 0.47 0.62 0.67 0.81 0.83 1.34 26 Finland 3.35 3.55 3.75 3.73 3.64 3.43 3.32 3.38 27 Sweden 3.26 3.50 3.42 3.22 3.22 3.28 3.21 3.02
28 UK 1.69 1.69 1.75 1.69 1.69 1.63 1.63 1.55
Source: EUROSTAT
Figure 3. Investment in R&D under cluster analysis
Source: personal contribution using IBM-SPSS software
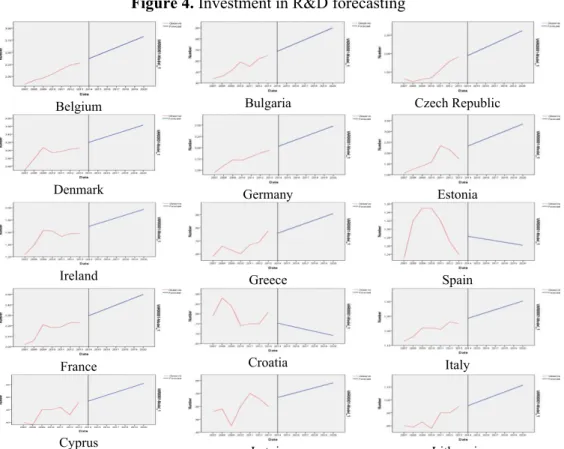
The cluster quality of 0.7 is good enough. The trend of the investment in R&D is presented in Figure 4. According to this figure, only seven Member States will be able to achieve 3.0% of GDP for investment in R&D in 2020. As a result, the Europe 2020 Strategy’s target is unrealistic.
Figure 4. Investment in R&D forecasting
Belgium Bulgaria Czech Republic
Denmark Germany Estonia
Ireland Greece Spain
France Croatia Italy
Cyprus
Luxembourg Hungary Malta
Netherlands Austria Poland
Portugal Romania Slovenia
Slovakia Finland Sweden
UK
Source: personal contribution using IBM-SPSS software
Europe 2020 Strategy proposed to reduce greenhouse gas emissions by at least 20% compared to 1990 levels or by 30% if the conditions are right, increase the share of renewable energy in final energy consumption to 20%, and achieve a 20% increase in energy efficiency. The greenhouse gas emissions decreased across the EU, but not enough (see Table 3)
Table 3. Greenhouse gas emissions (1990=100%)
No. Country 2007 2008 2009 2010 2011 2012 2013 2020 15 Lithuania 53.58 51.23 41.82 43.29 44.48 44.41 44.41 32.43 16 Luxembourg 102.84 101.61 97.40 101.86 100.42 97.48 97.48 92.26 17 Hungary 77.87 75.58 68.99 69.66 68.03 63.70 63.70 45.64 18 Malta 153.91 152.50 148.88 150.50 152.54 156.90 156.90 160.80 19 Netherlands 99.49 99.13 96.22 101.43 94.98 93.26 93.26 85.51 20 Austria 112.89 112.79 103.90 110.00 107.56 104.02 104.02 93.42 21 Poland 89.24 87.29 83.32 87.57 87.19 85.85 85.85 83.34 22 Portugal 133.04 129.59 124.10 117.70 115.74 114.87 114.87 88.45 23 Romania 57.64 56.46 48.44 46.81 49.08 47.96 47.96 39.41 24 Slovenia 112.29 116.20 105.18 105.37 105.62 102.62 102.62 87.23 25 Slovakia 66.19 67.04 61.13 62.06 61.13 58.40 58.40 47.53 26 Finland 112.02 100.83 94.74 106.62 96.49 88.13 88.13 64.09 27 Sweden 91.07 88.43 82.64 90.74 85.13 80.73 80.73 69.95 28 UK 88.22 85.70 78.73 80.55 75.33 77.50 77.50 61.95
Source: Eurostat
It is very difficult to quantify the real decrease in greenhouse gas emissions, because some Member States faced to recession, especially during 2008-2010. As a result, some decrease in greenhouse gas emissions is the result of economic contraction, not of environment policies’ implementation. The disparities related to this indicator are presented in Figure 11 e. According to this figure, one cluster covers: Belgium, Ireland, Greece, Spain, France, Italy, Cyprus, Luxembourg, Malta, Netherlands, Austria, Poland, Portugal, Slovenia and Finland. The Member States from the other cluster achieved lower emission rates.
The cluster approach is supported by Figure 5. The average cluster quality value of 0.7 is good enough to sustain the initial two clusters assumption.
Figure 5. Greenhouse gas emissions under cluster analysis
Source: personal contribution using IBM-SPSS software
Figure 6. Greenhouse gas emissions forecasting
Belgium Bulgaria Czech Republic
Denmark Germany Estonia
Ireland Greece Spain
France Croatia Italy
Cyprus Latvia Lithuania
Luxembourg Hungary Malta
Netherlands Austria Poland
Portugal Romania Slovenia
Slovakia Finland Sweden
UK
No all Member States will be able to decrease the greenhouse gas emissions at 80% compared to 1990. On the other hand, forecasted economic low development can lead to wrong conclusions related to this process.
Another goal of the Strategy is to reduce the share of early school leavers to 10% from the current 15% and to increase the share of the population aged 30–34 having completed tertiary from 31% to at least 40% until 2020. The analysis in this paper focused on tertiary educational attainment, which had a positive trend during the latest years (see Table 4).
Table 4. Tertiary educational attainment (%)
No. Country 2007 2008 2009 2010 2011 2012 2013 2020 1 Belgium 41.5 42.9 42.0 44.4 42.6 43.9 42.7 45.0 2 Bulgaria 26.0 27.1 27.9 27.7 27.3 26.9 29.4 30.8 3 Czech Rep. 13.3 15.4 17.5 20.4 23.7 25.6 26.7 44.2 4 Denmark 38.1 39.2 40.7 41.2 41.2 43.0 43.4 49.5 5 Germany 26.5 27.7 29.4 29.8 30.7 32.0 33.1 40.5 6 Estonia 33.5 34.4 36.3 40.2 40.2 39.5 43.7 54.2 7 Ireland 43.3 46.1 48.9 50.1 49.7 51.1 52.6 62.6
8 Greece 26.3 25.7 26.6 28.6 29.1 31.2 34.9 42.9
9 Spain 40.9 41.3 40.7 42.0 41.9 41.5 42.3 43.6
10 France 41.4 41.2 43.2 43.4 43.3 43.5 44.1 47.4 11 Croatia 16.7 18.5 20.6 24.3 24.5 23.7 25.6 36.6
12 Italy 18.6 19.2 19.0 19.8 20.3 21.7 22.4 26.5
13 Cyprus 46.2 47.1 45.0 45.3 46.2 49.9 47.8 50.9 14 Latvia 25.7 26.3 30.5 32.6 35.9 37.2 40.7 58.5 15 Lithuania 36.4 39.9 40.4 43.8 45.7 48.6 51.3 67.8 16 Luxembourg 35.3 39.8 46.6 46.1 48.2 49.6 52.5 71.4 17 Hungary 20.1 22.4 23.9 25.7 28.1 29.9 31.9 45.5
18 Malta 20.8 21.0 21.9 20.6 23.4 24.9 26.0 31.5
19 Netherlands 36.4 40.2 40.5 41.4 41.1 42.2 43.1 49.5 20 Austria 21.1 22.2 23.5 23.5 23.8 26.3 27.3 33.6 21 Poland 27.0 29.7 32.8 34.8 36.5 39.1 40.5 56.8 22 Portugal 19.5 21.6 21.3 24.0 26.7 27.8 30.0 42.0 23 Romania 13.9 16.0 16.8 18.1 20.4 21.8 22.8 33.5 24 Slovenia 31.0 30.9 31.6 34.8 37.9 39.2 40.1 53.0 25 Slovakia 14.8 15.8 17.6 22.1 23.2 23.7 26.9 41.2 26 Finland 47.3 45.7 45.9 45.7 46.0 45.8 45.1 43.7 27 Sweden 41.0 42.0 43.9 45.3 46.8 47.9 48.3 58.1
28 UK 38.5 39.7 41.5 43.0 45.8 47.1 47.6 59.9
Source: Eurostat
Netherlands, Poland, Slovenia, Finland, Sweden and UK. The second cluster is formed from the Member States which will face to lower tertiary educational attainment rates in 2020.
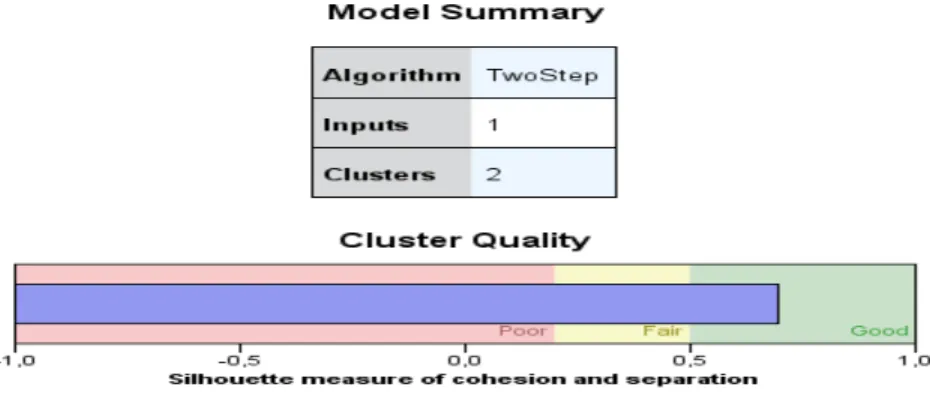
Figure 7. Tertiary educational attainment under cluster analysis
Source: personal contribution using IBM-SPSS software
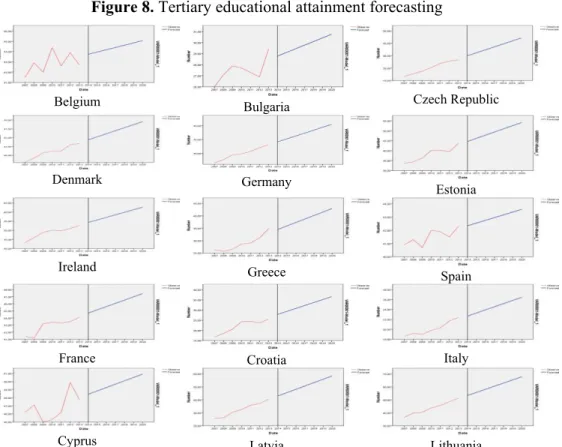
The cluster approach is based on good cluster quality (0.8) in Figure 7. The tertiary educational attainment rates in 2020 are presented in Figure 8.
Figure 8. Tertiary educational attainment forecasting
Belgium Bulgaria Czech Republic
Denmark Germany
Estonia
Ireland Greece
Spain
France Croatia Italy
Luxembourg Hungary Malta
Netherlands Austria Poland
Portugal Romania Slovenia
Slovakia Finland Sweden
UK
Source: personal contribution using IBM-SPSS software
All Member States will succeed in achieving higher educational rates in 2020 compared to 2013. Some Member States will be not able to achieve the Strategy goal of 40%.
People at risk of poverty or social exclusion represent the last goal of the Europe 2020 Strategy. This is why the Strategy asks to reduce the number of Europeans living below national poverty lines by 25%, lifting 20 million people out of poverty. In order to study this phenomenon, the analysis in the paper focused on people at risk of poverty or social exclusion as percentage of total population. The evolution of this indicator during 2008-2013 is presented in Table 5.
Table 5. People at risk of poverty (% of total population)
No. Country 2007 2008 2009 2010 2011 2012 2013 2020 1 Belgium 21.6 20.8 20.2 20.8 21.0 21.6 20.8 20.9 2 Bulgaria 60.7 44.8 46.2 49.2 49.1 49.3 48.0 40.3 3 Czech Rep. 15.8 15.3 14.0 14.4 15.3 15.4 14.6 14.2 4 Denmark 16.8 16.3 17.6 18.3 18.9 19.0 18.9 22.6 5 Germany 20.6 20.1 20.0 19.7 19.9 19.6 20.3 19.3 6 Estonia 22.0 21.8 23.4 21.7 23.1 23.4 23.5 25.3 7 Ireland 23.1 23.7 25.7 27.3 29.4 30.0 30.0 40.2 8 Greece 28.3 28.1 27.6 27.7 31.0 34.6 35.7 44.2 9 Spain 23.3 24.5 24.5 26.7 27.7 28.2 27.3 34.1
10 France 19.0 18.5 18.5 19.2 19.3 19.1 18.1 18.6
No. Country 2007 2008 2009 2010 2011 2012 2013 2020 12 Italy 26.0 25.3 24.7 24.5 28.2 29.9 28.4 33.8 13 Cyprus 25.2 23.3 23.5 24.6 24.6 27.1 27.8 31.0 14 Latvia 35.1 34.2 37.9 38.2 40.1 36.2 35.1 38.9 15 Lithuania 28.7 27.6 29.6 34.0 33.1 32.5 30.8 37.9 16 Luxembourg 15.9 15.5 17.8 17.1 16.8 18.4 19.0 22.2 17 Hungary 29.4 28.2 29.6 29.9 31.0 32.4 33.5 38.5 18 Malta 19.7 20.1 20.3 21.2 22.1 23.1 24.0 28.9 19 Netherlands 15.7 14.9 15.1 15.1 15.7 15.0 15.9 15.8 20 Austria 16.7 20.6 19.1 18.9 19.2 18.5 18.8 19.6
21 Poland 34.4 30.5 27.8 27.8 27.2 26.7 25.8 16.5
22 Portugal 25.0 26.0 24.9 25.3 24.4 25.3 27.4 27.3 23 Romania 45.9 44.2 43.1 41.4 40.3 41.7 40.4 33.7 24 Slovenia 17.1 18.5 17.1 18.3 19.3 19.6 20.4 23.7 25 Slovakia 21.3 20.6 19.6 20.6 20.6 20.5 19.8 19.1 26 Finland 17.4 17.4 16.9 16.9 17.9 17.2 16.0 15.8
27 Sweden 13.9 14.9 15.9 15.0 16.1 15.6 16.4 18.6
28 UK 22.6 23.2 22.0 23.2 22.7 24.1 24.8 26.4
Source: Eurostat
There are many Member States which faced to an increase of the people at risk of poverty or social exclusion during 2007-2013. On the other hand, the disparities related this indicator were high in 2013 (see Figure 11 i). According to Figure 11 i, the use of the two clusters grouping is available again. Moreover, the clusters’ quality is 0.7, an acceptable value (Figure 9).
Figure 9. People at risk of poverty under cluster analysis
Source: personal contribution using IBM-SPSS software
Figure 10. People at risk of poverty forecasting
Belgium Bulgaria Czech Republic
Denmark Germany Estonia
Ireland Greece Spain
France Croatia Italy
Cyprus Latvia Lithuania
Luxembourg Hungary Malta
Netherlands Austria Poland
Portugal Romania Slovenia
Slovakia Finland Sweden
UK
3. Is 2020 a step to cohesion or to great disparities?
An intermediate conclusion of the analysis, available for all Europe 2020 Strategy’s targets is that the Member States can be grouped constantly into two clusters, according to their socio-economic performances. This cluster approach allows analysis to quantify the disparities between Member States using regression. The first question is if these disparities increase or decrease in 2020. In order to obtain the best answer, the regression analysis for 2013 and 2020 is useful (see Figure 11).
Figure 11. Disparities in 2013 and 2020
a. Employment rate in 2013 b. Employment rate in 2020
c. Investment in R&D in 2013 d. Investment in R&D in 2020
g. Tertiary educational atainment in 2013 h. Tertiary educational atainment in 2020
i. People at risk of poverty in 2013 j. People at risk of poverty in 2020 Source: personal contribution using IBM-SPSS software
The comparative analysis of the employment rates in Figure 11 leads to the conclusion that 92.86% of the two clusters’ structure in 2013 remains the same in 2020. The same analysis leads to 100% in identifying the two clusters’ structure for expenditure in R&D. The same ratio of 92.86% is available for the greenhouse gas emissions and tertiary educational attainment in both years. Finally, 96.43% of the two clusters’ structure in 2013 is maintained in 2020.
Conclusions
The forecasted results related to Europe 2020 Strategy’s goals are far away from those wanted. The disparities between the Member States will be the same in 2020, even greater. Moreover, the different individual economic and social performances led to the idea of dividing Member States into two clusters. We can talk about a divided EU, an EU with at least two development speeds. The idea in not new, but the future seems to support it again. On the other hand, there is not Member State able to achieve all Europe 2020 Strategy’s goals in 2020. The need to another common strategy closer to the reality is greater and greater.
References
Arpaia, A., Aron, K., Balazs P. and Turrini, A. (2014), “Labour mobility and labour market adjustment in the EU”, European Economy, Economic Papers no. 539, Brussels. Bernard, A.C., Billand, P., Frachisse D. and Massard N. (2007), “Social distance versus
spatial distance in R&D cooperation: Empirical evidence from European collaboration choices in micro and nanotechnologies”, Regional Science, Vol. 86, Issue 3, pp. 495– 519.
Edler, J., Kuhlmann, S. and Behrens, M. (2003), Changing Governance of Research and Technology Policy: The European Research and Technology Policy, Edward Elgar Publishing Limited, Cheltenham, UK.
European Commission (2010),”Europe 2020. A European strategy for smart, sustainable and inclusive growth”, COM (2010) 2020, Brussels.
European Environment Agency (2014), “Costs of air pollution from European industrial facilities 2008–2012”, Publications Office of the European Union, Luxembourg. European Environment Agency (2014), “Air quality in Europe — 2014 report”,
Publications Office of the European Union, Luxembourg.
Eurostat (2015), “Employment rate, age group 20-64”, available at: http://ec.europa.eu/eurostat/tgm/ printtable.do?tab=table&plugin=1&language=en& pcode=t2020_10.
Eurostat (2015), ”Gross domestic expenditure on R&D”, available at: http://ec.europa.eu/eurostat/tgm/table.do?tab=table&init=1&plugin=1&language=en& pcode=t2020_20.
Eurostat (2015), “Greenhouse gas emissions, base year 1990”, available at: http://ec.europa.eu/eurostat/tgm/table.do?tab=table&init=1&plugin=1&language=en& pcode=t2020_30.
Eurostat (2015), “Tertiary educational attainment”, available at: http://ec.europa.eu/eurostat/tgm/ table.do?tab=table&init=1&plugin=1&language= en&pcode=t2020_41.
Eurostat (2015), “People at risk of poverty or social exclusion”, available at: http://ec.europa.eu/ eurostat/tgm/table.do?tab=table&init=1&plugin=1&language=en &pcode=t2020_50.
Haffner, M., Dol, K. and Heylen, K. (2014), “Tenants at risk of poverty induced by housing expenditure - exploratory analyses with EU- SILC”, OTB Working papers, Delft University of Technology.
Kiss, A., Arpaia, A. and Turrini A. (2014), “Is unemployment structural or cyclical? Main features of job matching in the EU after the crisis”, European Economy, Economic Papers no. 527, Brussels.
Lelkes, O. and Zólyomi, E. (2011), “Poverty and Social Exclusion of Migrants in the European Union”, European Centre, Policy Briefs, Vienna.
Paiera, M. and Scherngella, T. (2011), “Determinants of Collaboration in European R&D Networks: Empirical Evidence from a Discrete Choice Model”, Industry & Innovation, Vol. 18, Issue 1, pp. 89-104.