Syndrome in Zibo City, China, 2009–2012
Feng Cui., Tao Wang., Ling Wang, Shuxia Yang, Ling Zhang, Haixia Cao, Yan Zhang, Haodong Hu,
Shenyong Zhai*
Zibo Municipal Center for Disease Control and Prevention, Zibo, Shandong Province, People’s Republic of China
Abstract
Background:Hemorrhagic fever with renal syndrome (HFRS) is highly endemic in mainland China, where human cases account for 90% of the total global cases. Zibo City is one of the most serious affected areas in Shandong Province China with the HFRS incidence increasing sharply from 2009 to 2012. However, the hotspots of HFRS in Zibo remained unclear. Thus, a spatial analysis was conducted with the aim to explore the spatial, spatial-temporal and seasonal patterns of HFRS in Zibo from 2009 to 2012, and to provide guidance for formulating regional prevention and control strategies.
Methods:The study was based on the reported cases of HFRS from the National Notifiable Disease Surveillance System. Annualized incidence maps and seasonal incidence maps were produced to analyze the spatial and seasonal distribution of HFRS in Zibo City. Then spatial scan statistics and space-time scan statistics were conducted to identify clusters of HFRS.
Results: There were 200 cases reported in Zibo City during the 4-year study period. One most likely cluster and one secondary cluster for high incidence of HFRS were identified by the space-time analysis. And the most likely cluster was found to exist at Yiyuan County in October to December 2012. The human infections in the fall and winter reflected a seasonal characteristic pattern of Hantaan virus (HTNV) transmission. The secondary cluster was detected at the center of Zibo in May to June 2009, presenting a seasonal characteristic of Seoul virus (SEOV) transmission.
Conclusion:To control and prevent HFRS in Zibo city, the comprehensive preventive strategy should be implemented in the southern areas of Zibo in autumn and in the northern areas of Zibo in spring.
Citation:Cui F, Wang T, Wang L, Yang S, Zhang L, et al. (2013) Spatial Analysis of Hemorrhagic Fever with Renal Syndrome in Zibo City, China, 2009–2012. PLoS ONE 8(6): e67490. doi:10.1371/journal.pone.0067490
Editor:Jens H. Kuhn, National Institutes of Health. National Institute of Allergy and Infectious Diseases, Division of Clinical Research, United States of America
ReceivedJanuary 31, 2013;AcceptedMay 18, 2013;PublishedJune 28, 2013
Copyright:ß2013 Cui et al. This is an open-access article distributed under the terms of the Creative Commons Attribution License, which permits unrestricted use, distribution, and reproduction in any medium, provided the original author and source are credited.
Funding:This work was supported by Zibo Municipal Center for Disease Control and Prevention. The funders had no role in study design, data collection and analysis, decision to publish, or preparation of the manuscript.
Competing Interests:The authors have declared that no competing interests exist.
* E-mail: zibocdc@163.com
.These authors contributed equally to this work.
Introduction
Hemorrhagic fever with renal syndrome (HFRS), a rodent-borne disease caused by hantaviruses (family Bunyaviridae), is characterized by fever, acute renal dysfunction, and hemorrhage manifestations [1,2]. Various rodent species are natural hosts and serve as sources of infection [3]. In China, the causative agents of HFRS are predominately Hantaan virus (HTNV) and Seoul virus (SEOV), which result in case fatality rates of approximately 10% and 1%, respectively [4]. HTNV causes a more severe form of HFRS than SEOV does and is associated with Apodemus agrarius
(striped field mouse), while SEOV is typically carried by Rattus norvegicus (Norway rat) [3,5–7]. Occurrence of HFRS cases is seasonal with a bimodal pattern and studies suggest that the pattern is linked to varying transmission dynamics of the two serotypes of hantaviruses among their animal hosts. HTNV-caused HFRS cases occur year-round but tend to peak in the winter while SEOV-caused infections typically peak in the spring [6,8,9]. Hantaviruses are primarily transmitted from rodent host to
human by aerosols generated from contaminated urine and feces and possibly from contaminated food or rodent bites [10–12].
Therefore, we conducted GIS-based spatial and space-time scan statistics analysis to characterize the spatial, spatial-temporal and seasonal patterns of HFRS at town-level in Zibo City of China during 2009–2012. The conclusions of our study will be essential for determining the approach to rodent control or to vaccination for HFRS prevention and control on a small geographic scale.
Materials and Methods
Study Area
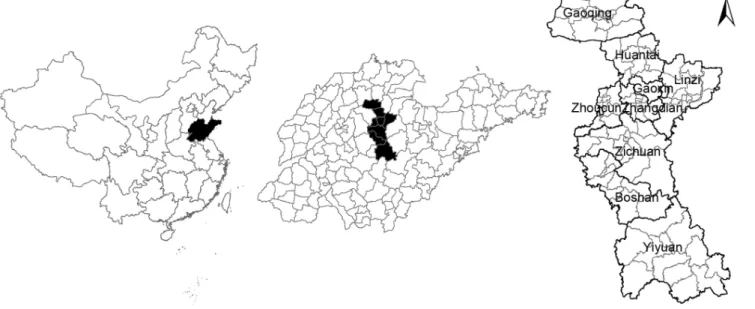
The study site is located in Zibo City (latitude 35u559,37u179N
and longitude 117u329,118u319 E), in the central part of
Shandong province (Figure 1). The city includes 88 towns belonging to 9 counties with a total land area of 5 965 square kilometers and a population of about 4.22 million. It has a temperate and monsoonal climate with four clearly distinct seasons. In Zibo City, the southern areas are mountainous and hilly, and the northern areas are plain.
Data Collection and Management
The data on reported HFRS cases including information about sex, age, residential address, and onset date of symptoms for each case were obtained from the National Notifiable Disease Surveillance System, and we were permitted to use the data. To conduct a GIS-based analysis on the spatial distribution of HFRS, the town-level polygon map at 1:100 000 scale was obtained, on which the town-level point layers containing information regard-ing latitudes and longitudes of central points of each town were created. Demographic information based on Zibo Statistical Yearbook was integrated in terms of the administrative code. All HFRS cases were geo-coded and matched to the town-level layers of polygon and point by administrative code using the software ArcGIS9.3 (ESRI Inc., Redlands, CA, USA).
Demographic Distribution Analysis
The demographic distribution characteristics including age, sex and occupation distribution of HFRS cases from 2009 to 2012 in Zibo City were analyzed according to surveillance data.
Geographical Information System (GIS) Mapping for Incidence of HFRS
Based on annual incidence, all towns were grouped into four categories [5,19]: non-endemic areas, low endemic areas with an annual incidence between 0 and 5 per 100 000, medium endemic areas with an incidence between 5 and 15 per 100 000, and high endemic areas with an incidence over 15 per 100 000. The four types of counties were color-coded on the maps.
To alleviate variations of incidence in small populations and areas, annualized average incidence of HFRS per 100 000 at each town over the 4 year-period were calculated. Furthermore, annualized average incidences and the proportion of monthly average incidence for each town were mapped in gradient colors and pie charts, respectively.
Spatial Cluster Analysis
Spatial and space-time scan statistics [20–24] were applied to identify clusters of HFRS. The analyses were performed each given year using SaTScanTMv9.1.1 software (http://www.satscan. org/). The null hypothesis assumed that the relative risk (RR) of HFRS was the same within the window compared to outside [19]. In this analysis, a Poisson based model was used, where the number of events in an area is Poisson distributed according to a known underlying population at risk [25]. The spatial scan statistic imposes a circular (or elliptic) window which is in turn centered on each geographical area throughout the study region. The radius of the window varies continuously in size from zero to some upper limit specified by the user. The space-time scan statistic is defined by a cylindrical window with a circular (or elliptic) geographic base and with height corresponding to time [21].
For this study, in order to find possible sub-clusters, the maximum spatial cluster size was set as 10% of the total population at risk, and the maximum temporal cluster size was set as 50% of the total study period. The test of significance of the identified clusters was based on comparing the likelihood ratio test statistics against a null distribution obtained from Monte Carlo Simulation [24,26]. The number of permutation was set to 999 and the significance level was set as 0.05.
Figure 1. Location of the study area, Zibo City in Shandong Province, China. doi:10.1371/journal.pone.0067490.g001
Results
Descriptive Analysis of HFRS in Zibo City
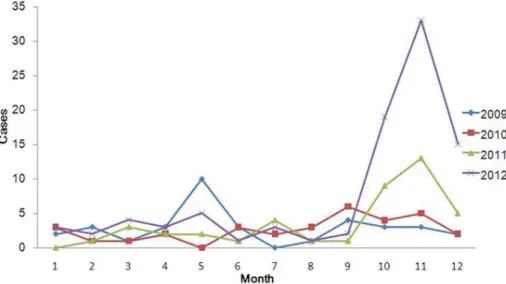
A total of 200 cases were reported in Zibo City during the 4-year study period. Of these, 76% were male and 24% were female, with the sex ratio (male vs. female) 3.17. Among these patients, 3% were in children #14 years of age, 89% were in persons 15–64 years of age, and 8% were in persons$65 years of age. Regarding to occupation, 68% of HFRS patients were farmers, 10% were workers (mainly forestry workers, builders), and followed by students which accounted for 6%. Poor housing conditions and high rodent density in rural areas seem to be responsible for most HFRS epidemics. The monthly distribution of HFRS cases was shown in figure 2, which indicated that the occurrence of HFRS presented significant seasonality.
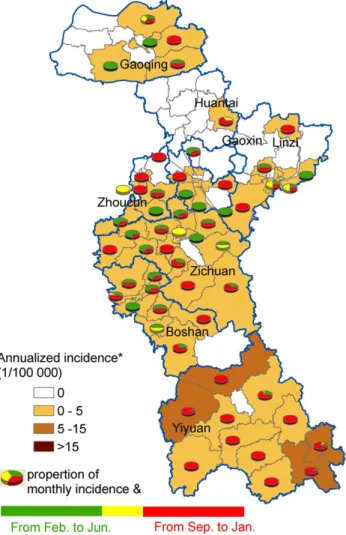
The HFRS incidence rates per year and per town were summarized in Figure 3. The annual incidence had sharply increased from 2009 to 2012. Figure 4 showed annualized average incidence and the proportion of monthly average incidence for
each town. Annualized average incidence at the town-level ranged from 0 to 10.1 per 100 000.Among the total 88 towns in Zibo, 31 towns were non-endemic, 54 towns were low-endemic, and 4 towns were medium-endemic. The main endemic areas of HFRS were located in the south of Zibo City with a single epidemic peak in the fall-winter season mapped by the red color of the pies. In north Zibo City, an epidemic peak in the spring season was mapped by the green color in the pies (Figure 4).
Purely Spatial Analysis
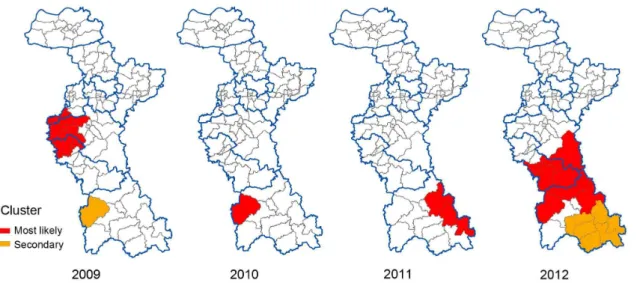
For the purely spatial analyses, the clusters were detected for each year from 2009 to 2012. The significant clusters of a high incidence of HFRS were listed in Table 1, and depicted on the map in Figure 5, which indicated that the locations and sizes of these clusters varied by year.
Space-time Analysis of HFRS in Zibo City
Space-time cluster analysis of HFRS in 2009–2012 in Zibo City revealed that HFRS was not distributed randomly in space-time Figure 2. Monthly distribution of HFRS cases, 2009–2012.
doi:10.1371/journal.pone.0067490.g002
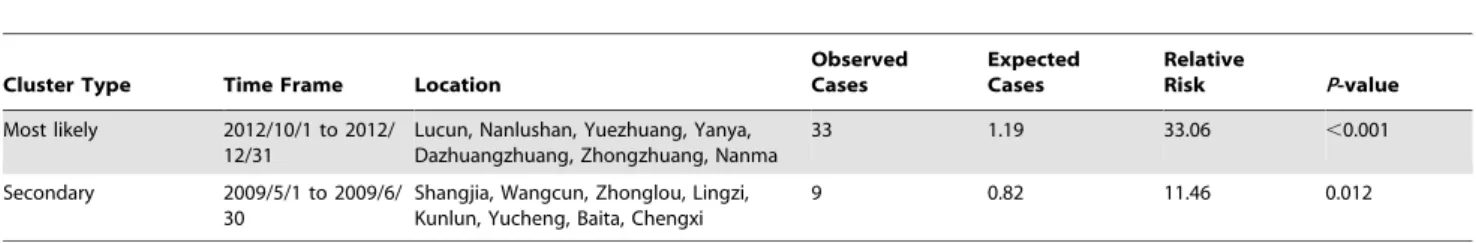
(Table 2 and Figure 6). The most likely statistically significant cluster for high incidence of HFRS was found at Yiyuan County in October to December 2012 (RR = 33.06, p,0.001), with 33 observed cases and 1.19 expected cases. One statistically significant secondary cluster was also detected for high incidence of HFRS, which had 9 observed cases and 0.82 expected cases (RR = 11.46, p = 0.012) in May to June 2009.
Discussion
In this study, our results demonstrated that the HFRS incidence had been increasing from 2009 to 2012 and the main re-emerging endemic areas of HFRS were located in the south of Zibo City. The proportion of monthly average incidence for each town showed that HFRS in the southern region of Zibo was mainly caused by HTNV, and in the northern was mainly caused by SEOV. For the purely spatial analyses, the clusters were detected for each year from 2009 to 2012. One most likely cluster and one secondary cluster for high incidence of HFRS were identified by the space-time analysis.
In epidemiology, cluster analyses are of importance in detecting aggregation of disease cases, testing the occurrence of any statistically significant clusters, and ultimately finding evidences of etiologic factors. Recently, scan statistic implemented in SaTScanTM software is being widely used to detect and evaluate clusters for a variety of diseases, including cancer [26–28], HFRS [3,16], tuberculosis [29–31], Creutzfeldt-Jakob disease [32], etc. In our study, the clusters detected by the purely spatial analyses provided reference of quantitative measurements for the geo-graphic areas of high HFRS risk.
Space-time scan statistic method is proposed as a dynamic supplement to purely spatial statistical methods for outbreak detection and prediction. One most likely cluster and one secondary cluster for high incidence of HFRS were identified by the space-time analysis. The most likely cluster was found at Yiyuan County in October to December 2012, and the secondary cluster was detected at the centers of Zibo City in May to June 2009. Previous studies reported that the transmission of HTNV through Apodemus agrarius peaked in the winter, while Rattus norvegicusassociated SEOV infections mainly occurred in the spring [6,8,9,33]. Thus, the human infections in the most likely cluster in the fall and winter reflect a seasonal characteristic pattern of HTNV transmission, and a seasonal characteristic of SEOV transmission in the secondary cluster. The HFRS endemic areas have spread from the initial center of Zibo in 2009 towards the southern parts of Zibo in 2012 with shifts of causal agents of HFRS – SEOV to HTNV. The dominant rodent species might also have Figure 4. The spatial distribution of HFRS incidence and their
proportion of monthly incidence in each town.The background of map with color gradient presents the annual incidence of HFRS, and pie graphs display the proportion of monthly incidence for each town. Towns in white on the map have zero incidences. * Average annual incidence per 100 000 populations. & Proportion of average monthly incidence in these pie graphs, where green color indicates the proportion of average monthly incidence from February to June (in spring and early summer), yellow is the proportion of average monthly incidence from July to August (in summer), and the red represents the proportion of average monthly incidence from September to January (in autumn and winter).
doi:10.1371/journal.pone.0067490.g004
Table 1.SaTScan statistics for spatial clusters with significant higher incidence in Zibo City, China from 2009 to 2012.
Year Cluster Type Location Observed Cases Expected Cases Relative Risk P-value
2009 Most likely Shangjia, Wangcun, Zhonglou, Lingzi, Kunlun, Yucheng, Baita, Chengxi
14 3.35 6.40 ,0.001
Secondary Lucun 5 0.62 9.21 0.045
2010 Most likely Lucun 7 0.59 14.96 ,0.001
2011 Most likely Yuezhuang, Shiqiao, Zhangjiapo 13 1.19 15.22 ,0.001
2012 Most likely Lucun, Nanlushan, Yuezhuang, Taihe, Yuanquan, Shima, Boshan, Chishang
37 7.70 7.46 ,0.001
Secondary Shiqiao, Zhangjiapo, Yanya, Dongli, Xili, Zhongzhuang
19 4.63 4.94 ,0.001
doi:10.1371/journal.pone.0067490.t001
shifted fromRattus norvegicustoApodemus agrarius, and further rodent HFRS surveillance, including using virus isolation method to discriminate HFRS cases due to different hantaviruses, should be enhanced.
Yiyuan, the most likely cluster, and Zichuan, the secondary cluster are mountainous and hilly with numerousApodemus agrarius,
and farmers have more chances to be exposed to contaminated urine and feces of infected rodents compared to neighboring localities. Agricultural activities such as sleeping in the fields, irrigating, and working on the farmland during the autumn harvest season might have played a significant role in the occurrence of HFRS [34]. Therefore, for the southern areas of Zibo city where the HFRS cases manily caused by HTNV, deratization in wild areas should be enhanced in the late autumn and early winter; for the northern areas of Zibo city where the HFRS cases mainly caused by SEOV, derationzation in residential areas and reducing human exposure to infected rodents and their excrements should be enhanced in spring.
The application of GIS, together with spatial statistical techniques, provides ways to quantify explicit HFRS and to further identify environmental factors responsible for the increas-ing disease risk. Although analyses are still preliminary, the findings can be helpful for generating hypothesis for further investigation. Future researches are warranted to focus on the risk factors of HFRS such as rodent population densities, human activities, farming patterns, various socio-economic and environ-mental factors in the clustering areas including Yiyuan and Zichuan county. Despite insights gained from our study, the limitations of our study should also be acknowledged. Firstly, due to a lack of time series data on the Hantaviruses of HFRS cases, population densities of rodents, and the influencing factors, it is difficult to further uncover the probable causes of the characters and shifts of the spatial, spatial-temporal and seasonal patterns of HFRS. Secondly, our data are from a passive surveillance system, and cases might be underreported, which then might influence the precision of our analyses.
In summary, the result of our study provide useful information on the prevailing epidemiological situation of HFRS in Zibo City. The novel knowledge about the presence of clusters of HFRS in Zibo can help the Zibo CDC to intensify their remedial measures in the identified areas of high HFRS prevalence and chalk out future strategies for more effective HFRS control. To control and prevent HFRS, a comprehensive preventive strategy including public health education and promotion, rodent control, surveil-lance, and vaccination should be implemented in the southern areas of Zibo in autumn and in the northern areas of Zibo in spring.
Figure 5. Spatial clusters of HFRS in Zibo City, China from 2009 to 2012. doi:10.1371/journal.pone.0067490.g005
Figure 6. Space-time clusters of HFRS in Zibo City, China from 2009 to 2012.
Author Contributions
Conceived and designed the experiments: FC TW SYZ. Performed the experiments: FC TW LW. Analyzed the data: TW SYZ. Contributed
reagents/materials/analysis tools: LW SXY LZ HXC YZ HDH. Wrote the paper: FC TW.
References
1. Schmaljohn CS, Dalrymple JM (1983) Analysis of Hantaan virus RNA: evidence for a new genus of bunyaviridae. Virology 131: 482–491.
2. Liu YX, Feng D, Zhang Q, Jia N, Zhao ZT, et al. (2007) Key differentiating features between scrub typhus and hemorrhagic fever with renal syndrome in northern China. Am J Trop Med Hyg 76: 801–805.
3. Fang LQ, Zhao WJ, de Vlas SJ, Zhang WY, Liang S, et al. (2009) Spatiotemporal dynamics of hemorrhagic fever with renal syndrome, Beijing, People’s Republic of China. Emerg Infect Dis 15: 2043–2045.
4. Zhang WY, Fang LQ, Jiang JF, Hui FM, Glass GE, et al. (2009) Predicting the risk of hantavirus infection in Beijing, People’s Republic of China. Am J Trop Med Hyg 80: 678–683.
5. Liu X, Jiang B, Bi P, Yang W, Liu Q (2012) Prevalence of haemorrhagic fever with renal syndrome in mainland China: analysis of National Surveillance Data, 2004–2009. Epidemiol Infect 140: 851–857.
6. Fang LQ, Wang XJ, Liang S, Li YL, Song SX, et al. (2010) Spatiotemporal trends and climatic factors of hemorrhagic fever with renal syndrome epidemic in Shandong Province, China. PLoS Negl Trop Dis 4: e789.
7. Zhang YZ, Zou Y, Fu ZF, Plyusnin A (2010) Hantavirus infections in humans and animals, China. Emerg Infect Dis 16: 1195–1203.
8. Zhang YZ, Zhang FX, Wang JB, Zhao ZW, Li MH, et al. (2009) Hantaviruses in rodents and humans, Inner Mongolia Autonomous Region, China. Emerg Infect Dis 15: 885–891.
9. Kim YS, Ahn C, Han JS, Kim S, Lee JS, et al. (1995) Hemorrhagic fever with renal syndrome caused by the Seoul virus. Nephron 71: 419–427.
10. Song G (1999) Epidemiological progresses of hemorrhagic fever with renal syndrome in China. Chin Med J (Engl) 112: 472–477.
11. Clement JP (2003) Hantavirus. Antiviral Res 57: 121–127.
12. Yan L, Fang LQ, Huang HG, Zhang LQ, Feng D, et al. (2007) Landscape elements and Hantaan virus-related hemorrhagic fever with renal syndrome, People’s Republic of China. Emerg Infect Dis 13: 1301–1306.
13. Zuo SQ, Fang LQ, Zhan L, Zhang PH, Jiang JF, et al. (2011) Geo-spatial hotspots of hemorrhagic fever with renal syndrome and genetic characterization of Seoul variants in Beijing, China. PLoS Negl Trop Dis 5: e945.
14. Simmons JH, Riley LK (2002) Hantaviruses: an overview. Comp Med 52: 97– 110.
15. Wu W, Guo J, Guan P, Sun Y, Zhou B (2011) Clusters of spatial, temporal, and space-time distribution of hemorrhagic fever with renal syndrome in Liaoning Province, Northeastern China. BMC Infect Dis 11: 229.
16. Lin H, Liu Q, Guo J, Zhang J, Wang J, et al. (2007) Analysis of the geographic distribution of HFRS in Liaoning Province between 2000 and 2005. BMC Public Health 7: 207.
17. Sun L, Shao Q, Wang ZQ, Kang DM, Li SW, et al. (2011) Spatial structure of rodent populations and infection patterns of hantavirus in seven villages of Shandong Province from February 2006 to January 2007. Chin Med J (Engl) 124: 1639–1646.
18. Wu W, Guo JQ, Yin ZH, Wang P, Zhou BS (2009) GIS-based spatial, temporal, and space-time analysis of haemorrhagic fever with renal syndrome. Epidemiol Infect 137: 1766–1775.
19. Fang L, Yan L, Liang S, de Vlas SJ, Feng D, et al. (2006) Spatial analysis of hemorrhagic fever with renal syndrome in China. BMC Infect Dis 6: 77. 20. Kulldorff M (1997) A spatial scan statistic. Communications in Statistics-Theory
and methods 26: 1481–1496.
21. Kulldorff M, Athas WF, Feurer EJ, Miller BA, Key CR (1998) Evaluating cluster alarms: a space-time scan statistic and brain cancer in Los Alamos, New Mexico. Am J Public Health 88: 1377–1380.
22. Kulldorff M, Mostashari F, Duczmal L, Katherine Yih W, Kleinman K, et al. (2007) Multivariate scan statistics for disease surveillance. Stat Med 26: 1824– 1833.
23. Kulldorff M, Nagarwalla N (1995) Spatial disease clusters: detection and inference. Stat Med 14: 799–810.
24. Saman DM, Cole HP, Odoi A, Myers ML, Carey DI, et al. (2012) A spatial cluster analysis of tractor overturns in Kentucky from 1960 to 2002. PLoS One 7: e30532.
25. Kulldorff M, Heffernan R, Hartman J, Assuncao R, Mostashari F (2005) A space-time permutation scan statistic for disease outbreak detection. PLoS Med 2: e59.
26. Kulldorff M, Feuer EJ, Miller BA, Freedman LS (1997) Breast cancer clusters in the northeast United States: a geographic analysis. Am J Epidemiol 146: 161– 170.
27. Henry KA, Niu X, Boscoe FP (2009) Geographic disparities in colorectal cancer survival. Int J Health Geogr 8: 48.
28. Amin R, Bohnert A, Holmes L, Rajasekaran A, Assanasen C (2010) Epidemiologic mapping of Florida childhood cancer clusters. Pediatr Blood Cancer 54: 511–518.
29. Tiwari N, Adhikari CM, Tewari A, Kandpal V (2006) Investigation of geo-spatial hotspots for the occurrence of tuberculosis in Almora district, India, using GIS and spatial scan statistic. Int J Health Geogr 5: 33.
30. Wang T, Xue F, Chen Y, Ma Y, Liu Y (2012) The spatial epidemiology of tuberculosis in Linyi City, China, 2005–2010. BMC Public Health 12: 885. 31. Maciel EL, Pan W, Dietze R, Peres RL, Vinhas SA, et al. (2010) Spatial patterns
of pulmonary tuberculosis incidence and their relationship to socio-economic status in Vitoria, Brazil. Int J Tuberc Lung Dis 14: 1395–1402.
32. Cousens S, Smith PG, Ward H, Everington D, Knight RS, et al. (2001) Geographical distribution of variant Creutzfeldt-Jakob disease in Great Britain, 1994–2000. Lancet 357: 1002–1007.
33. Chen HX, Qiu FX, Dong BJ, Ji SZ, Li YT, et al. (1986) Epidemiological studies on hemorrhagic fever with renal syndrome in China. J Infect Dis 154: 394–398. 34. Bi P, Wu X, Zhang F, Parton KA, Tong S (1998) Seasonal rainfall variability, the incidence of hemorrhagic fever with renal syndrome, and prediction of the disease in low-lying areas of China. Am J Epidemiol 148: 276–281. Table 2.SaTScan statistics for space-time clusters with significant higher incidence in Zibo City, China from 2009 to 2012.
Cluster Type Time Frame Location
Observed Cases Expected Cases Relative Risk P-value
Most likely 2012/10/1 to 2012/ 12/31
Lucun, Nanlushan, Yuezhuang, Yanya, Dazhuangzhuang, Zhongzhuang, Nanma
33 1.19 33.06 ,0.001
Secondary 2009/5/1 to 2009/6/ 30
Shangjia, Wangcun, Zhonglou, Lingzi, Kunlun, Yucheng, Baita, Chengxi
9 0.82 11.46 0.012
doi:10.1371/journal.pone.0067490.t002