www.biogeosciences.net/13/6611/2016/ doi:10.5194/bg-13-6611-2016
© Author(s) 2016. CC Attribution 3.0 License.
Controls on soil organic carbon stocks in tidal marshes along
an estuarine salinity gradient
Marijn Van de Broek1, Stijn Temmerman2, Roel Merckx1, and Gerard Govers1 1Department of Earth and Environmental Sciences, KU Leuven, 3001 Heverlee, Belgium
2Department of Biology, Ecosystem Management Research Group, University of Antwerp, 2610 Wilrijk, Belgium
Correspondence to:Marijn Van de Broek ([email protected]) Received: 7 July 2016 – Published in Biogeosciences Discuss.: 1 August 2016
Revised: 6 November 2016 – Accepted: 22 November 2016 – Published: 16 December 2016
Abstract. Tidal marshes are sedimentary environments and are among the most productive ecosystems on Earth. As a consequence they have the potential to reduce atmospheric greenhouse gas concentrations by sequestering organic car-bon (OC). In the past decades, most research on soil or-ganic carbon (SOC) storage in marsh environments has fo-cused on salt marshes, leaving carbon dynamics in brackish and freshwater marshes largely understudied and neglecting the diversity among tidal marshes. We therefore conducted an extensive sampling campaign to quantify and characterize SOC stock in marshes along a salinity gradient in the Scheldt estuary (Belgium and the Netherlands). We find that SOC stocks vary significantly along the estuary, from 46 in fresh-water marshes to 10 kg OC m−2 in salt marshes. Our data also show that most existing studies underestimate total SOC stocks due to shallow soil sampling, which also influences re-ported patterns in OC storage along estuaries. In all sampled tidal marsh sediments the SOC concentration is more or less constant from a certain depth downward. However, this con-centration decreases with increasing salinity, indicating that the amount of stable SOC decreases from the upper estuary towards the coast. Although the net primary production of macrophytes differs along the estuary, our data suggest that the differences in OC storage are caused mainly by variations in suspended sediment concentration and stable particulate OC (POC) content in the water along the estuary. The frac-tion of terrestrial suspended sediments and POC that is trans-ported downstream of the maximum turbidity zone is very limited, contributing to smaller amounts of long-term OC se-questration in brackish and salt marsh sediments. In addition, high rates of sediment deposition on freshwater tidal marshes
in the maximum turbidity zone promote efficient burial of OC in these marsh sediments.
1 Introduction
As a consequence of increasing atmospheric greenhouse gas concentrations and the recognition that soils have the poten-tial to store vast amounts of organic carbon (OC), there is large interest in the OC storage potential of soils in different ecosystems (Duarte et al., 2013; Govers et al., 2013; Scharle-mann et al., 2014). Although coastal vegetated habitats oc-cupy only 0.2 % of the ocean surface, it has been estimated that they account for approximately 50 % of carbon burial in marine sediments, referred to as blue carbon (Donato et al., 2011; Duarte et al., 2013; Mcleod et al., 2011; Nelleman et al., 2009). It has recently been shown that the OC sequestra-tion potential of these ecosystems will depend to a large ex-tent on future climatic changes and sea level rise (Cherry et al., 2009; Kirwan and Blum, 2011; Kirwan and Mudd, 2012; Weston et al., 2011). Moreover, changing carbon storage in these ecosystems can potentially cause important feedbacks to atmospheric concentrations of carbon dioxide (CO2)and methane (CH4; Duarte et al., 2013; Pendleton et al., 2012; Poffenbarger et al., 2011). Constraining the amount of OC that is sequestered in these ecosystems and understanding the processes controlling the size of this pool are of major importance for understanding the global carbon cycle.
are among the most productive ecosystems on Earth (Rocha and Goulden, 2009; Whigham, 2009). Their elevation in-creases as a consequence of the deposition of both mineral sediments and allochthonous organic matter (OM) during flooding events on the one hand and the incorporation of in situ produced biomass (both above and below ground) on the other hand (Fagherazzi et al., 2012; Neubauer, 2008). Re-cently formed young tidal marshes, with a low elevation, receive more mineral sediments than their higher counter-parts, with sedimentation rates decreasing through time until the marsh platform elevation is in equilibrium with the local mean high water level (Temmerman et al., 2003).
Despite the fact that the importance of vegetated coastal ecosystems and tidal marshes is now widely recognized, es-timates of the total amount of OC stored in tidal marshes are subject to a large uncertainty. Estimates of soil organic carbon (SOC) stocks in salt marshes (i.e. tidal marshes bordering saltwater bodies) range between 0.4 and 6.5 Pg (Bridgham et al., 2006; Chmura et al., 2003; Duarte et al., 2013). To the best of our knowledge, no global estimates are available for brackish and freshwater marshes.
There are multiple reasons for the large uncertainty in es-timates of the global OC storage in tidal marsh soils. Firstly, the total area of global salt marshes currently used to estimate global stocks is poorly constrained, with estimates between 22 000 and 400 000 km2(Chmura et al., 2003; Woodwell et al., 1973), while a global inventory for freshwater marshes is lacking (Barendregt and Swarth, 2013). Secondly, the avail-able data set on SOC stocks is limited, both in terms of the number of samples analysed and the geographical scope: hitherto, most studies were carried out in a limited num-ber of estuaries, mostly located on the southern and east-ern coasts of North America. Differences in sampling pro-cedure and depth beneath the soil surface also contribute to uncertainty. Very often only topsoil samples are analysed, with a limited number of studies considering carbon stor-age in deeper horizons, although it has been recognized that these also store a significant amount of OC (Elschot et al., 2015; Wang et al., 2011). An additional factor complicating the extrapolation of data to tidal marshes, for which no data are available, is the wide range of reported OC contents for tidal marsh soils (Bouillon and Boschker, 2006; Middelburg et al., 1997). A third important reason for the uncertainties mentioned above is that tidal marshes in estuaries are char-acterized by steep gradients of multiple environmental and ecological factors (Craft, 2007). A sharp increase in salinity towards the coast is present, resulting in a longitudinal es-tuarine gradient from salt marshes in the most seaward part over brackish marshes to freshwater tidal marshes. As a con-sequence of this salinity gradient a vegetation gradient de-velops, with macrophyte biomass generally being higher on freshwater and brackish marshes compared to salt marshes (Dausse et al., 2012; Hansen et al., 2016; Weston et al., 2014; Wieski et al., 2010). In addition, the OC input in tidal marsh soils is a mixture of upland, riverine, estuarine and marine
sources and the relative contribution of these sources to the total OC pool varies significantly along the estuary (Middel-burg and Nieuwenhuize, 1998).
Currently available data suggest that these environmental gradients along estuaries generally result in decreasing SOC stocks with increasing salinity (Craft, 2007; Hansen et al., 2016; Hatton et al., 1983; Wieski et al., 2010). However, our knowledge on how location along the estuary affects total SOC stocks and which processes control the magnitude of these stocks is, at present, still very limited, mainly because most studies only consider SOC storage down to a depth of 0.3 m and generally the reasons for the observed variability are not identified. Nevertheless, understanding the effect of environmental gradients on SOC dynamics in tidal marshes is important. Such understanding may not only help to im-prove our estimates of current SOC storage but will also be of great help in assessing the effects of sea level rise on these SOC stocks (Morrissey et al., 2014; Poffenbarger et al., 2011; Weston et al., 2011). Here, we study the variation in SOC inventories in tidal marshes along a salinity gradient in the Scheldt estuary, located in Belgium and the Netherlands. This estuary is characterized by strong gradients in salinity and sediment concentration, making it a suitable location to investigate the impact of these gradients on OC stocks in tidal marsh soils. The aims of this study are therefore (1) to deter-mine the SOC stocks of tidal marsh soils along the salinity gradient of a temperate estuary, (2) to determine the main controls on SOC stocks along this gradient and (3) to use this knowledge to assess how future environmental changes may influence SOC stocks in estuarine tidal marsh soils.
2 Materials and methods 2.1 Study sites
The Scheldt river is located in western Europe and flows into the North Sea in the southern Netherlands (Fig. 1). The estu-ary of the river extends from its mouth up to 160 km upstream where the tide is stopped by sluices near the city of Ghent (Belgium). The estuary is influenced by a semi-diurnal meso-to macrotidal regime, with mean tidal ranges between 3.8 m at the mouth and 5.2 m in the inner estuary (Meire et al., 2005). The estuary has a total length of about 235 km (includ-ing tributary tidal rivers) and comprises a salt or polyhaline zone (salinity > 18), brackish or mesohaline zone (salinity 5–18) and freshwater/oligohaline zone (salinity 0–5; Fig. 1). The Scheldt estuary is described in detail in Van Damme et al. (2005) and Meire et al. (2005).
Table 1.Main properties of the sampled tidal marshes.
Name Name in Vegetation Tidal Elevation relative POC% of Marsh sediment
this study range to local suspended depth
(m)a MHWL (m) sedimentb (m)c
Notelaar marsh Freshwater low Phragmites australis 5.14 +0.24 6–10 1.2
Freshwater high Salixsp.+Urtica dioica 5.14 +0.25 6–10 > 1.4
Waarde marsh Brackish water low Elymus athericus 4.85 +0.01 4–5 0.8
Brackish water high Elymus athericus 4.85 +0.14 4–5 > 1.4
Paulina marsh Saltwater low Spartina anglica 4.19 −0.66 3–4 0.2
Saltwater high Mixed vegetationd 4.19 +0.11 3–4 0.6
aFrom Meire et al. (2005).bFrom Abril et al. (2002).cBased on depth profiles of grain size and OC concentration.dAtriplex portulacoides,Limonium vulgare, Triglochin maritima,Elymus athericus,Puccinellia maritima.
!
!
!
!
Antwerp Terneuzen
Saltwater marsh
Brackish water marsh
Freshwater marsh Belgium
The Netherlands
¯
0 7.5 15
Kilometres
U.K.
France
Belgium NL North Sea
44 m
0 m
Fresh
Brackish
Salt
Vlissingen
Temse
Figure 1.Map of the Scheldt estuary showing the salinity zones and the location of the sampled tidal marshes in a western European context. Intertidal sand flats are depicted in light grey.
locations with different but known rates of historical sedi-ment accretion (Fig. 2 and Table 1). The first location was at the high marsh with an elevation of 0.1 to 0.3 m above mean high water level (MHWL), which has been accreting during the past decades at a rate that is in equilibrium with the rise of MHWL. At the second location, marsh formation started dur-ing the past decades at heights well below MHWL. Average accretion rates at these locations were therefore significantly higher than sea level rise (Fig. 2). For the period 1955–2002, the average accretion rates at low and high marshes were 0.5 and 0.75 cm yr−1for the salt marshes 1–2 and 0.5–1 cm yr−1 for the brackish marshes and 1–2 and 1 cm yr−1for the fresh-water marshes (Temmerman et al., 2004). The vegetation his-tory for the different sites is shown in Fig. 3. The locations of
the sampled tidal marshes are indicated in Fig. 1 and GPS co-ordinates of the sampling locations are provided in Table S1 in the Supplement.
2.2 Sample collection
1950 1970 1990 2010 4.5
5 5.5
Freshwater marsh
Mean high water level Low marsh
High marsh
1940 1960 1980 2000
Marsh elevation (m T.A.W.) 4 4.5
5 Brackish marsh
Year
1940 1960 1980 2000
3.5 4 4.5
Salt marsh
Figure 2.Evolution of marsh surface elevation and mean high water level (relative to Belgian ordnance level, m T.A.W.) at the sampled locations (based on Temmerman et al., 2004).
or with the gouge auger if soil wetness prevented the use of Kopecky rings. These samples were collected at the soil sur-face and at depth increments of 0.1 up to 0.5 m, then in 0.2 m increments down to the maximum depth of 1.4 m. Above-ground biomass was collected on a surface area of 0.25 m2 (five replicates) at the end of August 2015 at each coring lo-cation. The difference in timing between soil and biomass collections is due to the fact that standing biomass is max-imum in August in western European tidal marshes (Groe-nendijk, 1984; De Leeuw et al., 1990).
2.3 Soil and biomass analysis
Before analysis of the soil samples, macroscopic vegetation residues were removed manually using tweezers. The soil samples were oven-dried at 35◦C for 48 h and crushed un-til they passed through a 2 mm sieve. After carbonates were removed with a 10 % HCl solution, the samples were anal-ysed for OC,δ13C and C : N ratio using an Elemental Anal-yser (FlashEA 1112 HT, Thermo Scientific). Soil texture was determined using a laser diffraction particle size analyser (LSTM 13 320, Beckman Coulter) and grain size was clas-sified into clay (< 2 µm), silt (2–63 µm) and sand (> 63 µm)
low 0
0.2
0.4
0.6
0.8
1.0
1.2
1.4 Depth
(m) high low high low high
0.84
0.61 ?
?
Phrag-mites australis
Scirpus mari� -mus
Salix
Pasture
?
?
Elymus athericus
Spar�na anglica
Spar�na anglica?
S. anglica? Mix
Sandflat
Sandflat
Sandflat Freshwater Brackish water Saltwater
1.20
1.40 0.80
1.40 0.20
0.60
Elymus athericus
Sandflat
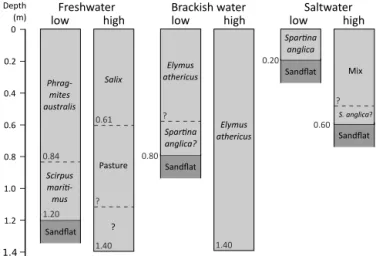
Figure 3.Depth profiles of the sampled tidal marshes showing the vegetation history at each location. At locations where the sand flat was reached this is indicated, at the other locations the marsh sedi-ments extended below 1.4 m depth. The vegetation history is based on Temmerman et al. (2003) and information from theδ13C pro-files of this study, in combination with information from Boschker et al. (1999) and Middelburg et al. (1997). Mix denotes mixed veg-etation which includesAtriplex portulacoides,Limonium vulgare,
Triglochin maritima,Elymus athericusandPuccinellia maritima. A “?” near a dashed line indicates that the exact depth of this line is uncertain, a “?” after species names indicates that the presence of this species was hypothesized.
fractions. Soil pH was determined after diluting 5 g of soil in 25 mL of a 0.01 M CaCl2solution and electrical conduc-tivity was measured after diluting 5 g of soil in 25 mL of deionized water. The collected biomass was dried at 60◦C for 48 h after sediments were removed and weighed in or-der to calculate the total dry weight of the biomass. The to-tal above-ground biomass of one of the replicates collected on a 0.25 m2 surface area was shredded and repeatedly di-vided into equal parts until only a small portion was left. This was further grinded and analysed for OC content,δ13C and C : N ratio using the Elemental Analyser (FlashEA 1112 HT, Thermo Scientific). Soil bulk density samples were dried at 105◦C for 24 h. After soil bulk densities were calculated, the samples were washed over a 0.5 mm sieve using deionized water and all roots were collected. The roots were cleaned using deionized water, dried at 60◦C and weighed.
2.4 Data analysis
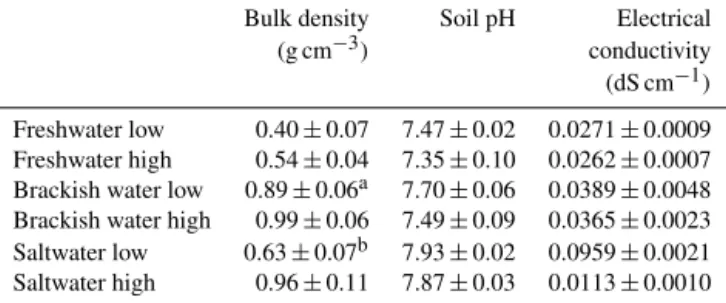
anal-Table 2.General characteristics of the soil profiles at the studied sites. Bulk density values are averages for the upper metre of soil, while soil pH and electrical conductivity were measured in the top-soil only.
Bulk density Soil pH Electrical
(g cm−3) conductivity
(dS cm−1) Freshwater low 0.40±0.07 7.47±0.02 0.0271±0.0009 Freshwater high 0.54±0.04 7.35±0.10 0.0262±0.0007 Brackish water low 0.89±0.06a 7.70±0.06 0.0389±0.0048 Brackish water high 0.99±0.06 7.49±0.09 0.0365±0.0023 Saltwater low 0.63±0.07b 7.93±0.02 0.0959±0.0021 Saltwater high 0.96±0.11 7.87±0.03 0.0113±0.0010
aDown to 0.7 m depth.bDown to 0.2 m depth.
ysed (i.e. every 0.09 m). Continuous depth profiles for bulk density were obtained in an identical way. These continu-ous depth profiles were then used to calculate total SOC stocks for a volume of soil with a surface area of 1 m2and a depth equal to the total sampling depth of the marsh sedi-ments. Root biomass was measured at discrete depths as ex-plained above. For every layer the total root biomass for a surface area of 1 m2was calculated by rescaling the average root biomass for the three replicates to the total volume of that soil layer. Linear interpolation between measurements at different depth intervals was used to calculate the total root density per surface area of 1 m2. To test whether annual above-ground biomass production was significantly different between the sites a one-way analysis of variance was used in Matlab®, after checking for normality (Anderson–Darling test) and homogeneity of variances (Levene’s test) with a level of significance ofp< 0.05. For the other variables only three replicates were available so no reliable significance test could be performed.
3 Results
3.1 Soil characteristics
The studied tidal marsh soils are classified as tidalic Fluvi-sols with a silt loam grain size (detailed grain size data are provided in the Supplement). The maximum depth of marsh sediments at the different study sites varies between 0.2 and > 1.4 m (Table 1). The average bulk density ranges from 0.40 to 0.99 g cm−3(detailed bulk density data are provided in the Supplement), and both the topsoil pH and electrical conduc-tivity increase in the downstream direction, from freshwater to salt marshes (Table 2).
3.2 Vegetation biomass production
Based on the measured total annual biomass (Fig. S1 in the Supplement, Table S2) and reported values of both above-and below-ground annual turnover rates (Table S3), annual
Biomass production (g DW m
-2 yr -1)
6000 4000 2000 0 2000 4000
Fresh Brackish Salt
Low High Low High Low High
A C E
B D
A C A C E
B D EA D E
Figure 4.Annual biomass production (g dry weight m−2yr−1), with upward pointing bars representing above-ground biomass pro-duction and downward pointing bars representing below-ground production (data are provided in Table S2). Standard deviations for above-ground biomass are calculated based on five replicates, for below-ground biomass on three replicas. Sample locations that do not share a letter have significantly (p< 0.05) different annual above-ground biomass production rates.
biomass production for the different sites was calculated, as shown in Fig. 4. In this figure, sample locations that do not share a letter have significantly different annual biomass production rates. The average annual above-ground biomass production is the highest for the brackish marshes, followed by the low freshwater marsh and both salt marshes. The high freshwater marsh has an above-ground biomass production that deviates from this pattern as a consequence of the fact that only fallen leaves of the willow trees were taken into account at this site, while standing willow vegetation could not be collected, so we underestimate total biomass produc-tion in this case. Upper limits for biomass producproduc-tion on this marsh may be deduced from other studies, which typically result in production rates of 500–1000 g dry weight m−2yr−1 (Kopp et al., 2001). Although no clear pattern in the an-nual production of below-ground biomass along the estuary is observed, large differences between the sites are present (Fig. 4). Below-ground biomass production on the low fresh-water marsh and the low salt marsh are 2 orders of magnitude larger compared to the other tidal marsh sites. At the former locations, most biomass is located below ground, while at the latter locations the majority of the vegetation biomass is located above ground.
3.3 Soil organic carbon depth profiles
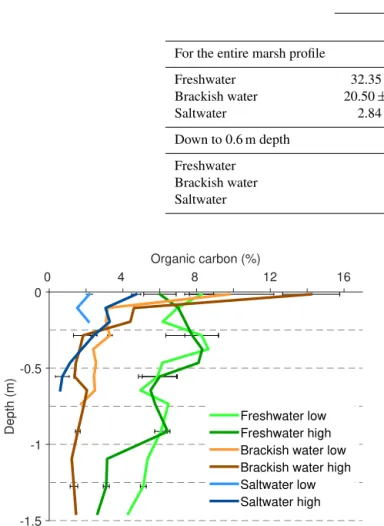
con-Table 3.Total organic carbon (OC) stock (kg OC m−2)and standard deviations calculated for the full vertical sampling profiles (depths used for calculations are given in brackets) and the upper 0.6 m.
OC stock (kg OC m−2)
Low marsh High marsh
For the entire marsh profile
Freshwater 32.35±0.65 (1.2 m) 46.44±0.80 (1.4 m)
Brackish water 20.50±0.72 (0.75 m) 32.23±0.31 (1.4 m)
Saltwater 2.84±0.10 (0.2 m) 9.93±0.34 (0.6 m)
Down to 0.6 m depth
Freshwater 16.38±0.54 21.66±0.71
Brackish water 18.63±0.71 19.63±0.27
Saltwater – 9.93±0.34
Organic carbon (%)
0 4 8 12 16
Depth (m)
-1.5 -1 -0.5 0
Freshwater low Freshwater high Brackish water low Brackish water high Saltwater low Saltwater high
Figure 5. Depth profiles of OC concentration for all study sites. Data points show the average of three replicate soil samples. Error bars for specific depths represent the standard deviation.
centration with depth, the brackish and salt marshes show a sharp decrease in OC concentration in the upper 0.25 m.
3.4 Soil organic carbon inventories
The highest total SOC stocks are found in the freshwater marshes, followed by the brackish and salt marshes (Table 3). For every marsh, SOC stocks are greater for the high marsh compared to the low marsh, as a consequence of both deeper marsh soils and higher SOC concentrations. In order to com-pare the marshes directly to each other the stocks down to the largest common depth have been calculated (Table 3). Using this approach, freshwater and brackish marshes have com-parable SOC stocks, while both locations on the salt marsh have significantly lower stocks. Depth profiles of cumulative SOC stocks per 0.01 m layer, after interpolation as explained in Sect. 2.4, are shown in Fig. S2.
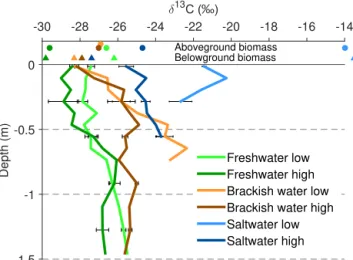
3.5 Stable carbon isotopes
The depth profiles of stable OC isotopes (δ13C) are shown in Fig. 6, together with theδ13C signal of above- and below-ground vegetation (data onδ13C is provided in the Supple-ment). In general an increase inδ13C values with depth is observed, although deviations from this pattern occur along the profiles. For all sites except the low salt marsh, which is characterized bySpartina anglicavegetation (C4 type), the δ13C signal of SOC in the topsoil layer is similar to theδ13C signal of standing vegetation. However, a close inspection shows differences. On the high freshwater marsh the top-soilδ13C signal is higher than the signal for both above- and below-ground vegetation, while on the low freshwater marsh the topsoilδ13C signal is lower than the above- and below-ground vegetation signal. On both the low and high brackish marshes, the topsoilδ13C is very similar to theδ13C signal of roots, while it is about 1 ‰ lower compared to theδ13C sig-nal of above-ground vegetation. On the high salt marsh, the topsoilδ13C signal has a value in between theδ13C signals of above- and below-ground vegetation, while on the low salt marsh the topsoilδ13C signal is significantly lower compared to the signal of both above- and below-ground vegetation.
4 Discussion
4.1 Observed patterns in SOC storage
While our data do not allow for a full statistical or mecha-nistic analysis of the mechanisms controlling the long-term storage of SOC in the studied tidal marshes, some impor-tant observations can be made. A first observation is that low SOC stocks are not systematically related to low biomass production, as no statistical relationship between total an-nual biomass production (above and below ground) and SOC stocks is found (R2=0.01, Fig. S3). For example, the annual
an-δ13
-30 -28 -26 -24 -22 -20 -18 -16 -14
Depth (m)
-1.5 -1 -0.5 0
Aboveground biomass Belowground biomass
Freshwater low Freshwater high Brackish water low Brackish water high Saltwater low Saltwater high
Figure 6.Depth profiles ofδ13C, together with theδ13C signal of above-ground (circles) and below-ground (triangles) biomass (val-ues are provided in Table S2). Error bars represent the standard de-viation.
glica) is relatively high (Fig. 4), while this site is character-ized by the lowest SOC stocks. In addition, there is no re-lationship between annual root carbon production and SOC stocks (R2=0.004, data not shown). This is rather
surpris-ing, as it has been proposed that roots contribute significantly to the subsoil OC pool in tidal marshes (Craft, 2007; Sainti-lan et al., 2013).
A second important observation is the very rapid crease of SOC with depth at the brackish sites. This de-crease is accompanied by a shift inδ13C to less negative val-ues with depth in the topsoil of these marshes, suggesting that on the brackish marshes a significant fraction of OC is rapidly decomposed after burial (Fig. 6). On the high brack-ish marsh the decline in SOC and the shift in δ13C show the same tendency towards a depth of 0.3 m, while deeper along the profile, both variables remain approximately con-stant with depth. This indicates that a significant fraction (approx. 87 %) of deposited OC is decomposed in this top layer. In the low brackish marsh sediments the situation is different. Here the SOC concentration only decreases from the top of the profile down to a depth of 0.15 m, while the δ13C signal increases throughout the profile. At this location
Spartina anglica (a C4 plant) was possibly present during early marsh development, resulting in a more positiveδ13C signal (Boschker et al., 1999; Middelburg et al., 1997). Cur-rentlyElymus athericus, a C3 plant, is dominating the marsh vegetation. This implies that the shift inδ13C with depth on the low brackish marsh could partly be the result of a shift from a C4 to C3 type vegetation, rather than resulting from the decomposition of SOC alone. This is very likely, as shifts inδ13C as a consequence of kinetic fractionation during de-composition are generally of the order of 1–3 ‰ (Choi et al., 2001), while the shift we observe is much larger (ca. 5.7 ‰). However, the decrease in SOC together with the shift inδ13C
in the top 0.15 m suggests that, also on this marsh, significant decomposition of deposited OC (approx. 68 %) took place after burial. It should be noted that theδ13C signal of the most recent sediments found on the intertidal areas can vary throughout the year (Zetsche et al., 2011). However, theδ13C depth profiles we observe are an integration of these annual cycles, limiting the effect of the timing of sample collection on the observed depth profiles ofδ13C.
On the high salt marsh a significant decrease of SOC con-centration with depth also occurs. This is again accompanied by a shift inδ13C towards more positive values with depth. This location is currently characterized by a mixture of C3 type vegetation. It is uncertain, however, whether the isotopic shift with depth can entirely be attributed to kinetic fraction-ation caused by OC decay. It is likely that at the beginning of marsh growthSpartina anglicawas also present at this loca-tion, as it is currently present on the low part of this marsh. This would imply that, also at this location, the shift inδ13C with depth is the result of a combination of decomposition of OC and a shift in vegetation from C4 to C3 type.
Our observations indicate that on both the salt and brack-ish marshes a significant fraction of OC is lost after burial. Although in the brackish marsh sediments a larger fraction of OC is lost after burial compared to salt marshes, total SOC stocks in the brackish marsh sediments are significantly higher compared to the salt marshes.
On the freshwater marshes the situation is different. In both the low and high freshwater marsh sediments the decline in OC concentration with depth is very limited. In addition, theδ13C signal does not show a significant shift in the top 0.5 m of the soil profile. Below this depth there is a limited shift inδ13C toward more positive values, but the interpreta-tion of this pattern is complicated by the effect of previous land uses on the marsh (Fig. 3). These observations indicate that at both locations on the freshwater marsh there is limited decomposition of OC after burial.
4.2 Explanations for the observed patterns in soil organic carbon stocks
An explanation is needed for the differences in depth gradi-ents in both SOC stocks andδ13C between salt and brackish marshes on the one hand and freshwater marshes on the other hand. Several factors may contribute to these differences and their possible roles are discussed below.
4.2.1 Salinity
marsh in the Scheldt estuary showed that there was an inverse relationship between soil salinity and decomposition (Hem-minga et al., 1991). In addition, Hem(Hem-minga et al. (1991) con-cluded that there is no significant variation in cellulose de-composition in tidal marsh sediments along the brackish and saltwater portion of the Scheldt estuary.
4.2.2 Vegetation type
The type of vegetation present on the different marshes is an-other possible controlling factor, as it has been shown that the residues of different macrophytes have a different resistance against decomposition (Buth and de Wolf, 1985; Hemminga and Buth, 1991; Valery et al., 2004). One of the factors that determines the decomposition rate of plant material is the ni-trogen content, whereby plant material with a higher C : N ra-tio is generally more resistant to decomposira-tion (Hemminga and Buth, 1991; Jones et al., 2016; Webster and Benfield, 1986). The C : N ratio of the vegetation present on the salt marsh (values between 27 and 30) is significantly lower com-pared to the vegetation present on the brackish and freshwa-ter marshes (values between 33 and 55; Table S2). However, our OC andδ13C profiles suggest that decomposition rates are highest on the brackish marshes and lowest on the fresh-water marshes, while the vegetation present at these locations has comparable C : N ratios. Thus, there does not appear to be a direct relationship between the C : N ratio of the biomass and SOC decomposition.
Although our data do not allow us to isolate the effect of vegetation type on SOC stocks along the estuary, some im-portant observations can be made. Firstly, the low and high freshwater marsh have different vegetation types (P. aus-tralis and Salixresp.). However, both soils show a similar SOC profile. In addition, the high freshwater marsh, where annual biomass production is significantly lower, has the largest SOC stock. This indicates that the effect of local biomass production on SOC stock is limited in the fresh-water marshes. Secondly, both brackish marshes have the same vegetation type (E. athericus), while topsoil OC con-centrations and total SOC stocks on the high marsh are larger compared to the low marsh. In addition, the high marsh is characterized by a somewhat lower annual biomass produc-tion (although the difference is not statistically significant). Thus, variations in local biomass production do not explain the differences in SOC stock between young and old brack-ish marshes either. The presence ofSpartina anglicaon the low salt marsh is indeed likely to be responsible for the low SOC stocks. While Spartina anglica is characterized by a high net primary productivity, the organic material produced is known to be very labile (Boschker et al., 1999; Bouil-lon and Boschker, 2006; Middelburg et al., 1997). Taken to-gether, these observations indicate that local biomass produc-tion is not likely to be a dominant factor controlling overall variations in SOC stocks along the estuary as variations in OC stocks both along the salinity gradient of the estuary and
between old and young marshes at a given salinity level can-not be explained by variations in biomass production. The effect ofSpartina anglicaon the SOC stock of the low salt marsh shows, however, that in some cases the presence of a certain vegetation type may be a dominant factor.
4.2.3 Allochthonous organic carbon inputs along the estuary
The OC that is present in tidal marsh sediments is not only derived from autochthonous biomass. Estuaries are often characterized by relatively high concentrations of suspended sediment to which a significant amount of particulate or-ganic carbon (POC) is associated (Abril et al., 2002). Due to the long residence time of water in the Scheldt estuary (2–3 months, Soetaert and Herman, 1995), organic matter is in-tensively processed as it moves through the estuary (Abril et al., 2002; Middelburg and Herman, 2007). In addition, mix-ing between fluvial and marine particles takes place (Noltmix-ing et al., 1999; Regnier and Wollast, 1993). Overall, this leads to significant variations in both the quantity and the quality of the POC that is present in the water and deposited on the marshes. Clearly, this variation may not only affect the mag-nitude of the OC inputs but also the decomposability of the OC that is deposited.
The freshwater marshes are located near the upstream bor-der of the Scheldt estuary close to the maximum turbidity zone (MTZ), with average suspended sediment concentra-tions of ca. 0.15 g L−1 (Van Damme et al., 2001; Temmer-man et al., 2004). The suspended sediments in this zone con-tain 7–10 % POC (Abril et al., 2002). The higher values are observed in summer, when phytoplankton growth is impor-tant, while the lower values are reported in winter. The POC that is present in winter may be assumed to be processed POC of terrestrial origin (Hellings et al., 1999). In addition, during the past decades a large fraction of OC that has en-tered the freshwater portion of the estuary originated from untreated wastewater from the city of Brussels (Abril et al., 2002; Billen et al., 2005). It has, however, been shown that this OC is mineralized on a timescale of weeks, possibly even before it enters the estuary (Muylaert et al., 2005; Servais et al., 1987).
0
0.50
1.00
OC %
Dep
th
(m)
0
0.50
1.00
OC %
Dep
th
(m)
Allochthonous OC fraction Autochthonous OC fraction Total OC (a) Freshwater marsh (dE/dt = 1 cm yr-1)
(b) Salt marsh (dE/dt = 0.5 cm yr )-1
Figure 7.Conceptual diagram of the effect of both sediment de-position rate (dE /dt,E=elevation) and the relative inputs of re-calcitrant allochthonous organic carbon and labile autochthonous organic carbon on the fate of buried OC in a tidal freshwater marsh (a)and salt marsh(b).
the progressive downstream mineralization of OC but also by the upstream transport of marine sediments that carry less POC.
The variations in both suspended sediment concentration and POC content have important consequences for the rela-tive importance of allochthonous OC input on the marshes. On the freshwater marshes, both the high suspended sedi-ment concentration and high POC loadings lead to a combi-nation of high sedimentation rates (10–20 mm yr−1, with the highest sedimentation rates on the young marshes; Temmer-man et al., 2004) and high inputs of allochthonous POC. On the saltwater marshes, sedimentation rates are much lower (5–10 mm yr−1; Temmerman et al., 2004) and the deposited sediments contain 50–70 % less OC than the sediments de-posited on the freshwater marsh (Abril et al., 2002). Evi-dently, these differences may have important effects on OC storage in tidal marsh sediments (Fig. 7). It can reasonably be
assumed that the allochthonous POC that is deposited with the sediments on the freshwater marsh consists of a large fraction of terrestrial, recalcitrant POC. This POC may be ex-pected to have a high burial efficiency (i.e. it will decompose relatively slowly after burial) and will remain in the sedi-ments for a considerable time. The local, autochthonous POC is fresh and will therefore be less recalcitrant. As a conse-quence, it may be expected to decompose much more rapidly with time and contribute much less to long-term OC storage. The latter explains why variations in biomass production and vegetation type on the marshes (both now and in the past, Fig. 3) do not explain variations in SOC storage in different marsh environments. Furthermore, the decomposition rate of both autochthonous and allochthonous POC can be expected to be inversely related to the burial rate as rapid sedimen-tation will protect OC from decomposition (Hartnett et al., 1998; Wang et al., 2014). Thus, OC will be better preserved when sedimentation rates are high.
Figure 7 illustrates how these factors combine. One may indeed expect to find a much less steep decline of the OC content with depth on the freshwater marsh (Fig. 7a) due to (1) the dominance of allochthonous, recalcitrant OC and (2) the rapid burial of OC. Furthermore, a relatively large fraction of labile autochthonous OC may be preserved, as it is advected rapidly to deep sediment layers. On the salt and brackish marshes a low sedimentation rate combines with low OC contents of the deposited sediments (Fig. 7b). As a consequence, autochthonous OC is a dominant input, but this OC decomposes rapidly with depth. This results in a sig-nificant decline of OC content with depth, combined with a significant increase inδ13C due to kinetic isotopic fraction-ation. In a recent study, Hansen et al. (2016) also attributed decreasing SOC stocks with increasing salinity in the Elbe estuary (Germany) to a decreasing OC content of suspended sediments and decreasing macrophyte biomass with increas-ing salinity.
Thus, both sedimentation rate as well as the rate of al-lochthonous OC input to the marsh system appear to place important controls on OC preservation in marsh sediments. While other factors such as local biomass production and salinity gradients may also be locally important, they do not appear to be key controls in the Scheldt estuary as most au-tochthonous POC appears to decompose rapidly, indepen-dent of the specific environmental conditions. This finding is similar to the observations of Omengo et al. (2016), who found that the OC preserved at depth in floodplain sediments of the Tana River in Kenya consisted dominantly of cessed OC that was deposited by the river, while locally pro-duced OC contributed little to long-term OC preservation.
4.3 Effect of sampling procedure on reported estuarine OC stocks
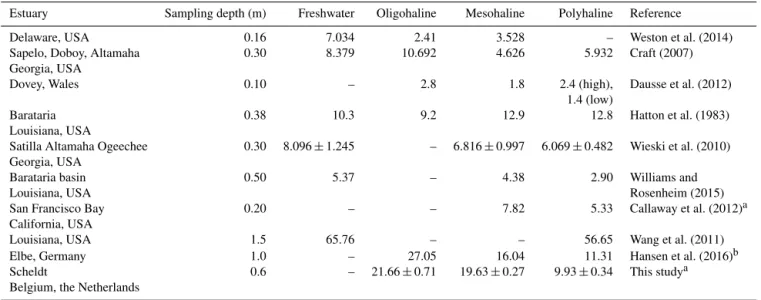
tem-Table 4.Reported SOC stocks (kg OC m−2)of tidal marsh soils along estuarine salinity gradients.
Estuary Sampling depth (m) Freshwater Oligohaline Mesohaline Polyhaline Reference
Delaware, USA 0.16 7.034 2.41 3.528 – Weston et al. (2014)
Sapelo, Doboy, Altamaha 0.30 8.379 10.692 4.626 5.932 Craft (2007)
Georgia, USA
Dovey, Wales 0.10 – 2.8 1.8 2.4 (high), Dausse et al. (2012)
1.4 (low)
Barataria 0.38 10.3 9.2 12.9 12.8 Hatton et al. (1983)
Louisiana, USA
Satilla Altamaha Ogeechee 0.30 8.096±1.245 – 6.816±0.997 6.069±0.482 Wieski et al. (2010)
Georgia, USA
Barataria basin 0.50 5.37 – 4.38 2.90 Williams and
Louisiana, USA Rosenheim (2015)
San Francisco Bay 0.20 – – 7.82 5.33 Callaway et al. (2012)a
California, USA
Louisiana, USA 1.5 65.76 – – 56.65 Wang et al. (2011)
Elbe, Germany 1.0 – 27.05 16.04 11.31 Hansen et al. (2016)b
Scheldt 0.6 – 21.66±0.71 19.63±0.27 9.93±0.34 This studya
Belgium, the Netherlands
aData for high marshes only.bAverage for all unmanaged sites.
perate estuary, with freshwater marshes having the highest stocks, followed by brackish and salt marshes (Fig. 5 and Ta-ble 3). This tendency is in agreement with observations in other studies (Table 4). However, the differences reported in previous studies are almost always much smaller than the dif-ferences we find. As the estuaries reported in Table 4 cover a large geographical range, differences in environmental con-ditions will have an influence on the reported SOC stocks. For example, the estuaries reported in Table 4 that are located along the southern coast of the USA experience significantly higher average temperatures compared to the Scheldt estu-ary. In addition, the vegetation species present on the tidal marshes, as well as differences in regional geology and estu-arine morphology, will play a role. However, as the studies listed in Table 4 report SOC stocks in tidal marsh sediments along a salinity gradient, similarities in the factors control-ling these stocks are also present. For example, the fresh-water marshes will receive considerably more OC from ter-restrial sources, while the influence of OC inputs from ma-rine sources will be the largest in the salt marshes. Moreover, macrophyte production is generally considerably higher at freshwater marshes compared to salt marshes (e.g. Dausse et al., 2012; Hansen et al., 2016).
In addition to these factors, differences in sampling pro-cedures can also explain some discrepancies. In most stud-ies, marshes were sampled to a limited depth (Table 4). Generally, the differences in SOC content between different marshes reported in Table 4 are smallest for the top layers and increase with depth. As a consequence, the difference in SOC inventory will increase if a larger sampling depth is considered. Evidently, considering a larger sampling depth will also lead to higher estimates of SOC stocks. This is one of the factors explaining why our stock estimates are gener-ally much higher than those reported in the other studies in
Table 4, especially for the freshwater marshes, and why we find larger differences in total SOC stocks between different marshes.
It is important to consider whether carbon stocks should be compared by calculating stocks down to a certain depth or whether the total stock present in the marsh sediments should be taken into account. While it is simpler and more transparent to consider a certain depth, this approach does not account for the differences in dynamics between marshes. As Fig. 2 shows, marsh accumulation rates are significantly higher for the freshwater marshes. This automatically im-plies that, when different marshes are sampled to a common depth, the time frame that is accounted for will be shorter for those marshes that have the highest accumulation rates (Elschot et al., 2015). We suggest that the establishment of a correct time frame, from which sedimentation rates and their variations over time can be deduced, is indispensable for a correct interpretation of differences in SOC stocks (as well as C sequestration rates) between marshes.
4.4 Implications of sea level rise for estuarine soil organic carbon stocks
marshes is likely to decline after sea level rise (Barendregt and Swarth, 2013). As we have shown that SOC sequestra-tion rates are the largest in the freshwater porsequestra-tion of the es-tuary, the amount of OC sequestration in the estuary is there-fore likely to decline with sea level rise. Moreover, as a con-sequence of the upstream migration of the MTZ, terrestrial organic matter will not be able to travel as far downstream in the estuary. Therefore, tidal marshes which are now located at the downstream end of the MTZ will receive less stable terrestrial OC in the future. On the other hand, overall sed-imentation rates are expected to increase with a rising sea level, which will automatically lead to an increase in the rate of OC deposition as well as of OC burial rates, resulting in an increase of the OC sequestration rate per unit surface area. Saltwater intrusion can also influence the decomposition of previously sequestered OC, with some studies conclud-ing that saltwater intrusion will enhance decomposition of organic matter (Craft, 2007; Morrissey et al., 2014; Weston et al., 2006, 2011), while others find that decomposition rates will decrease (Hemminga et al., 1991). From these studies and from the analysis by Chambers et al. (2011), it is clear that this effect is highly dependent on local factors, such as the concentration of elements in the sea water that intrudes the estuary. Therefore, no reliable estimation of the impact of saltwater intrusion on OC mineralization in the Scheldt estuary can be made.
The above illustrates that our current understanding of the future evolution of the Scheldt estuary is still insufficient to make a quantitative assessment of how SOC stocks in the tidal marsh environment may change in the future.
5 Conclusions
As reported data on estuarine gradients of SOC are very scarce and, more importantly, often based on shallow soil sampling, additional research is needed to better constrain estimates of global estuarine OC stocks. This study shows that the quantification of SOC stocks in tidal marsh sedi-ments critically depends on the sampling depth. Gradients in SOC concentrations with depth strongly vary between marsh types, so a full inventory can only be made if sampling is car-ried out over the entire depth of the marsh sediments. Even if such data are available, interpretation has to be done with care, as sedimentation rates may vary considerably within a single estuary, making it complex to convert inventories to sedimentation or preservation rates. In the Scheldt estu-ary, total SOC stocks are largest in a freshwater and brack-ish tidal marsh and significantly lower in a saltwater marsh. These variations are to some extent controlled by variations in autochthonous biomass production, but our data strongly suggest that the key control on long-term OC preservation is the relative contribution of terrestrial, allochthonous OC to the total OC input, while OC burial rate may also be im-portant. The impact of future sea level rise on OC stocks in
tidal marsh sediments will be determined by an interplay of different factors, including the evolution of the spatial extent of marshes in different salinity zones and sediment and OC deposition rates. Our study allowed us to identify the factors that are important controls on OC storage but further research may be needed to resolve this issue.
6 Data availability
The following data are provided in the Supplement: depth profiles of (i) bulk density, (ii) OC,δ13C and CN values and (iii) grain size in Excel format and (iv) data on vegetation characteristics and sample locations in pdf format.
The Supplement related to this article is available online at doi:10.5194/bg-13-6611-2016-supplement.
Competing interests. The authors declare that they have no conflict of interest.
Acknowledgements. We would like to thank Lore Fondu and Jianlin Zhao for their much-appreciated help during fieldwork and lab analysis. We are also grateful to Natuurpunt, Staatsbosbeheer Zeeland and Stichting het Zeeuwse Landschap for providing us with the opportunity to sample the tidal marshes. Furthermore, we thank one anonymous reviewer and M. Schwarz for their constructive comments on the manuscript.
Edited by: C. Woulds
Reviewed by: M. Schwartz and one anonymous referee
References
Abril, G., Nogueira, M., Etcheber, H., Cabeçadas, G., Lemaire, E., and Brogueira, M.: Behaviour of Organic Carbon in Nine Con-trasting European Estuaries, Estuar. Coast. Shelf Sci., 54, 241– 262, doi:10.1006/ecss.2001.0844, 2002.
Barendregt, A. and Swarth, C. W.: Tidal Freshwater Wet-lands: Variation and Changes, Estuar. Coast., 36, 445–456, doi:10.1007/s12237-013-9626-z, 2013.
Billen, G., Garnier, J., and Rousseau, V.: Nutrient fluxes and water quality in the drainage network of the Scheldt basin over the last 50 years, Hydrobiologia, 540, 47–67, doi:10.1007/s10750-004-7103-1, 2005.
Bouillon, S. and Boschker, H. T. S.: Bacterial carbon sources in coastal sediments: a cross-system analysis based on sta-ble isotope data of biomarkers, Biogeosciences, 3, 175–185, doi:10.5194/bg-3-175-2006, 2006.
Bridgham, S. D., Megonigal, J. P., Keller, J. K., Bliss, N. B., and Trettin, C.: The carbon balance of North American wetlands, Wetlands, 26, 889–916, 2006.
Buth, G. J. C., and de Wolf, L.: Decomposition of Spartina anglica, Elytrigia pungens and Halimione portulacoides in a Dutch salt marsh in association with faunal and habitat influences, Vegeta-tio, 62, 337–355, doi:10.1007/BF00044761, 1985.
Callaway, J. C., Borgnis, E. L., Turner, R. E., and Milan, C. S.: Carbon Sequestration and Sediment Accretion in San Fran-cisco Bay Tidal Wetlands, Estuar. Coast., 35, 1163–1181, doi:10.1007/s12237-012-9508-9, 2012.
Chambers, L. G., Reddy, K. R., and Osborne, T. Z.: Short-Term Response of Carbon Cycling to Salinity Pulses in a Freshwater Wetland, Soil Sci. Soc. Am. J., 75, 2000, doi:10.2136/sssaj2011.0026, 2011.
Cherry, J. A., McKee, K. L., and Grace, J. B.: Elevated CO2 en-hances biological contributions to elevation change in coastal wetlands by offsetting stressors associated with sea-level rise, J. Ecol., 97, 67–77, doi:10.1111/j.1365-2745.2008.01449.x, 2009. Chmura, G. L., Anisfeld, S. C., Cahoon, D. R., and Lynch, J. C.:
Global carbon sequestration in tidal, saline wetland soils, Global Biogeochem. Cy., 17, 22-1–22-12, doi:10.1029/2002gb001917, 2003.
Choi, Y., Hsieh, Y., and Wang, Y.: Vegetation succession and car-bon sequestration in a coastal wetland in northwest Florida: Ev-idence from carbon isotopes, Global Biogeochem. Cy., 15, 311– 319, 2001.
Craft, C.: Freshwater input structures soil properties, verti-cal accretion, and nutrient accumulation of Georgia and U.S tidal marshes, Limnol. Oceanogr., 52, 1220–1230, doi:10.4319/lo.2007.52.3.1220, 2007.
Dausse, A., Garbutt, A., Norman, L., Papadimitriou, S., Jones, L. M., Robins, P. E., and Thomas, D. N.: Biogeochem-ical functioning of grazed estuarine tidal marshes along a salinity gradient, Estuar. Coast. Shelf Sci., 100, 83–92, doi:10.1016/j.ecss.2011.12.037, 2012.
De Leeuw, J., Olff, H., and Bakker, J. P.: Year-to-Year variation in peak above-ground biomass of six salt-marsh angiosperm com-munities as related to rainfall deficit and inundation frequency, Aquat. Bot., 36, 139–151, 1990.
Donato, D. C., Kauffman, J. B., Murdiyarso, D., Kurnianto, S., Stidham, M., and Kanninen, M.: Mangroves among the most carbon-rich forests in the tropics, Nat. Geosci., 4, 293–297, doi:10.1038/ngeo1123, 2011.
Duarte, C. M., Losada, I. J., Hendriks, I. E., Mazarrasa, I., and Marbà, N.: The role of coastal plant communities for climate change mitigation and adaptation, Nature Climate Change, 3, 961–968, doi:10.1038/nclimate1970, 2013.
Elschot, K., Bakker, J. P., Temmerman, S., Van De Koppel, J., and Bouma, T. J.: Ecosystem engineering by large grazers enhances carbon stocks in a tidal salt marsh, Mar. Ecol.-Prog. Ser., 537, 9–21, doi:10.3354/meps11447, 2015.
Fagherazzi, S., Kirwan, M. L., Mudd, S. M., Guntenspergen, G. R., Temmerman, S., Rybczyk, J. M., Reyes, E., Craft, C., and Clough, J.: Numerical models of salt marsh evolution:
Ecologi-cal, geormorphic, and climatic factors, Rev. Geophys., 50, 1–28, doi:10.1029/2011RG000359, 2012.
Govers, G., Merckx, R., Van Oost, K., and van Wesemael, B.: Man-aging Soil Organic Carbon for Global Benefits: A STAP Tech-nical Report, Global Environmental Facility, Washington, D.C., 2013.
Groenendijk, A. M.: Primary production of 4 dominant salt-marsh angiosperms in the southwestern Netherlands, Vegetatio, 57, 143–152, 1984.
Hansen, K., Butzeck, C., Eschenbach, A., Gröngröft, A., Jensen, K., and Pfeiffer, E. M.: Factors influencing the organic carbon pools in tidal marsh soils of the Elbe estuary (Germany), J. Soils Sediments, 1–14, doi:10.1007/s11368-016-1500-8, 2016. Hartnett, H. E., Keil, R. G., Hedges, J. I., and Devol, A. H.:
Influ-ence of oxygen exposure time on organic carbon preservation in continental margin sediments, Nature, 391, 572–574, 1998. Hatton, R. S., Delaune, R. D., and Patrick, W. H. J.:
Sedimentation, accretion, and subsidence in marshes of Barataria Basin, Louisiana, Limnol. Oceanogr., 28, 494–502, doi:10.4319/lo.1983.28.3.0494, 1983.
Hellings, L., Dehairs, F., Tackx, M., Keppens, E., and Baeyens, W.: Origin and fate of organic carbon in the freshwater part of the Scheldt Estuary as traced by stable carbon isotope composition, Biogeochemistry, 47, 167–186, 1999.
Hemminga, M. A. and Buth, G. J. C.: Decomposition in Salt Marsh Ecosystems of the S.W. Netherlands: The Effects of Biotic and Abiotic Factors, Vegetatio, 92, 73–83, 1991.
Hemminga, M. A., De Leeuw, J., De Munck, W., and Kout-staal, B. P.: Decomposition in estuarine salt marshes: the ef-fect of soil salinity and soil water content, Vegetatio, 94, 25–33, doi:10.1007/BF00044913, 1991.
Jones, J. A., Cherry, J. A., and Mckee, K. L.: Species and tissue type regulate long-term decomposition of brackish marsh plants grown under elevated CO2conditions, Estuar. Coast. Shelf Sci., 169, 38–45, doi:10.1016/j.ecss.2015.11.033, 2016.
Kirwan, M. L. and Blum, L. K.: Enhanced decomposition offsets enhanced productivity and soil carbon accumulation in coastal wetlands responding to climate change, Biogeosciences, 8, 987– 993, doi:10.5194/bg-8-987-2011, 2011.
Kirwan, M. L. and Mudd, S. M.: Response of salt-marsh car-bon accumulation to climate change, Nature, 489, 550–553, doi:10.1038/nature11440, 2012.
Kopp, R. F., Abrahamson, L. P., White, E. H., Volk, T. A., Nowak, C. A., and Fillhart, R. C.: Willow biomass production during ten successive annual harvests, Biomass Bioenerg., 20, 1–7, doi:10.1016/S0961-9534(00)00063-5, 2001.
Mcleod, E., Chmura, G. L., Bouillon, S., Salm, R., Björk, M., Duarte, C. M., Lovelock, C. E., Schlesinger, W. H., and Silli-man, B. R.: A blueprint for blue carbon: toward an improved un-derstanding of the role of vegetated coastal habitats in sequester-ing CO2, Front. Ecol. Environ., 9, 552–560, doi:10.1890/110004, 2011.
Meire, P., Ysebaert, T., Van Damme, S., Van Den Bergh, E., Maris, T., and Struyf, E.: The Scheldt estuary: A description of a chang-ing ecosystem, Hydrobiologia, 540, 1–11, doi:10.1007/s10750-005-0896-8, 2005.
Schelde Estuary, Mar. Chem., 60, 217–225, doi:10.1016/S0304-4203(97)00104-7, 1998.
Middelburg, J. J. and Herman, P. M. J.: Organic matter processing in tidal estuaries, Mar. Chem., 106, 127–147, doi:10.1016/j.marchem.2006.02.007, 2007.
Middelburg, J. J., Nieuwenhuize, J., Lubberts, R. K., van de Plass-che, O., and VandeplassPlass-che, O.: Organic carbon isotope system-atics of coastal marshes, Estuar. Coast. Shelf Sci., 45, 681–687, doi:10.1006/ecss.1997.0247, 1997.
Morrissey, E. M., Gillespie, J. L., Morina, J. C., and Franklin, R. B.: Salinity affects microbial activity and soil organic matter content in tidal wetlands, Glob. Change Biol., 20, 1351–1362, doi:10.1111/gcb.12431, 2014.
Muylaert, K., Dasseville, R., De Brabandere, L., Dehairs, F., and Vyverman, W.: Dissolved organic carbon in the freshwater tidal reaches of the Schelde estuary, Estuar. Coast. Shelf Sci., 64, 591– 600, doi:10.1016/j.ecss.2005.04.010, 2005.
Nelleman, C., Corcoran, E., Duarte, E., Valdés, L., De Young, C., Fonseca, L., and Grimsditch, G. (Eds.): Blue carbon, United Na-tions Environment Programme, GRID-Arendal, 2009.
Neubauer, S. C.: Contributions of mineral and organic components to tidal freshwater marsh accretion, Estuar. Coast. Shelf Sci., 78, 78–88, doi:10.1016/j.ecss.2007.11.011, 2008.
Nolting, R. F., Helder, W., De Baar, H. J. W., and Gerringa, L. J. A.: Contrasting behaviour of trace metals in the Scheldt estu-ary in 1978 compared to recent years, J. Sea Res., 42, 275–290, doi:10.1016/S1385-1101(99)00036-2, 1999.
Omengo, F. O., Geeraert, N., Bouillon, S., and Govers, G.: Depo-sition and fate of organic carbon in floodplains along a tropical semiarid lowland river (Tana River, Kenya), J. Geophys. Res.-Biogeo., 121, 1131–1143, doi:10.1002/2015JG003288, 2016. Pendleton, L., Donato, D. C., Murray, B. C., Crooks, S., Jenkins,
W. A., Sifleet, S., Craft, C., Fourqurean, J. W., Kauffman, J. B., Marbà, N., Megonigal, P., Pidgeon, E., Herr, D., Gordon, D., and Baldera, A.: Estimating Global “Blue Carbon” Emissions from Conversion and Degradation of Vegetated Coastal Ecosystems, PLoS One, 7, e43542, doi:10.1371/journal.pone.0043542, 2012. Poffenbarger, H. J., Needelman, B. A., and Megonigal, J. P.: Salinity influence on methane emissions from tidal marshes, Wetlands, 31, 831–842, doi:10.1007/s13157-011-0197-0, 2011.
Regnier, P. and Wollast, R.: Distribution of Trace-Metals in Sus-pended Matter of the Scheldt Estuary, Mar. Chem., 43, 3–19, doi:10.1016/0304-4203(93)90212-7, 1993.
Robins, P. E., Skov, M. W., Lewis, M. J., Giménez, L., Davies, A. G., Malham, S. K., Neill, S. P., McDonald, J. E., Whit-ton, T. A., Jackson, S. E., and Jago, C. F.: Impact of cli-mate change on UK estuaries: A review of past trends and potential projections, Estuar. Coast. Shelf Sci., 169, 119–135, doi:10.1016/j.ecss.2015.12.016, 2016.
Rocha, A. V. and Goulden, M. L.: Why is marsh productivity so high? New insights from eddy covariance and biomass measure-ments in a Typha marsh, Agr. Forest Meteorol., 149, 159–168, doi:10.1016/j.agrformet.2008.07.010, 2009.
Ross, A. C., Najjar, R. G., Li, M., Mann, M. E., Ford, S. E., and Katz, B.: Sea-level rise and other influences on decadal-scale salinity variability in a coastal plain estuary, Estuar. Coast. Shelf Sci., 157, 79–92, doi:10.1016/j.ecss.2015.01.022, 2015. Saintilan, N., Rogers, K., Mazumder, D., and Woodroffe,
C.: Allochthonous and autochthonous contributions to
car-bon accumulation and carcar-bon store in southeastern Aus-tralian coastal wetlands, Estuar. Coast. Shelf Sci., 128, 84–92, doi:10.1016/j.ecss.2013.05.010, 2013.
Scharlemann, J. P., Tanner, E. V., Hiederer, R., and Kapos, V.: Global soil carbon: understanding and managing the largest terrestrial carbon pool, Carbon Manag., 5, 81–91, doi:10.4155/cmt.13.77, 2014.
Servais, P., Billen, G., and M.-C., H.: Determination of the biodegradable fraction of dissolved organic matter in waters, Wa-ter Res., 21, 445–450, 1987.
Soetaert, K. and Herman, P. M. J.: Estimating estuarine residence times in the Westerschelde (The Netherlands) using a box model with fixed dispersion coefficients, Hydrobiologia, 311, 215–224, doi:10.1007/BF00008582, 1995.
Temmerman, S., Govers, G., Meire, P., and Wartel, S.: Mod-elling long-term tidal marsh growth under changing tidal con-ditions and suspended sediment concentrations, Scheldt estu-ary, Belgium, Mar. Geol., 193, 151–169, doi:10.1016/S0025-3227(02)00642-4, 2003.
Temmerman, S., Govers, G., Wartel, S., and Meire, P.: Modelling estuarine variations in tidal marsh sedimentation: response to changing sea level and suspended sediment concentrations, Mar. Geol., 212, 1–19, doi:10.1016/j.margeo.2004.10.021, 2004. Tolman, M. E. and Pranger, D. P.: Toelichting bij de
Vegetatiekarter-ing Westerschelde 2010, Rijkswaterstaat, Ministerie van verkeer en Waterstaat, Delft, 2012.
Valery, L., Bouchard, V., and Lefeuvre, J. C.: Impact of the invasive native species Elymus athericus on carbon pools in a salt marsh, Wetlands, 24, 268–276, doi:10.1672/0277-5212(2004)024[0268:IOTINS]2.0.CO;2, 2004.
Van Braeckel, A., Coen, L., Peeters, P., Plancke, Y., Mikkelsen, J., and Van den Bergh, E.: Historische evolutie van Zeescheldehabi-tats, Kwantitatieve en kwalitatieve analyse van invloedsfactoren. Rapporten van het Instituut voor Natuur- en Bosonderzoek (59), Instituut voor Natuur- en Bosonderzoek, Brussel i.s.m. het Wa-terbouwkundig Laboratorium, Antwerpen, 2012.
Van Damme, S., De Winder, B., Ysebaert, T., and Meire, P.: Het “bi-jzondere” van de Schelde: de abiotiek van het Schelde-estuarium, Levende Nat., 102, 37–39, 2001.
Van Damme, S., Struyf, E., Maris, T., Ysebaert, T., Dehairs, F., Tackx, M., Heip, C., and Meire, P.: Spatial and temporal pat-terns of water quality along the estuarine salinity gradient of the Scheldt estuary (Belgium and The Netherlands): results of an integrated monitoring approach, Hydrobiologia, 540, 29–45, doi:10.1007/s10750-004-7102-2, 2005.
Wang, J. J., Dodla, S. K., Delaune, R. D., Hudnall, W. H., and Cook, R. L.: Soil carbon characteristics in two Mississippi river deltaic Marshland profiles, Wetlands, 31, 157–166, doi:10.1007/s13157-010-0130-y, 2011.
Wang, Z., Van Oost, K., and Govers, G.: Predicting the long-term fate of buried organic carbon in colluvial soils, Global Bio-geochem. Cy., 29, 65–79, doi:10.1002/2014GB004912, 2014. Webster, J. R. and Benfield, E. F.: Vascular Plant Breakdown in
Freshwater Ecosystems, Annu. Rev. Ecol. Syst., 17, 567–594, 1986.
Weston, N. B., Vile, M. A., Neubauer, S. C., and Velinsky, D. J.: Ac-celerated microbial organic matter mineralization following salt-water intrusion into tidal freshsalt-water marsh soils, Biogeochem-istry, 102, 135–151, doi:10.1007/s10533-010-9427-4, 2011. Weston, N. B., Neubauer, S. C., Velinsky, D. J., and Vile, M. A.: Net
ecosystem carbon exchange and the greenhouse gas balance of tidal marshes along an estuarine salinity gradient, Biogeochem-istry, 120, 163–189, doi:10.1007/s10533-014-9989-7, 2014. Whigham, D. F.: Primary Production in Tidal Freshwater
Wet-lands, in Tidal freshwater wetWet-lands, edited by: Barendregt, A., Whigham, D., and Baldwin, A., 320 pp., Margraf Publishers GmbH, 2009.
Wieski, K., Guo, H. Y., Craft, C. B., and Pennings, S. C.: Ecosys-tem Functions of Tidal Fresh, Brackish, and Salt Marshes on the Georgia Coast, Estuar. Coast., 33, 161–169, doi:10.1007/s12237-009-9230-4, 2010.
Williams, E. K. and Rosenheim, B. E.: What happens to soil organic carbon as coastal marsh ecosystems change in response to increasing salinity? An exploration using ramped pyrolysis, Geochem. Geophy. Geosy., 16, 2322–2335, doi:10.1002/2015GC005839, 2015.
Woodwell, G. M., Rich, P. H., and Mall, C. S. A.: Carbon in estu-aries, in Carbon and the Biosphere, edited by: Woodwell, G. M. and Pecari, E. V., US AEC, 1973.