ANALYSIS OF SPATIAL-TEMPORAL VARIATION OF LAND SURFACE TEMPERATURE,
VEGETATION AND SNOW COVER IN LAR NATIONAL PARK OF IRAN
M. Arekhi a, *
a PhD Student, Faculty of Forestry, Department of Surveying and Photogrammetry, Istanbul University, Turkey, 34473 Bahçeköy,
Istanbul (Turkey) -maliheh.arekhi@ogr.iu.edu.tr
KEY WORDS: Climate Change, NDVI, Vegetation Indices, Normalized Difference Snow Index, Lar National Park, Remote Sensing, Landsat
ABSTRACT:
Changes in land surface reflectance measured by remote sensing data can be useful in climate change studies. This study attempts to analyze the spatial-temporal extent change of vegetation greenness, Land Surface Temperature (LST), and Normalized Difference Snow Index (NDSI) in late spring at the Lar National Park of Iran using Landsat data. Vegetation indices (VIs), LST, and NDSI maps were calculated for each date (1985, 1994, 2010, and 2015). All VIs have shown an increasing trend from 1985 to 2015 which depicted increase of vegetation. Spectral reflectance of all bands is declining from 1985 to 2015 except in near-infrared (NIR) bands. High reflectance in NIR bands is due to increased vegetation greenness. The reduction was seen in the visible bands that show increased vegetation photosynthetic activity. In the short-wave infrared bands (SWIR) were observed reduced trend from 1985 to 2015 which is indicate increased vegetation. Also, in the mid-wave infrared(MWIR) bands were observed a declining trend which is the result of decreasing soil fraction from 1985 to 2015. LST has increased from 23.27 °C in 1985 to 27.45 °C in 2015. Snow patches were decreased over the study period. In conclusion, VIs and surface reflectance bands are considered the main tool to display vegetation change. Also, high VIs values showed healthy and dense vegetation. The results of our study will provide valuable information in preliminary climate change studies.
1. INTRODUCTION
High mountains as a reservoir play a vital role in regional hydrological, biogeochemical, and atmospheric processes in rangeland ecosystems. Since the mid-twentieth century, these pristine areas have been experiencing earlier snowmelt with increased vegetation greenness by changed land surface temperature due to global warming. Thus, mountain areas are considered for climate change studies by researchers (Walker et al. 1993, Mote 2006, Jain et al. 2011, Cowie 2012, Paudel and Andersen 2013). Several researchers have reported the change of snowmelt time due to increased temperature which is leading to increased vegetation greenness (Dye and Tucker 2003, I 2013, Hall et al. 2015). However, there is evidence of climate change impacts on natural rangelands ofIran, such as decrease of spring water, reduction of forage production, and increase in plant diseases. In addition, it should be considered that climate change in Iran’s rangeland will affect approximately 81 million various livestock that depends on rangelands to supply water and food (UNFCCC2002, Amiri et al. 2010)
Vegetation phenology and production in the cold and wet rangelands primarily determined by the accumulation of snowmelt. The time of snow cover indirectly controls the distribution of many plant species by enhancing the length of the growing season (Billings and Bliss 1959, May et al. 1982, Paudel and Andersen 2013, Choler 2015). Increasing temperature may result in a sped up snow melting and is at least partly responsible for enhancing vegetation activities. A warming trend is likely to increase interactions between alterations in snow cover and vegetation activities in spring (Dye and Tucker 2003, Dong et al. 2013, Wang et al. 2015).
Over the past four decades, remote sensing as a useful tool has provided a valuable data source for monitoring the changing terrestrial ecosystems. Remote sensing data are inexpensive and available at various temporal and spatial resolution (Turner et al. 1999, Mróz and Sobieraj 2004). Simultaneously, numerous remote sensing studies have used remote sensing data for studying the interaction between land surface temperature (LST) with vegetation and snow cover (Minder 2010, Maeda 2014, Park et al. 2016).
Changes in land surface reflectance can be correlated with variation in vegetative cover and plant health (Silleos et al. 2006, Sawyer 2015). Vegetation Spectral reflectance can be effectively measured using vegetation indices (VIs) by remote sensing data to analyze ecological properties of vegetation. Moreover, it is possible generating the VIs time series data during the several periods (Dutrieux et al. 2012). The Normalized Difference Vegetation Index (NDVI) relates the visible and the near-infrared reflectance of the different features of the earth’s surface (Wessman 1992).
In regions where water availability is not a limiting factor, higher temperatures are expected to allow for plant upslope migration and increased vegetative cover (Sawyer and Stephen 2014), shrub expansion (Fraser et al. 2014) and earlier snowmelt (Choler 2015). Lillesand et al. 2014 stated that “the normalized difference vegetation index is preferred to the simple index for global vegetation monitoring because the NDVI helps compensate for changing illumination conditions, surface slope, aspect, and other extraneous factors”.
visible (green) and short-wave infrared (SWIR) regions of the electromagnetic spectrum. It should be noted that one of the main advantages of NDSI is that it can be specified and map the snow cover even in mountain shadows. In addition, the reflectance of clouds remains high in the SWIR band; thus, the NDSI has the ability to discriminate between cloud and snow covered areas (Dozier 1989, Butt 2012).
The relationship between vegetation greenness and the thermal characteristic has been assessed for examining the impact of temperature on vegetation (Goetz 1997, Vlassova and Pérez-Cabello 2016). Land surface temperature (LST) derived from satellite remotely sensed thermal infrared (TIR) imagery is a key variable to understand the impacts of temperature oscillation on vegetation greenness (Goetz 1997, Vlassova and Pérez-Cabello 2016) and snow covered areas (Dozier 1989, Butt 2012). Changes in land surface energy balance due to the vegetation loss or increase will be reflected in modified LST values and distribution (Goetz 1997, Vlassova and Pérez-Cabello 2016).
Recently, concern about Lar National Park greening has grown as the phenomenon. There is an evidence of conversion of grassland to shrublands on the soil properties in the study area (Amanollahi et al. 2011). It is necessary to do research on Lar National Park vegetation which highlight the role of the summer snow patches declining due to the enhanced warming and greening in the region, but did not contain enough details for spatially characterizing the interactions between snow covered areas, land surface temperature, and vegetation greenness.
2. STUDY AREA
The Lar National Park is a protected area (35°52'–36°05̍' N, 51°33'– 52°59' E) in the Central Alborz mountain range, at the foot of Mount Damavand, Iran (Fig. 1). The study area covers 27.789 hectares. However, it has been a national park since 1976 and has been managed as a preserved area since 1982 by Iran’s Department of Environment. The Lar Dam is located within the park. It contains pristine areas of high biodiversity, provides deep snowpack for skiers, and is a source of drinking water for urban areas and supplies water for agricultural lands with cold and wet climate. The mean annual precipitation is 595 mm, and the mean annual temperature is 5.2 °C.
Figure 1. Location of study area in Iran
The elevation ranges from 2000-4000 m a.s.l. The area contains more than 400 plant species. Lar National Park vegetation is composed of grassland, including perennial grasses, shrublands, and also alpine vegetation. Mostly plants are Astragalus gossypinus, Papaver sp., Thymus sp., Glycyrrhiza glabra, Cichorium, Thymus vulgaris, Heracleum persicum, borage, shallot, Ferula gummosa, Allium ursinum L., Asclepias sp., Hypericum perforatum.
3. MATERIAL AND METHODS
The Landsat imagery that was used in this study was acquired for 4 dates (2nd June 2015 Landsat 8 OLI, Landsat 5 TM (4 June 2010, 8 June 1994, 3 June 1985)). Landsat Climate Data Record (CDR) Surface Reflectance data are obtained from the EarthExplorer website operated by the USGS (http://espa.cr.usgs.gov/) which have a spatial resolution of 30 m. However, lack of existing extreme climatic event was taken into account in selecting all dates. It should be emphasized that the images are selected in June due to increasing greenness to the warmer temperature in late spring (Walker et al. 1993, Zhou et al. 2003). We have tried to select images at the same day to reduce phonological variation. We did not apply any additional image processing on images. The land cover map is acquired from the Iran Department of Environment. Vegetation indices, LST map, and Normalized Difference Snow Index (NDSI) are computed for all dates using all surface reflectance bands (Table 1). In addition, snow and water covered areas are masked from the land cover map to omit both the negative and zero values that belong to snow and water covered areas in calculating vegetation indices. Also, a masked vector layer of the vegetation map was overlaid on each Landsat reflectance band (blue band, green band, red band, near infrared band (NIR), short-wave Infrared (SWIR) and mid-wave Infrared (MWIR) and vegetation indices. The values of the corresponding pixels are obtained using the mean DN derived for all mentioned bands and VIs. The NDVI is considered as a proxy to indicate the dense vegetation. In our study, it was used because of its common use in long-term studies and also due to the limitation of other VIs (Fraser et al. 2014, Fu and Weng 2016). NDVI layers are calculated to show the vegetation dynamics for the study period. For each year separately, snow cover maps are produced to show snow covered areas in square kilometers.
Land Surface Temperature map for Landsat 5 TM (1985,1994, and 2010) and for Landsat 8 OLI was calculated in degrees Celsius using band 6 and band 10 (the thermal band with 30m spatial resolution), respectively. Although, Land Surface Temperature (LST) map is calculated for all dates using the “Raster” package in the R-software (Team 2013) which can be found in the Appendix. Moreover, functions used to calculate the LST map were taken from the USGS website (https://landsat.usgs.gov/Landsat8_Using_Product.php). All image processing and GIS analyses were performed with the “semi-automatic classification” plug-in of Quantum GIS (Quantum n.d. 2014) and SAGA GIS (Conrad et al. 2015).
Table 1. Indices used in this study
*NIR is the reflectance in near-infrared band, RED is the reflectance in Red band.
**L is a soil correction factor set at 0.5
***GREEN is the reflectance in Green band, SWIR is the reflectance in short-wave infrared band.
4. RESULTS
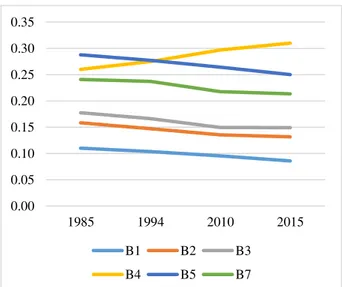
A significant increasing trend was observed in averaged vegetation indices for long-term sequence Landsat data from 1985 to 2015 (Table2). RVI has increased significantly more than other VIs from 1985 to 2015 (Fig.2). The results indicated that the amount of NDVI was 0.35 in 2015 while it was 0.24 in 1985. It should be noted that NDVI and NRVI were exactly equal in all dates. It can be seen that trends in 5 observed spectral bands (visible bands, SWIR and MWIR) were declined in comparison to near infrared bands (Fig.3). The reflectance of Near infrared bands has increased to 0.31 in 2015 while it was 0.26 in 1985 (Fig.3).
Bands and VIs /year
1985 1994 2010 2015
B1 0.11 0.10 0.10 0.09
B2 0.16 0.15 0.14 0.13
B3 0.18 0.17 0.15 0.15
B4 0.26 0.28 0.30 0.31
B5 0.29 0.28 0.26 0.25
B7 0.24 0.24 0.22 0.21
SAVI 0.37 0.38 0.50 0.51
TTVI 0.86 0.86 0.91 0.92
TVI 0.98 0.98 1.06 1.08
NRVI 0.24 0.25 0.34 0.35
RVI 1.82 1.88 2.26 2.31
NDVI 0.24 0.25 0.34 0.35
DVI 0.11 0.11 0.16 0.18
Table 2. Vegetation indices averaged and observed surface reflectance averaged used for all dates in the study B1= blue band, B2=green band, B3= red band, B4=near-infrared band, B5= mid-wave infrared band, B7= short-wave infrared band
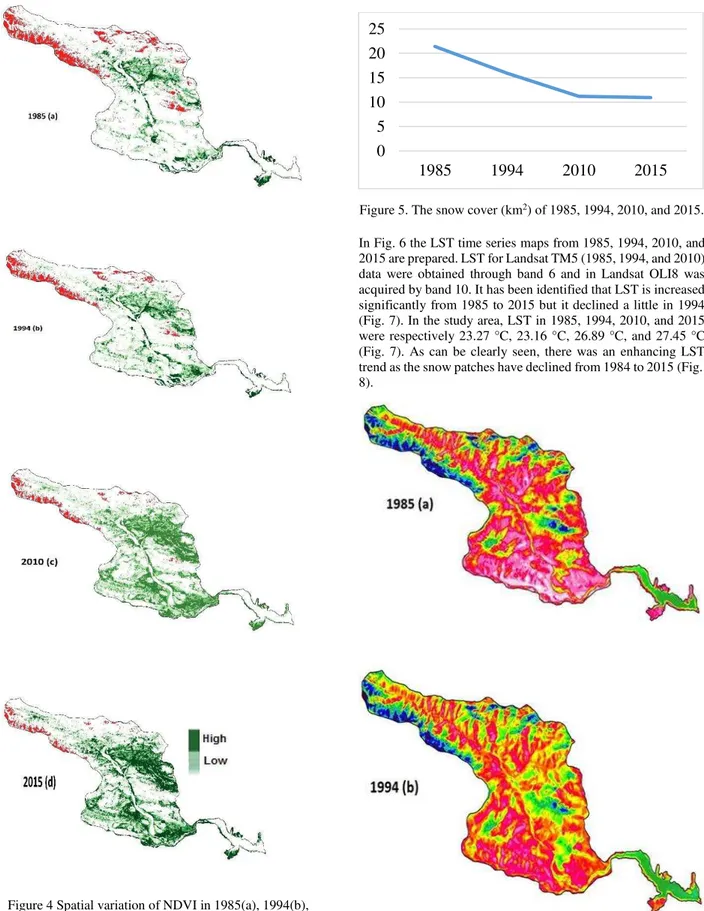
Stacked NDVI layers were produced to identify spatial-temporal greenness from 1985 to 2015 in the study area. Dynamic values of NDVI values separately are shown in each year. When the NDVI layers were investigated, the NDVI value tends to increase during the observation period (Fig. 4). Red colored areas represented the snow covered areas in each year (Fig.4).
Variables Equations Reference
NDVI (Normalized
Difference Vegetation Index)
�� − �� −
(Rouse Jr et al. 1974)
DVI (Difference Vegetation Index)
�� − (Clevers 1988)
SAVI (Soil Adjusted Vegetation
Index)**
+ � �� +�� − + �
(Huete 1988)
RVI (Ratio Vegetation Index)
�� (Tucker 1979)
TVI (Transformed
Vegetation Index)
√� � + .5 (Deering and
Rouse 1975)
TTVI (Thiam’s Transformed
Vegetation Index)
√| � � + .5 | (Perry and
Lautenschlager 1984)
NRVI (Normalized
Ratio Vegetation
Index )
� − � +
(Baret and Guyot 1991)
NDSI (Normalized
Difference Snow Index)***
� � − �
� � + �
(Hall et al. 1995)
0.00 0.50 1.00 1.50 2.00 2.50
1985 1994 2010 2015
SAVI CTVI
TVI RVI
NDVI DVI
Figure 2. Curve of observed vegetation indices averaged in the research area
0.00 0.05 0.10 0.15 0.20 0.25 0.30 0.35
1985 1994 2010 2015
B1 B2 B3
B4 B5 B7
Figure 4 Spatial variation of NDVI in 1985(a), 1994(b), 2010(c) and 2015(d)
The number of snow patches is declining significantly from 1985 to 2015. The curve of snow cover showed that the snow areas decreased consistently to 10.30 km2 in 2015, but it was 21.4 km2
in 1985. Additionally, snow areas in 1985, 1994, 2010, and 2015 were respectively 21.4 km2, 15.92 km2, 11.194 km2, and 10.93
km2 (Fig.5).
Figure 5. The snow cover (km2) of 1985, 1994, 2010, and 2015.
In Fig .6 the LST time series maps from 1985, 1994, 2010, and 2015 are prepared. LST for Landsat TM5 (1985, 1994, and 2010) data were obtained through band 6 and in Landsat OLI8 was acquired by band 10. It has been identified that LST is increased significantly from 1985 to 2015 but it declined a little in 1994 (Fig.7). In the study area, LST in 1985, 1994, 2010, and 2015 were respectively 23.27 °C, 23.16 °C, 26.89°C, and 27.45 °C (Fig.7). As can be clearly seen, there was an enhancing LST trend as the snow patches have declined from 1984 to 2015(Fig. 8).
0
5
10
15
20
25
Figure 6. Spatial variation of LST (°C) in 1985(a), 1994(b), 2010(c) and 2015(d)
Figure 7. LST (°C) in 1985, 1994, 2010, and 2015
Figure 8. LST of snow patches (°C)
5. DISCUSSIONS AND CONCLUSIONS
This study has tried to investigate the spatial-temporal extent change of vegetation greenness accompanying with decreased snow patches over Lar National Park using free accessible Landsat 30m based on VIs and LST data in late spring. This study has emphasized the possibility of using these data in monitoring vegetation greenness change with time series analysis. Additionally, we attempted to evaluate the capability of all Landsat spectral bands and even the thermal band in vegetation change studies.
According to obtained results, each vegetation index has indicated an increasing trend from 1985 to 2015 which depicted the increased greenness with decreasing snow patches at the highest elevation along with increasing LST in the study area. Our results complement previous studies which have illustrated that declining snow patches may be at least partially responsible for the higher VIs values associated with the greening trend and enhanced vegetative growth and green biomass stimulated by warmer air temperatures (Dye and Tucker 2003, Zhou et al. 2003, Fraser et al. 2014). Ratio Vegetation Index had maximum variation among VIs. RVI is not very sensitive when the vegetative cover is sparse (Jackson and Huete 1991). Vegetation in our study area is sparse. There was an increasing trend of NDVI values, from 0.24 in 1985 to 0.35 in 2015 which depict the enhancement of vegetation activities. In addition, increasing VIs values indicate the presence of increased photosynthetic activity that will be accompanied by increased vegetative cover followingsnowmelt for the study period (Dye and Tucker 2003, Zhou et al. 2003, Sawyer and Stephen 2014).
The amount of reflectance in all spectral bands declined from 1985 to 2015 except in NIR bands. High reflectance values in NIR band are consistent with increased greenness (as a result of leaf structure). Reduction in the visible bands showed that vegetation photosynthetic activity is increased (because of absorption by chlorophyll) which led to increasing vegetation cover in the study area. In addition, in the SWIR bands were observed reduction from 1985 to 2015 which indicate the availability of water in each image; vegetation will be increased where water is abundant. It is probably because of melting snow patches. Also, in the MWIR bands a declining trend was estimated which is the result of decreasing soil fraction from
20
22
24
26
28
30
1985 to 2015 due to enhancing vegetative cover (Sawyer and Stephen 2014, Sawyer 2015).
The Land Surface Temperature map showed an enhancing trend over the study period. When moisture is not a limiting factor in the study area, increased LST will probably produce more vegetation growth (Los 1999, Walker et al. 2001). Snow patches have declined from 1985 to 2015. Interestingly, snow covered areas had lower LST in all dates. LST is promoted when the amount of snow patch area was reduced. Thus, the higher the area of snow cover, the lower will be the value of the LST.
In general, increasing NDVI is consistent with warming Land surface temperature, earlier snowmelt, and increasing greenness which led to the expansion of shrubs in the study area (Walker et al. 1993, 2001, 2005). Overall, VIs have become the main tool to describe vegetation phenology, which high VIs values show healthy and dense vegetation. We found that VIs indices can be used for studying the interaction between vegetation and snow covered areas using Landsat time series data.
In our study, increasing vegetation greenness and diminishing of snow patches is probably due to the rising of the LST. Additionally, 90% of Iran’s rangelands are located in arid and semi-arid areas, so it is essential to do research in these areas. Further studies should be done in the maximum growing season (July and August) to see climate change impacts on vegetation greenness in Iran’s rangelands. It is necessary to take substantial decisions to mitigate and adapt to climate change impacts on the rangelands of Iran.
There is an urgent need to analyze by more time series data with ground station data (air temperature) and sophisticated statistical methods such as regression analysis, trend analysis, and correlation analysis. The results of present study can be used in preliminary climate change studies. The study area indicated that the ecosystem responded to climate change which took place over the last few decades.
ACKNOWLEDGEMENTS
The author gratefully acknowledges the US Geological Survey (USGS) for providing Landsat surface reflectance data (CDR). Also, I would like to express my appreciation to Ms. Samantha Prust who helped me with paper editing.
REFERENCES
Amanollahi, J., A. M. Abdullah, and G. A. D. Tilaki. 2011. Relationship between plants evening and soil properties in the rangeland, Lar National Park, Iran. African Journal of Agricultural Research 6:5551– 5557.
Amiri, M., S. Eslamian, and others. 2010. Investigation of climate change in Iran. J Environ Sci Technol 3:208– 216.
Baret, F., and G. Guyot. 1991. Potentials and limits of vegetation indices for LAI and APAR assessment. Remote sensing of environment 35:161–173.
Billings, W. D., and L. Bliss. 1959. An alpine snowbank environment and its effects on vegetation, plant development, and productivity. Ecology 40:388–397. Butt, M. J. 2012. Characteristics of snow cover in the Hindukush,
Karakoram and Himalaya region using Landsat satellite data. Hydrological Processes 26:3689–3698.
Choler, P. 2015. Growth response of temperate mountain grasslands to inter-annual variations in snow cover duration. Biogeosciences 12:3885–3897.
Clevers, J. 1988. The derivation of a simplified reflectance model for the estimation of leaf area index. Remote Sensing of Environment 25:53–69.
Conrad, O., B. Bechtel, M. Bock, H. Dietrich, E. Fischer, L. Gerlitz, J. Wehberg, V. Wichmann, and J. Böhner. 2015. System for automated geoscientific analyses (SAGA) v. 2.1. 4. Geoscientific Model Development 8:1991–2007.
Cowie, J. 2012. Climate change: biological and human aspects. . Cambridge University Press.
Deering, D., and J. Rouse. 1975. Measuring’forage production’ of grazing units from Landsat MSS data. Pages 1169– 1178 International Symposium on Remote Sensing of Environment, 10 th, Ann Arbor, Mich.
Dong, J., G. Zhang, Y. Zhang, and X. Xiao. 2013. Reply to Wang et al.: Snow cover and air temperature affect the rate of changes in spring phenology in the Tibetan Plateau. Proceedings of the National Academy of Sciences 110:E2856–E2857.
Dozier, J. 1989. Spectral signature of alpine snow cover from the Landsat Thematic Mapper. Remote sensing of environment 28:9–22.
Dutrieux, L., H. Bartholomeus, M. Herold, and J. Verbesselt. 2012. Relationships between declining summer sea ice, increasing temperatures and changing vegetation in the Siberian Arctic tundra from MODIS time series (2000–11). Environmental Research Letters 7:044028. Dye, D. G., and C. J. Tucker. 2003. Seasonality and trends of snow-cover, vegetation index, and temperature in northern Eurasia. Geophysical Research Letters 30. Fraser, R. H., T. C. Lantz, I. Olthof, S. V. Kokelj, and R. A. Sims.
2014. Warming-induced shrub expansion and lichen decline in the Western Canadian Arctic. Ecosystems 17:1151–1168.
Goetz, S. 1997. Multi-sensor analysis of NDVI, surface temperature and biophysical variables at a mixed grassland site. International Journal of remote sensing 18:71–94.
Hall, D. K., C. J. Crawford, N. E. DiGirolamo, G. A. Riggs, and J. L. Foster. 2015. Detection of earlier snowmelt in the Wind River Range, Wyoming, using Landsat imagery, 1972–2013. Remote Sensing of Environment 162:45– 54.
Hall, D. K., G. A. Riggs, and V. V. Salomonson. 1995. Development of methods for mapping global snow cover using moderate resolution imaging spectroradiometer data. Remote sensing of Environment 54:127–140.
Huete, A. R. 1988. A soil-adjusted vegetation index (SAVI). Remote sensing of environment 25:295–309. I, I. W. G. 2013. Climate Change 2013-The Physical Science
Basis: Summary for Policymakers. . Intergovernmental Panel on Climate Change. Jackson, R. D., and A. R. Huete. 1991. Interpreting vegetation
indices. Preventive Veterinary Medicine 11:185–200. Jain, S. K., L. Thakural, R. Singh, A. Lohani, and S. Mishra. 2011. Snow cover depletion under changed climate with the help of remote sensing and temperature data. Natural hazards 58:891–904.
Sensing Symposium, 1999. IGARSS’99 Proceedings. IEEE 1999 International. . IEEE.
Maeda, P. E.E. Hurskainen. 2014.
Spatiotemporalcharacterizationoflandsurface temperatureinMountKilimanjarousingsatellitedata. Theor.Appl.Climatol. 118(3),497–509.
May, D. E., P. Webber, and others. 1982. Spatial and temporal variation of the vegetation and its productivity on Niwot Ridge, Colorado. Ecological Studies in the Colorado alpine, a festschrift for John W. Marr. Occasional paper:35–62.
Minder, J. D. J.R. Mote P.W. Lundquist. 2010. Surfacetemperaturelapseratesover
complexterrain:lessonsfromtheCascademountains. J.Geophys.Res.115 (D14122),1–13. http://dx.doi.org/10.1029/2009JD013493.
Mote, P. W. 2006. Climate-driven variability and trends in mountain snowpack in Western North America*. Journal of Climate 19:6209–6220.
Mróz, M., and A. Sobieraj. 2004. Comparison of several vegetation indices calculated on the basis of a seasonal SPOT XS time series, and their suitability for land cover and agricultural crop identification. Tech. Sci 7:39–66.
Park, S.-H., M.-J. Lee, and H.-S. Jung. 2016. Spatiotemporal analysis of snow cover variations at Mt. Kilimanjaro using multi-temporal Landsat images during 27 years. Journal of Atmospheric and Solar-Terrestrial Physics 143:37–46.
Paudel, K. P., and P. Andersen. 2013. Response of rangeland vegetation to snow cover dynamics in Nepal Trans Himalaya. Climatic change 117:149–162.
Perry, C. R., and L. F. Lautenschlager. 1984. Functional equivalence of spectral vegetation indices. Remote Sensing of Environment 14:169–182.
Quantum, G. (n.d.). Development Team (2014).“QGIS Geographic Information System.”Open Source Geospatial Foundation Project.
Rouse Jr, J., R. Haas, J. Schell, and D. Deering. 1974. Monitoring vegetation systems in the Great Plains with ERTS. NASA special publication 351:309.
Sawyer, P. S. 2015. Ecosystem response to recent climate change in alpine environments. thesis.
Sawyer, P., and H. Stephen. 2014. The Big Pine Creek watershed and climate change: A trend analysis of Landsat surface reflectance and PRISM datasets over the last 3 decades. Advances in Space Research 54:37–48. Silleos, N. G., T. K. Alexandridis, I. Z. Gitas, and K. Perakis.
2006. Vegetation indices: advances made in biomass estimation and vegetation monitoring in the last 30 years. Geocarto International 21:21–28.
Team, R. C. 2013. A language and environment for statistical computing. R Foundation for Statistical Computing, Vienna, Austria.
Tucker, C. J. 1979. Red and photographic infrared linear combinations for monitoring vegetation. Remote sensing of Environment 8:127–150.
Turner, D. P., W. B. Cohen, R. E. Kennedy, K. S. Fassnacht, and J. M. Briggs. 1999. Relationships between leaf area index and Landsat TM spectral vegetation indices across three temperate zone sites. Remote sensing of environment 70:52–68.
UNFCCC, 2002. Iran’s initial national communication to UNFCCC, National climate change office with corporation of the United Nations Development Programme (UNDP). prepared by Department of Environment.
Vlassova, L., and F. Pérez-Cabello. 2016. Effects of post-fire wood management strategies on vegetation recovery and land surface temperature (LST) estimated from Landsat images. International Journal of Applied Earth Observation and Geoinformation 44:171–183. Walker, D. A., M. K. Raynolds, F. J. Daniëls, E. Einarsson, A.
Elvebakk, W. A. Gould, A. E. Katenin, S. S. Kholod, C. J. Markon, E. S. Melnikov, and others. 2005. The circumpolar Arctic vegetation map. Journal of Vegetation Science 16:267–282.
Walker, D., W. Billings, and J. De Molenaar. 2001. Snow-vegetation interactions in tundra environments. Snow ecology:266–324.
Walker, D., J. C. Halfpenny, M. D. Walker, and C. A. Wessman. 1993. Long-term studies of snow-vegetation interactions. BioScience 43:287–301.
Wang, K., L. Zhang, Y. Qiu, L. Ji, F. Tian, C. Wang, and Z. Wang. 2015. Snow effects on alpine vegetation in the Qinghai-Tibetan Plateau. International Journal of Digital Earth 8:58–75.
Wessman, C. 1992. Imaging spectrometry for remote sensing of ecosystem processes. Advances in Space Research 12:361–368.
Zhou, L., R. Kaufmann, Y. Tian, R. Myneni, and C. Tucker. 2003. Relation between interannual variations in satellite measures of northern forest greenness and climate between 1982 and 1999. Journal of Geophysical Research: Atmospheres 108.
Appendix
#set working directory
setwd("G:/ Lar National Park /LC81640352015153-SC20160517064600")
library(tiff) library(rgdal) library(sp) library(raster)
#find the radiance rescaling factors provided in the metadata file: #find Band-specific multiplicative rescaling factor from the metadata for band 6 LandsatTM5 and band 10 LandsatOLI8
RADIANCE_MULT_BAND_10 = 3.3420E-04
#find Band-specific additive rescaling factor from the metadata RADIANCE_ADD_BAND_10 = 0.10000
#determine the thermal band name
band_10 <- raster("LC81640352015153LGN00_band6.tif") #Calculate TOA from DN
toa_band10 <- calc(band_10,
fun=function(x){RADIANCE_MULT_BAND_10 * x + RADIANCE_ADD_BAND_10})
#Band-specific thermal conversion constant from the metadata K1_CONSTANT_BAND_10 = 774.8853
K2_CONSTANT_BAND_10 = 1321.0789 #Calculate LST in Kelvin for Band 10 and Band 11
temp10_kelvin <- calc(toa_band10,
fun=function(x){K2_CONSTANT_BAND_10/log(K 1_CONSTANT_BAND_10/x + 1)})
#Convert Kelvin to Celsius for Band 10 and 11
temp10_celsius <- calc(temp10_kelvin, fun=function(x){x - 273.15})
#Export raster images