ABSTRACT
Introduction: There are many factors influencing health inequities; health workforce availability and skill mix are among them. Regional distribution of health work-ers determines access to health services. The aim of this study is to analyse and to assess the distribution of health professionals among the statistical regions and districts in Bulgaria.
Methods and materials: The current study uses health professionals to population ratio, Gini index and Lorenz curve to measure and assess the proportionality of health workers distribution. Data are provided from the Na-tional Statistical Institute and European Health for All databases.
Results and discussion: In Bulgaria, health profes-sionals per population ratio are comparable with the EU average except for the nurses. Beside the shortage of nurs-ing professionals, geographically uneven distribution of health workers is among the main challenges in human re-source management.Regional imbalances are significant among the districts in the country. More than half of the physicians are concentrated in 6 districts. The analysis shows an upward trend in imbalances, expressed as abso-lute or relative differences. The distribution of dentists is much more variant and diverse than this of physicians. The values of Gini index for specialised medical care also re-veal considerable imbalances.
Conclusions: Different coefficients have proved the unequal distribution of health workers among the districts. Regional imbalances are not the only reason for health in-equities in Bulgaria but they have significant influence in rural and remote areas and in regions with high unemploy-ment, low incomes and ageing population.
Key words: health professionals, imbalances, ineq-uity, distribution, access.
INTRODUCTION
Health sector is labour intensive sector and highly relies on the health workforce [1]. Human resources are the most important resources in health system. The quality of and the access to health services depends on availability, qualification and skills of health professionals. However, recent analyses predict a huge shortage of health profes-sionals over the next decades worldwide, as well as in the European Union (EU) [2, 3]. Different countries face the challenge how to guarantee the human capital needed for
REGIONAL IMBALANCES IN DISTRIBUTION OF
BULGARIAN HEALTH PROFESSIONALS
Maria Rohova
Department of Health Economics and Management, Faculty of Public Health, Medical University - Varna
Journal of IMAB - Annual Proceeding (Scientific Papers).2017 Jan-Mar;23(1):
Journal of IMAB ISSN: 1312-773X
https://www.journal-imab-bg.org
universal access and universal health coverage.
The scale and intensity of workforce shortages – in certain health professions and medical specialties or geo-graphic areas - widely vary across the EU [4]. This enhances the existing imbalances in human resources among the countries and regions and deepens the inequities in access to health services.
Despite national and European policies and actions, inequalities in access to health services in Europe exist within and between countries [5]. There are many factors determining health inequities, one of which is health work-force availability and skill mix. Furthermore, in the EU, the freedom of movement and mutual recognition of qualifi-cations facilitate migration of health professionals, which might increasingly affect some regions. The mobility proc-esses deepen the existing imbalances between regions and countries and thus increase the inequities. These key workforce issues impede the ability of health systems in Europe to improve their performance in terms of access, quality and universal coverage.
Imbalances and regional inequities in distribution of health workers can be measured at the national and par-ticularly the sub-national level. Geographic and skill mix imbalances usually reflect rural and remote areas. Differ-ent socio-economic developmDiffer-ent of the regions affects their ability to attract and to retain health professionals. The lack of policy incentives also contribute to regional imbalances. The aim of this study is to analyse and to assess dis-tribution of health professionals among the statistical re-gions and districts in Bulgaria.
METHODS AND MATERIALS
Different methods can be applied to capture the un-even distribution of health workers. The current study uses three of them. One popular methodis the ratio of health pro-fessionals to population. At the national level, the ratio of physicians, dentists and nurses to population is compared to EU average, used as benchmark. Health professionals to population ratio are estimated also for each of the 6 statis-tical regions and 28 administrative districts in Bulgaria.
fect equality) and 1 (total concentration or perfect inequal-ity). The Lorenz curve is a graphical representation of the distribution proportionality [6]. The Gini index for differ-ent health professionals (physicians, ddiffer-entists, nursing pro-fessionals and nurses) is estimated for a 5-year period. The concentration of physicians compared with the number of population by districts is analysed for different medical specialties.
Data for the size of population and the number of health workers by profession and specialty for the 6 statis-tical regions and 28 districts are provided from the National Statistical Institute (NIS). Furthermore, data for EU aver-age from European Health for All databases (WHO Regional Office for Europe) are included.
RESULTS AND DISCUSSION
Physicians to population ratio in Bulgaria has been increasing during the last years and in 2013, it was above the EU average - 397.67 in Bulgaria and 346.62 per 100000 population in EU respectively [7]. A slight increase in absolute number of physicians is observed but the main causes for the higher ratio are related topopulation dimi-nution in Bulgaria. In 2013, the total number of general practitioners (GP) was relatively low – 62.93 per 100 000 population compared with an EU average of 79.47.
Bulgaria is one of the countries with the highest den-sity of dentists in Europe. Since 1990,the number has been increasing steadily and in 2013, reached100.38 per 100 000.
It wasfar above the EU average of 67.29 per 100 000 popu-lation [7].
Unlike the number of physicians and dentists, the nursing professionals per population ratio have been stead-ily decreasing since 1990. In 2013, Bulgaria lags far be-hind the EU average. The country has a very low tion of nurses compared to the EU average – the propor-tion is almost 1.7 times lower than in the EU [7]. There is a slight upward trend in the number of nurses since 2005, but most of them seek employment abroad due to both low recognition and inadequate remuneration [8].
Beside the shortage of nursing professionals and nurses particularly, geographically uneven distribution of health professionals is among the main challenges in hu-man resource hu-management in Bulgarian health system. The number of physicians per 10 000 population in the west part of the country (Northwest and Southwest regions) ex-ceeds the average value for Bulgaria (Table 1). In the Northwest region, this proportion increases due to popula-tion ageing and diminupopula-tion, while in the Southwest region the number of physicians rise due to the higher concentra-tion of health care establishments in the capital Sofia. In the Southwest and South central region, the number of den-tists per 10 000 population is significantly higher than the index values in the other regions. The availability of health professionals in the Southeast and North central regions lags behind the regions, where there are medical universi-ties and university hospitals.
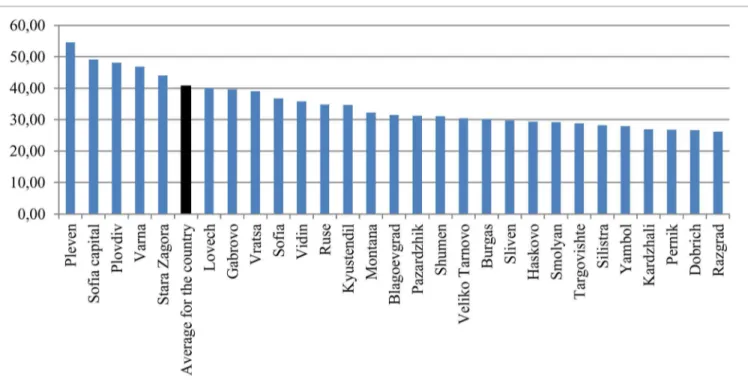
Regional imbalances in distribution of health work-ers become even greater among the 28 districts in the coun-try. More than half of the physicians in Bulgaria are con-centrated in 6 districts – Sofia-capital (22.3%), Plovdiv (11.1%), Varna (7.6%), Stara Zagora (4.9%), Pleven (4.7%) and Burgas (4.4%). An analysis of physicians per popula-tion ratio exposes significant differences between the dis-tricts - from 54.61 per 10 000 population in Pleven and
49.14 in Sofia-capital to 26.63 per 10 000 in the district of Dobrich and 26.19 in Razgrad (Figure 1). Same varieties are observed in primary health care – in the district of Pleven, for example, the number of GPs per population is twice higher than in the district of Razgrad [9]. The analy-sis shows an upward trend in imbalances between the dis-tricts in Bulgaria, expressed as absolute or relative differ-ences.
Table 1. Health professionals per population ratio by statistical regions, 2015
Statistical Physicians Dentists Nursing Nurses GPs per Population Population
regions per 10 000 per 10 000 professionals per 10 000 10 000 per physician per GP
per 10 000
Total for the country 40.64 10.50 66.30 66.30 6.20 246 1614
Northwest 42.65 7.91 68.52 68.52 7.16 234 1397
North central 31.99 8.03 60.14 60.14 5.29 313 1892
Northeast 37.85 9.62 59.93 59.93 6.40 264 1564
Southeast 34.11 8.41 60.83 60.83 5.94 293 1684
Southwest 42.97 12.06 67.17 67.17 6.32 233 1582
South central 38.22 12.99 62.01 62.01 6.07 262 1649
Source: NIS, 2016.
Fig. 1. Physicians per 10 000 population ratio by districts in Bulgaria, 2015.
Similar imbalances are observed in distribution of dentists by districts: there is a 2.8 times difference between the district with the highest and the district with the low-est ratio of dentists per population. Although Bulgaria has a high national level of dentists to population ratio, the country experiences health worker shortages or surplus in certain geographical areas. During the last years, the number of dentists has significantly risen due to develop-ment of private sector and prevailing proportion of patient payments. In 2015, nursing professionals per population ratio also varied between the districts – from 42.33 per 10 000 in the district of Pernik, to 82.90 in the district of Pleven [9]. The differences grow further if we analyse the regional distribution of nurses in the country.
Diverse inequities in the distribution of health work-Source: NIS, 2016.
ers by districts in Bulgaria can also be illustrated using Gini index and Lorenz curve. As the Gini index reveals, in the country, the distribution of physicians is more and fairly equally. The index values range between 0.08 and 0.1, but there is an increasing trend during the last years (Table 2). In contrast, the distribution of dentists is much more variant and diverse. Dentists are heavily concentrated in the capital Sofia and several big towns and especially sparse in smaller towns and rural areas. The disproportion-ate allocation of these health professionals in urban areas can be explained with the development of dental services market in the country and differences between big towns and other types of residence [10]. The Gini index confirms this conclusion; its values exceed these for the other health workers (Table 2).
As presented in figure 2, about 70% of the popula-tion in Bulgaria is served by approximately 60% of the physicians. The distance between the Lorenz curve (the observed distribution of the indicator) and the “ideal dis-tribution line” (45-grade line) represents the degree of
in-equality. The Lorenz curve shows that there aren’t signifi-cant deviations in the distribution of physicians in accord-ance with the number of population. It has to be noticed that Gini index and Lorenz curve are not measures for availability and sufficiency of health professionals and the Table 2. Gini index by districts, 2011-2015
Health professionals 2011 2012 2013 2014 2015
Physicians 0.07958 0.07818 0.09097 0.09026 0.09887
GPs 0.02138 0.00916 0.0121 0.01586 0.01202
Dentists 0.12025 0.13912 0.13084 0.134 0.12398
Nursing professionals 0.03933 0.05575 0.06258 0.05516 0.05859
Nurses 0.03434 0.05917 0.06106 0.0495 0.05299
results do not show if the supply of health workers corre-sponds to their demand. These are measures only for eq-uity of distribution.
Fig. 2. Lorenz curve for distribution of physicians, 2015
ers. The Gini index shows that the distribution of GPs by districts is less unequal than this of physicians in general (Table 2). But the presented coefficient does not assess dif-ferences between urban and rural areas. There is a consider-able shortage of GPs in the rural areas in Bulgaria. In 2015, the number of population per GP varied significantly – from 1 235 in the district of Pleven to 2 443 in the district of Razgrad [9]. The shortage of GPs in rural areas impedes the access of population to primary health services.
There is also a shortage of physicians in specialised medical care.The specialists in intensive care, nephrology, oto-rhino-laringology, psychiatry, clinical laboratory, radi-ology, obstetrics and gynecology and communicable dis-eases have been decreasing in recent years [11]. Imbalances are also observed in their distribution –with predominant concentration in university centers and considerable short-age in small towns and rural areas. Although diseases of the circulatory system are the leading cause for deaths, in 2015, for example, the number of specialists in cardiology per population varied significantly among districts – from 0.35 per 10 000 in the district of Targovishte to 2.74 in Sofia-capital or 7.83 times difference (9NIS, 2016). Similar imbal-ances exist also among the other specialties as shown in Table 3.
The next step of the analysis concerns different medi-cal specialties and differentiation of primary and specialised medical care.Primary medical care is a key sector of health system and the access to health services depends to a great extent on availability and distribution of general
practition-By contrast with primary care, the values of Gini in-dex for specialised medical care reveal more significant imbalances in distribution of physicians. The most impres-sive disproportions are observed in oto-rhino-laringology, orthopaedics and traumatology, dermato-venerology and ophthalmology (Table 3). These disproportions can be con-sidered as access barriers to specialise medical care in some districts. According to the results from analysis, in districts with high infant mortality, specialists per population ratio is lower. For example, in Lovetch and Sliven – districts with the highest infant mortality in the country – the number of specialists in paediatrics and in obstetrics and gynaecol-ogy are far below the average values for Bulgaria [9]. These big differences can be interpreted as examples for inequi-ties in access, which are confirmed also from the analysis of regional distribution of health professionals.
CONCLUSIONS
Regional imbalances in distribution of physicians concern supply of health services and access to medical care. The shortage of health professionals is not the only reason for health inequalities in Bulgaria but it has sig-nificant influence in rural and remote areas, as well as in regions with high unemployment, low incomes and age-ing population.
The different coefficients as health professionals per population ratio and Gini index have proved the unequal distribution of health workers among the districts in the country. Uneven allocation of health care establishments is a prerequisite for the distribution of health profession-als with the biggest imbalances in specialised medical care. The causes for regional imbalances are different. To a certain extent, they are historically determined and are connected with the extensive development of the health system until the beginning of 1990s. Lack of reforms in hospital sector and absence of consequent policyactions during the last 25 years have deepened the inherited dispro-Table 3. Imbalances in distribution of specialists by districts, 2015
Specialty Giniindex Specialty Giniindex Specialty Giniindex
Communicable diseases 0.01521 Other specialty 0.09593 Cardiology 0.19046
Psychiatry 0.03375 Clinical laboratory 0.09774 Urology 0.19806
Internal medicine 0.04418 Neurology 0.09898 Oto-rhino-laringology 0.20129
Pneumology 0.05240 Surgery 0.13468 Paediatrics 0.06407
Radiology 0.13672 Dermato-venerology 0.24931 Physiotherapy 0.06965
Obstetrics and Orthopaedics and
gynaecology 0.15839 Ophthalmology 0.26244 traumatology 0.20370
1. Human Resources for Health in Europe. Edited by Dubois CA, McKee M, Nolte E. European Observatory on Health Systems and Policies Series. 2006. [Internet]
2. Health Workforce 2030. A Glo-bal Strategy on Human Resources for Health. World Health Organisation, Global Health Workforce Alliance. 2014. [Internet]
3. Neubauer K. Developing a Health Workforce Policy for the Euro-pean Union. Bad Gastein, 8 Oct 2010. [Internet]
4. The Health Care Workforce in Europe. Learning from Experience. Edited by Rechel B, Dubois CA, McKee M. European Observatory on
portions. Taking into account the significant percentage of private payments, a relationship between socio-economic development of the region and supply of health services can be found. Last but not least, the opportunities for spe-cialisation, continuous training and carrier development make some districts more attractive for health profession-als than others. Nevertheless, the regional imbalances in distribution of health workers create inequities in access to health services.
The regional imbalances cannot be eliminated; it is impossible to have absolutely equal distribution of resources between regions, sectors or health care establishments in the health system. But high concentration of health care estab-lishments and health workers in some regions and shortage of resources in others causesinequities in access to medical care and different opportunities for population to use health services. These disproportions can increase health inequali-ties between regions and socio-economic groups.
REFERENCES:
Address for correspondence: Maria Rohova
Department of Health Economics and Management, Medical University – Varna 55, Marin Drinov Str., 9002 Varna, Bulgaria
Health Systems and Policies Series. 2006. [Internet]
5. Mackenbach JP. Health Inequali-ties: Europe in Profile. An independ-ent, expert report commissioned by the UK Presidency of the EU, February 2006. [Internet]
6. Lemiere C, Herbst C, Jahanshahi N, Smith E, Soucat A. Reducing Geo-graphical Imbalances of Health Work-ers in Sub-Saharan Africa. A Labour Market Perspective on What Works, What Does Not, and Why? Working Paper No209, World Bank, Washington DC. 2011. [Internet]
7. European Health for All database (HFA-DB). WHO/Europe. July 2016. [Internet]
8. Dimova A, Rohova M, Mouta-fova E, Atanasova E, Koeva S, Panteli D, et al. Bulgaria: Health system re-view. Health Syst Transit. 2012; 14(3): 1–186. [PubMed]
9. National Statistical Institute. Medical personnel in Bulgaria [up-dated 2016 July 13]. [Internet].
10. Zafirova Tzv, Serafimova D, Mitev B. Strategic Aspects in Devel-opment of Health Care Establishments in Varna Municipality. University of Economics, Varna; 2010 [in Bulgarian]. 11. Ministry of Health. National Health Strategy 2008-2013. State Ga-zette, No107, 2008 [in Bulgarian].
Please cite this article as: Rohova M. Regional imbalances in distribution of Bulgarian health professionals. J of IMAB. 2017 Jan-Mar;23(1):1427-1431. DOI: https://doi.org/10.5272/jimab.2017231.1427