Algorithmic Self-Assembly
of DNA Sierpinski Triangles
Paul W. K. Rothemund
1,2, Nick Papadakis
2, Erik Winfree
1,2*
1Computation and Neural Systems, California Institute of Technology, Pasadena, California, United States of America,2Computer Science, California Institute of Technology, Pasadena, California, United States of America
Algorithms and information, fundamental to technological and biological organization, are also an essential aspect of
many elementary physical phenomena, such as molecular self-assembly. Here we report the molecular realization,
using two-dimensional self-assembly of DNA tiles, of a cellular automaton whose update rule computes the binary
function XOR and thus fabricates a fractal pattern—a Sierpinski triangle—as it grows. To achieve this, abstract tiles
were translated into DNA tiles based on double-crossover motifs. Serving as input for the computation, long
single-stranded DNA molecules were used to nucleate growth of tiles into algorithmic crystals. For both of two independent
molecular realizations, atomic force microscopy revealed recognizable Sierpinski triangles containing 100–200 correct
tiles. Error rates during assembly appear to range from 1% to 10%. Although imperfect, the growth of Sierpinski
triangles demonstrates all the necessary mechanisms for the molecular implementation of arbitrary cellular automata.
This shows that engineered DNA self-assembly can be treated as a Turing-universal biomolecular system, capable of
implementing any desired algorithm for computation or construction tasks.
Citation: Rothemund PWK, Papadakis N, Winfree E (2004) Algorithmic self-assembly of DNA Sierpinski triangles. PLoS Biol 2(12): e424.
Introduction
How is complex organization produced and maintained by
physical processes? One may look to biology, where we find
the most sophisticated organization of matter, often spanning
more than 24 orders of magnitude from component
molecules (0.1 attograms) to entire organism (100 kilograms).
This organization is information-based: DNA sequences
refined by evolution encode both the components and the
processes that guide their development into an organism—
the developmental program. For a language to describe this
carefully orchestrated organization, it is tempting to turn to
computer science, where the concepts of programming
languages, data structures, and algorithms are used to specify
complex organization of information and behavior. Indeed,
the importance of universal computation for autonomous
fabrication tasks was recognized in von Neumann’s seminal
work on self-reproducing automata, where he postulated a
universal constructor
that, by reading an input tape specifying
an algorithm for what to build, could carry out the commands
necessary to construct an arbitrary object (von Neumann
1966). If algorithmic concepts can be successfully adapted to
the molecular context, the algorithm would join energy and
entropy as essential concepts for understanding how physical
processes create order. Unfortunately, the study of molecular
algorithms has been hampered by the lack of suitable physical
systems on which to hone such a theory: nature provides us
with elementary chemical reactions too simple to program,
full-blown life too complex to use as a model system, and few
systems in between. This gap may be explored by synthesizing
programmable biochemical systems in vitro, where we can
implement and study a variety of molecular algorithms
ranging gradually from simple to complex.
Biomolecular self-assembly is particularly attractive for the
exploration of molecular algorithms that control
nanofabri-cation tasks. Attesting to its power, self-assembly is used
pervasively in biology to create such structures as virus capsids,
microtubules, and flagella. In each case, the binding
inter-actions between a small number of protein species is sufficient
to dictate the form of the final structure, often via a complex
sequence of cooperative assembly steps. This can be viewed
loosely as a form of programmable nanofabrication, where the
program is the set of molecular species involved. For synthetic
approaches, Seeman (1982, 2003) has demonstrated that DNA
provides an alternative to protein that can be readily
programmed by Watson–Crick complementarity. A seminal
paper by Adleman (1994) used one-dimensional (1D) DNA
self-assembly to operate as a finite-state machine, establishing the
first experimental connection between DNA self-assembly and
computation. This work inspired a theoretical proposal
(Winfree 1996) that builds on Wang’s (1961, 1962) embedding
of computation in geometrical tilings to show that
two-dimensional (2D) self-assembly of DNA can perform
Turing-universal computation—which implies that
any
algorithm can
in principle be embedded in, and guide, a potentially
aperiodic crystallization process. In this
‘‘
algorithmic
self-assembly
’’
paradigm, a set of molecular Wang tiles is viewed as
the program for a particular computation or molecular
fabrication task (Reif 1999; Rothemund and Winfree 2000;
Received September 14, 2004; Accepted October 5, 2004; Published December 7, 2004
DOI: 10.1371/journal.pbio.0020424
Copyright:Ó2004 Rothemund et al.This is an open-access article distributed under the terms of the Creative Commons Attribution License, which permits unrestricted use, distribution, and reproduction in any medium, provided the original work is properly cited.
Abbreviations: AFM, atomic force microscopy; aTAM, abstract Tile Assembly Model; 1D, one-dimensional; 2D, two-dimensional; DNA, deoxyribonucleic acid; DAE-E, double-crossover, antiparallel, even intramolecular spacing, even intermolecular spacing; DAO-E, double-crossover, antiparallel, odd intramolecular spacing, even intermolecular spacing; kTAM, kinetic Tile Assembly Model; PCR, polymerase chain reaction; RAM, random-access memory; XOR, exclusive or
Academic Editor: Anne Condon, University of British Columbia
Adleman et al. 2001). (This framework differs from previous
approaches relating tiling theory to crystalline ground-states
[Radin 1985] in that kinetic phenomena are essential here.)
Whereas 1D algorithmic self-assembly offers limited
computa-tional power (Winfree et al. 1998b) and has been
experimen-tally demonstrated (Adleman 1994; Mao et al. 2000), 2D
algorithmic self-assembly offers not only new capabilities for
computation and construction, but also presents a new range
of physical phenomena and experimental challenges as well.
A natural Turing-universal model of computation that can
be implemented by 2D algorithmic self-assembly is the class
of 1D cellular automata. A simple but interesting choice for
the local cellular automaton rule is the exclusive–or (XOR)
function: at each time step, each cell is computed as the XOR
of its two neighbors. Beginning with a row of all ‘0’s
punctuated by a single central ‘1,’ snapshots of the cellular
automaton’s state at successive time steps may be stacked one
on top of the other to produce a space–time history identical
to Pascal’s triangle (Bondarenko 1993) modulo 2 (Figure 1A,
left), which is a discrete form of Sierpinski’s fractal triangle
(Figure 1A, right). To represent this cellular automaton as a
tiling, each local context present in the space–time history
must have a corresponding Wang tile whose shape represents
the input and output occurring at that location (Figure 1B).
Thus, we need four tiles, one for each entry of the truth table
for XOR, and a linear input row representing the initial state
of the cellular automaton (Figure 1C). Given these tiles and
the input row there is a unique way to tile the upper
half-plane without mismatches or missing tiles—the Sierpinski
Tiling—which reproduces the cellular automaton’s space–
time history (Figure 1D).
Whereas execution of a cellular automaton occurs perfectly
and synchronously, molecular self-assembly is asynchronous
and may have many types of errors. To be successful, an
implementation of cellular automata by molecular tiling must
address four challenges: (1) The abstract tiles must be
translated into molecules (molecular tiles) that readily form
2D crystals. (2) Molecular tiles must be programmed with
specific binding domains that match the logic of the chosen
abstract tiles. (3) The binding of molecular tiles must be
sufficiently cooperative to enforce the correct order of
assembly and prevent errors. (4) Assembly of molecular tiles
must occur on a specified nucleating structure, and spurious
nucleation must be suppressed. These properties are
neces-sary and sufficient for implementing not only the XOR
cellular automaton, but also any other 1D cellular automaton.
All four have been shown individually: several types of DNA
Wang tiles have been designed and shown to grow into
micron-scale 2D periodic crystals (Winfree et al. 1998a; Mao
et al. 1999; LaBean et al. 2000b); the interactions between
these tiles can be programmed by sequence-specific
hybrid-ization (Winfree et al. 1998a; Mao et al. 2000); cooperative
binding of multiple domains ensures specificity—the right
tile attaches in the right place (Winfree et al. 1998b; Mao et al.
2000); and input to the self-assembly process can be provided
by a single-stranded template (LaBean et al. 2000a; Yan et al.
2003a). Here we demonstrate, via self-assembly of Sierpinski
triangles, that all four challenges can be simultaneously
overcome, thus establishing all the mechanisms necessary to
implement arbitrary cellular automata. The Sierpinski tiling,
then, gives rise to a new type of aperiodic crystal—an
algorithmic crystal.
Results
Modeling Tile-Based Self-Assembly
Preventing the types of errors mentioned above may seem
impossible. For example, if a single binding domain is strong
enough to hold a tile in place (red arrows in Figure 1C), then
one would expect roughly 33% of tiles to mismatch with tiles
in the layer below. Simulations of self-assembly shed light on
how to avoid such dire circumstances. We use two levels of
abstraction that isolate and address critical issues for the
design and analysis of our algorithmic self-assembly
experi-ments. How crystal morphology and patterning can be
programmed by tile design in an inherently asynchronous
assembly process is addressed by the abstract Tile Assembly
Model (aTAM) (Winfree 1996, 1998a). To explore how
physical parameters, such as tile concentration and
temper-ature, affect crystal growth and influence error rates, we use
the kinetic Tile Assembly Model (kTAM) based on reversible
tile association and dissociation rates (Winfree 1998a).
Control over the order of assembly is obtained by
exploiting the cooperativity of binding. The aTAM models
cooperativity via a threshold,
s
, representing the number of
bonds that must be made for an association event to be
thermodynamically stable: a tile may be added to a crystal if
at least
s
binding domains match the existing crystal. Black
arrows in Figure 1C indicate four potential association events
that could occur at
s
¼
2; red arrows indicate two additional
association events that would be permitted at
s
¼
1, but not at
s
¼
2. Simulation of cellular automata is designed to work at
s
¼
2. Isolated tiles cannot associate at
s
¼
2 and so growth and
computation must begin with a preformed nucleating
structure (Figure 1C, blue) that represents the input to the
computation. Importantly, at
s
¼
2 no tile may be added until
both
preceding tiles are already present, guaranteeing a
deterministic outcome despite the asynchronous order of
events. Thus, assembly from an input row containing a
solitary ‘1’ domain produces the Sierpinski triangle pattern
(Figures 1D and 2A) regardless of the order in which
permitted associations occur. If a small number of additional
s
¼
1 associations are permitted to occur, then mismatches
between neighboring tiles (mismatch errors) may result. In
this case, or if there are several ‘1’s in the input row, the
resulting pattern can appear to be qualitatively different:
owing to propagation of information and the linearity of
XOR, the resulting pattern is the superposition of Sierpinski
triangles initiated at input ‘1’s and at mismatch error sites
(see Figure 1E).
The rate at which such errors occur can be understood
using the kTAM. In this model, all tiles (regardless of how well
they match) may associate at a given site at a rate,
r
f,
proportional to their concentration:
r
f¼
k
½
tile
¼
ke
Gmc,
where
k
is a forward rate constant and
G
mc.
0 is the
nondimensionalized entropy lost due to association—thus it
represents the monomer concentration. Dissociation rates
depend on how many binding domains match correctly: a tile
with
b
correctly matching binding domains has a dissociation
rate given by
r
r;b¼
ke
bGse, where
G
se.
0 is the
non-dimensionalized free energy for a single binding domain—
thus it represents the sticky end strength.
G
sedecreases with
increased temperature. Thus, if
G
se,
G
mc,
2
G
se, a reaction
while a reaction wherein the tile matches at two domains
would have
r
f.
r
r,2and thus would be thermodynamically
favorable. This model is a reasonable first-order
approxima-tion for the tile-based self-assembly of single crystals. For
G
mc’
2
G
se, as
G
mcand
G
sebecome arbitrarily large, the
s
¼
2 aTAM
is approximated arbitrarily well, and error rates go to zero—
concomitantly, assembly speed goes to zero (Winfree 1998a).
For ranges of
G
mcand
G
secompatible with current
exper-imental conditions, assuming thermodynamic and kinetic
parameters extrapolated from the literature of DNA duplex
hybridization (Bloomfield et al. 2000), this model (Figure S1)
predicts mismatch error rates between 0.1% and 1.0%
(Figure 2B).
The effects of non-idealities can also be explored in this
model. For example, Figure 2C shows growth when the
concentrations of the T-00 and T-11 tiles are twice that of the
T-01 and T-10 tiles, and the nucleating structure grows slowly
from special nucleating tiles rather than being preformed.
Under this condition there is a preferential association of ‘0’s
on the facets of the growing crystal, causing characteristic
errors that terminate Sierpinski triangles at corners and
result in large all-zero patches (Figures 3A and S2). The
mechanism responsible for these errors appears to be
preferential nucleation of T-00 tiles on all-zero facets, due
to their higher concentration (Figure S3). If nucleation occurs
on an all-zero facet both above and below a ‘1’ tile, correct
growth from the ‘1’ will be sandwiched between ‘0’s and
therefore further errors will be forced (Figure 3B). The
further errors could be either (1) termination of the
Sierpinski triangle by addition of a mismatched ‘0’ tile at
the corner site, or (2) sideways propagation creating a new
small triangle by addition of a mismatched ‘1’ tile on the facet
below the corner site (arrow in Figure 3A). Thus, slight
quantitative variations in the model parameters can lead to
striking qualitative differences in the observed error
mor-phologies, which are effectively never seen under growth
conditions with equimolar tile concentrations or with
preformed borders (see Figure S2).
The kTAM also provides insights into a second kind of
error, the spontaneous 2D nucleation of untemplated crystals
in the absence of the nucleating structure. For
G
mc’
2
G
se,
which corresponds to the melting temperature of the crystals,
such untemplated nucleation is inhibited by a kinetic
barrier—the existence of a critical nucleus size (Davey and
Garside 2000) that decreases with increasing supersaturation.
The growth rate of untemplated crystals also increases with
Figure 1.The XOR Cellular Automaton and Its Implementation by Tile-Based Self-Assembly
(A) Left: three time steps of its execution drawn as a space–time history. Cells update synchronously according to XOR by the equation shown. Cells at even time steps are interleaved with those at odd time steps; arrows show propagation of information. Right: the Sierpinski triangle.
(B) Translating the space–time history into a tiling. For each possible input pair, we generate a tile T-xythat bears the inputs represented as shapes on the lower half of each side and the output as shapes duplicated on the top half of each side.
(C) The four Sierpinski rule tiles, T-00, T-11, T-01, and T-10, represent the four entries of the truth table for XOR: 00¼0, 11¼0, 01¼1, a n d 10¼1. Lower binding domains on the sides of tiles match input from the layer below; upper binding domains provide output to both neighbors on the layer above. Semicircular domains represent ‘0’ and rectangular domains, ‘1’. Tiles that output ‘0’ (T-00 and T-11) are gray, and we refer to them as ‘0’ tiles. Tiles that output ‘1’ (T-01 and T-10) are white and are referred to as ‘1’ tiles. Initial conditions for the computation are provided by a nucleating structure (blue). Red asterisks indicate sites on the nucleating structure that bear a ‘1’ binding domain; elsewhere, sites have all ‘0’ binding domains. Black arrows indicate associations that would form two bonds; red arrows, associations that would form one bond.
(D) Error-free growth results in the Sierpinski pattern.
supersaturation since their growth occurs by spontaneous 1D
nucleation of a new layer of tiles on any of four facets. Via any
single binding domain, there are always two tiles that can
bind, so such nucleation must effectively invent a new bit of
information. This bit may be propagated quickly forward or
sideways (wherein tiles attach by one input and one output
domain) to complete the layer without error according to the
logic of XOR. Consequently, such crystals have none of the
qualitative appearance of Sierpinski triangles even though
they may contain no mismatched tiles (see Figure 2D). If
G
seis
increased, corresponding to lowering the temperature,
nucleation occurs more rapidly but errors are more frequent.
Backward growth, in which tiles attach to a crystal by both of
their output domains, is especially error-prone since every
one of these associations involves the invention of
informa-tion (Figure 3C). Whenever two backward-growing domains
meet and disagree on the information that they have
invented, growth can only proceed via an error. Under fast
growth conditions, significantly below the melting
temper-ature as in Figure 2E, this gives rise to higher error rates in
the reverse growth direction. Near the melting temperature,
however, this effect is insignificant. The most noticeable
effect for untemplated crystals is due to the non-ideality
discussed above (doubling the relative concentration of T-00
and T-11 tiles): the statistical preference for all-zero patches
actually
increases
the frequency and size of perfect Sierpinski
patterns (see Figure 2F).
These simulation studies suggest that all three difficulties
(asynchronous association of tiles, mismatch errors, and
untemplated nucleation) in principle can be controlled by
slowing down the growth processes, making experimental
investigations the appropriate next step.
Design and Preparation of DNA Tiles
Abstract Wang tiles are implemented as DNA tiles
according to the scheme described earlier (Winfree et al.
1998a): each molecular Wang tile is a DNA double-crossover
molecule (Fu and Seeman 1993) with four sticky-ends (5-base
single-stranded overhangs) that serve as the programmable
binding domains. We rendered the four Sierpinski rule tiles
using two types of double-crossover molecule, known as
DAE-E and DAO-E molecules (Winfree 1996), resulting in two
independent molecular implementations (Figure 4, sequences
are as given in Figures S4–S7). The DAE-E Sierpinski tile set
(Figure 4A) consists of four molecular tiles, each composed of
five strands whose sequences were designed to minimize the
potential for forming alternative structures (Seeman 1990), as
confirmed by non-denaturing gel electrophoresis (Figure S8).
Figure 2.Typical kTAM Simulation Results
(A) A roughly 130370 subregion of an error-free templated crystal.
(B) A subregion with 10 mismatch errors (0.1%), shown in red (both false ‘0’s and false ‘1’s). Grown atGmc¼17,Gse¼8.8. Large all-zero patches
near the template row are due to intact Sierpinski pattern; for simulations with these parameters, asymptotically only approximately 1% of T-00 tiles are in all-zero patches containing more than 90 tiles (referred to as large patches).
(C) A subregion from a crystal grown with the T-00 and T-11 tiles at doubled concentration, on a slowly growing nucleating row. Mismatch errors (43 of them, i.e., 0.3%, during growth atGmc¼17,Gse¼8.6) characteristically terminate the Sierpinski pattern at corners. Asymptotically,
approximately 18% of T-00 tiles are in large patches.
(D) An untemplated crystal with roughly 4000 tiles and no errors. Inset: The largest subregion of a perfect Sierpinski pattern is small. (E) An untemplated crystal with several errors, grown atGmc¼17,Gse¼10.4. Note that growth in the reverse direction is more error-prone. Only
approximately 1% of T-00 tiles are in large patches.
(F) An untemplated crystal with few errors, grown atGmc¼17,Gse¼8.6, with T-00 and T-11 at doubled stoichiometry. Note the large perfect
subregion. Simulation was initiated by a preformed seed larger than the critical nucleus size (roughly 100 tiles). For these simulation parameters, approximately 25% of T-00 tiles are in large patches. According to the approximations used in Winfree (1998a),Gmc¼17 corresponds to 0.8lM,
Gse¼8.5 corresponds to 41.88C, andGse¼10.4 corresponds to 32.78C. The black outline around the crystals is for clarity; it does not represent
tiles.
Since untemplated crystals were not expected to produce
recognizable Sierpinski triangles, it was necessary to create a
proper nucleating structure to provide the initial input for
the algorithmic self-assembly. Previous work using DNA tiles
to self-assemble an initial boundary had proven to be difficult
(Schulman et al. 2004), so in this work we took an alternative
approach of using assembly PCR (Stemmer et al. 1995) to
create a long single-stranded molecule which could serve as a
scaffold (LaBean et al. 2000a; Yan et al. 2003a) for the
assembly of a row of input tiles (Figures 4A and S9–S11).
Because this nucleating strand serves as the bottom of these
tiles, only four strands are needed to assemble the input tiles,
and an additional capping strand is used to form a
double-helix between input tiles on the nucleating strand. By doping
the assembly PCR mix with a small fraction of the strands
coding for an input tile outputting a single ‘1,’ we ensure that
each nucleating structure contains a few randomly located
sites from which a Sierpinski triangle should grow.
The DAO-E Sierpinski tile set (Figure 4B) consists of six
molecular tiles, due to peculiarities of the DAO-E motif. First,
consideration of the 5
9
and 3
9
orientation of strands—
particularly the fact that the sticky ends at the top and
bottom of a DAO-E tile have opposite polarity—demands
that each tile binds only to
‘‘
upside-down
’’
neighbors,
resulting in layers of tiles with alternating orientation, which
we refer to here as R-type and S-type tiles. Furthermore, the
sugar–phosphate backbone of the DAO-E tiles has a dyad
symmetry axis, implying that the R-01 and S-01 tiles each can
play the roles of both the T-01 and T-10 tiles. Likewise, the
R-00, R-11, S-00, and S-11 tiles can each bind in two
orientations in a site where both inputs match.
In order for the nucleating structure for the DAO-E lattice
to assemble onto a long PCR-generated nucleating strand, the
tiles on the input row must be of the DAE-O variant. Further,
we simplified the construction so that all nucleating strands
contain the same repetitive sequence, but the input tile
strands are doped with a fraction of strands containing a ‘1’
sticky-end, and again the nucleating structure contains a few
randomly located sites from which a Sierpinski triangle
should grow.
Self-Assembly of DNA Sierpinski Triangles
In principle, two approaches can be taken for initiating
algorithmic self-assembly of DNA tiles. In the preformed tile
approach, each tile is prepared separately by mixing a
stoichiometric amount of each component strand in the
hybridization buffer and then annealing from 90
8
C to room
temperature over the course of several hours. The nucleating
structure is similarly prepared by annealing the nucleating
strand with input tile and capping strands. Then the rule tiles
and nucleating structure are mixed together at a temperature
appropriate for crystal growth. In the bulk annealing
approach, the nucleating strand, the capping and input tile
strands, and the strands for all rule tiles are initially mixed
together and then annealed. Since, at the concentrations we
use, the tiles themselves have melting temperatures between
roughly 60
8
C and 70
8
C while the crystals have a melting
temperature within a few degrees of 40
8
C (Figure S12),
during annealing the tiles themselves will first form, and only
later will the fully formed tiles assemble into crystals,
presumably growing from the nucleating structure prior to
overcoming the barrier to spontaneous nucleation. Both
approaches work, but because of the convenience of the bulk
Figure 3. Simulations with Slow Border Growth and T-00 and T-11 at Doubled Concentrations
(A) A common error pattern: termina-tion of triangles at corners.
(B) An observed mechanism leading to termination or sideways extension of triangles: preferential nucleation of T-00 on facets.
(C) Forward and sideways growth is deterministic: at sites presenting two binding domains, there is always a unique tile that can form exactly two bonds. Backward growth is non-deter-ministic: at sites where both binding domains agree (e.g., green arrows), there are two possible tiles that can make two bonds (either fT-10, T-01g, or fT-00, T-11g). At sites where the available binding domains disagree (e.g., red ar-rows), there is no tile that can associate to form two bonds. Since only the output type of tiles are shown, it is impossible to tell from these figures which backward growth sites present agreeing or dis-agreeing binding domains.
annealing approach, all samples reported here were prepared
using that method, with a final concentration of 0.2
l
M each
tile. After self-assembly in solution, samples are deposited
onto mica and imaged by tapping mode atomic force
microscopy (AFM).
Results for the DAE-E tile set are shown in Figures 5 and
S13–S15. The majority of DNA crystals we observed were
similar to those in Figure 5A: in addition to many small and
indistinctly formed fragments, larger crystals are typically
thin and long (up to several microns) with ‘1’ tiles clearly
Figure 4.Molecular Schema
(A) Top center: abstract versions of the four DAE-E Sierpinski rule tiles, VE-00, UE-11, RE-01, and SE-10, highlight their differences from the tiles in Figure 1. The arrangement of 39and 59ends on DAE-E tiles dictates that two distinct pairs of complementary binding domains must be used for each symbol ‘0’ or ‘1,’ denoted here by making complementary shapes large or small. Pink legends show the mapping of shape to sticky-end sequences. Top left: a molecular diagram for VE-00 shows how each DAE-E tile is comprised of five DNA strands; small arrows point to crossovers. Top right: a diagram for RE-01 shows how hairpins are attached to ‘1’ tiles to provide AFM contrast; the exact orientation of these hairpins is unknown. Below: tiles are shown assembling on a nucleating structure. The nucleating strand for the input row (blue) is generated by assembly PCR and frequently reaches lengths of more than 3lm (200 tiles). The nucleating strand contains subsequences onto which capping
strands (orange) and input tile strands assemble to form an input tile outputting ‘0’ at random intervals, the nucleating strand contains a subsequence (asterisk) for a different input tile that outputs a ‘1’ on one side.
(B) Top center: the six DAO-E Sierpinski rule tiles: S-00, R-00, S-11, R-11, S-01, and R-01. Top left and right: molecular diagrams highlight two notable features: (1) R-type tiles output only to S-type tiles, and vice-versa, as dictated by the 39/59polarity of the molecules—again requiring two distinct pairs of binding domains per symbol. (2) The indicated rotational symmetry of the DAO-E molecules allows each molecule to serve in either of two orientations; no explicit S-10 or R-10 tiles are needed. An input tile outputting a single ‘1’ sticky end is shown (asterisk). Sequences are given in Figures S4–S7.
visible. Crystals consisting exclusively of VE-00 tiles (upper
arrow in Figure 5A) were particularly common; further
investigation revealed that some (perhaps all) of these crystals
formed as DNA tubes, and subsequently broke open and lay
flat on the mica (see Figure S15; Rothemund et al. 2004). A
‘011011’-striped pattern (lower arrow in Figure 5A) was also
quite common; it can be constructed from the RE-01, SE-10,
and UE-11 tiles. Growth may have been biased to form
‘011011’ patterns by the depletion of VE-00 tiles, a
stoichio-metric disproportionation of tiles, due to growth of tubes
early during annealing. Crystals that clearly grew from the
nucleating structure were also apparent; Figure 5B–5E show
examples with particularly few errors. In several of these
crystals, individual tiles could be identified and a compatible
arrangement of abstract tiles (and thus errors) could be
determined. Large error-free domains containing more than
eight rows of perfect Sierpinski triangle were observed. In
these examples, the mismatch error rate was about 2% over a
wider selection of fragments, the error rate varied between
1% and 10%. We partly attribute this variation to changes in
the physical conditions during annealing that result in a
disproportionation of tiles. In addition to errors due to
incorporation of the wrong tile, we also observed missing tiles
and lattice dislocations. Frequently, as in Figure 5E, the
identity of obscured or missing tiles was deduced from the
neighboring tiles by assuming correct information
propaga-tion (the imperfecpropaga-tion often being caused by sample
preparation or by interaction with the AFM tip rather than
by errors during assembly).
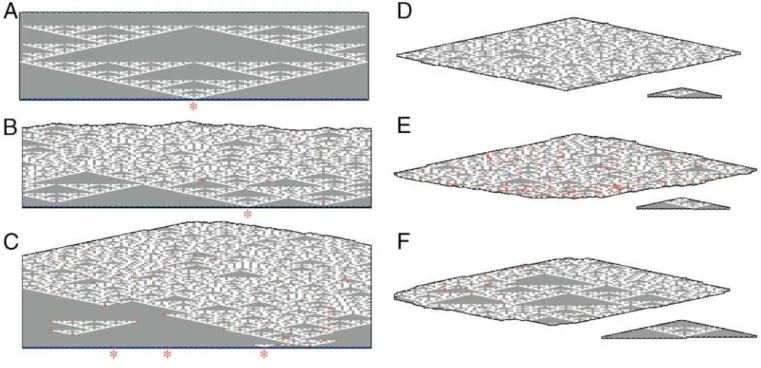
Shown in Figures 6 and S16–S18, the DAO-E tiles also
succeeded in producing recognizable Sierpinski triangles.
However, the DAO-E tiles self-assembled into considerably
larger sheets than the DAE-E tiles, presumably because of the
DAO-E tiles’ symmetries that result in cancellation of strain
and thus encourage flat sheets. Templated crystals were
observed that had grown more than 70 rows (Figure 6A).
Because the R-11 tile does not appear in an error-free
templated crystal, in some experiments (Figure 6A) we did
not include this tile; however, we observed no qualitative
difference between samples prepared with and without R-11.
In these crystals we almost always observed subregions with a
characteristic pattern of errors that coincidentally resulted in
termination of Sierpinski triangles at their corners and tops,
creating large patches of zeros. Even untemplated crystals
(Figure 6B) contained recognizable subregions of the
Sier-pinski pattern. These features may be explained as follows:
although the DAO-E tiles were mixed with equal quantities,
the R-00, S-00, R-11, and S-11 tiles can bind to any permitted
site in two orientations, thus making the experimental
conditions analogous to the simulations of Figure 2C–2F
wherein the concentration of the corresponding tiles is
doubled; slow growth of the input row in the simulations may
correspond to slow straightening out of the nucleating
strand, which is initially a random coil (see Figure S17).
Large crystals often have strikingly different tile distributions
and error rates, as can be seen in the amalgamation of several
large crystals shown in Figure 6C and Video S1. Again, this
may be attributed to the disproportionation of tiles during
annealing, or to sideways growth as the nucleating structure
straightens out. Figure 6D–6E shows particularly clear
examples of Sierpinski triangles, averaged from several scans
of the same crystal. Attempts to optimize the reaction
conditions to produce Sierpinski triangles with lower error
rates did not yield dramatic improvements (Figure S18).
Discussion
The self-assembly of DNA Sierpinski triangles
demon-strates all four features necessary for Turing-universal
computation by crystallization: formation of extended
crystals, programmable interactions between DNA tiles
determined by sticky-end sequences, selective associations
of tiles enforced by the cooperative binding of more than one
sticky end, and controlled nucleation of growth initiated by a
template containing input information. This tiling approach
could be used to implement other cellular automaton rules.
Given a set
S
of possible states for the memory cells and an
update function
f : S
3
S S
, one can create a set of
j
S
j
2tiles
according to the scheme of Figure 1B, one tile for each
possible input pair. The need for binding specificity limits the
number of sticky-end sequences (and hence
j
S
j
) to about 20
for the DAO-E and DAE-E tile designs used here, but this is
already sufficient to implement several known universal
Turing machines and cellular automata (Lindgren and
Nordahl 1990; Rogozhin 1996). A larger set of sticky-end
sequences could be achieved by redesigning the DNA tile
molecules to use longer sticky-ends, provided that the melting
temperatures of tiles and crystals remain well separated.
Thus, DNA crystallization is programmable and
Turing-universal. Furthermore, for fabrication purposes,
computa-tion by self-assembly could be used to control the direccomputa-tion
and extent of growth, thus allowing arbitrary shapes to be
created efficiently (Soloveichik and Winfree
2005)—demon-strating that algorithmic self-assembly is not limited to the
simulation of cellular automata or Turing machines.
that enumerates binary numbers—a binary counter—uses
just four tiles, yet it can be used to define the size of
self-assembled structures (Rothemund and Winfree 2000), thus
addressing the synthetic chemistry challenge of creating
monodisperse particles with programmable size.
Further-more, attachment of suitable logic gates to ‘0’ and ‘1’ tiles
would yield a demultiplexer for a RAM circuit. This and other
interesting digital circuits (Cook et al. 2004) might be created
by using algorithmic crystals as templates for further
chemical processing (Braun et al. 1998; Yan et al. 2003b).
The Turing-universality of self-assembly allows theoretical
insights from computer science to be applied to self-assembly.
For example, many questions phrased using the aTAM—such
as
‘‘
Will a certain tile type, say tile type #5, ever be
incorporated into the assembly?
’’
or
‘‘
Will the final assembled
shape have 4-fold symmetry?
’’
—are formally undecidable as a
consequence of the undecidability of the halting problem
(Turing 1936; Adleman et al. 2002). This suggests that there
exists no generally applicable method for predicting the
behavior or properties of crystals. A concrete instance of this
dilemma is whether quasicrystals’ 5-fold symmetry and
aperiodicity could arise from self-assembly. Crystallographers
have argued that, if so, definitions of order based on X-ray
diffraction must be modified to include the new structures
(Senechal 1995). The growth of Sierpinski triangles,
demon-strated here, shows unequivocally that self-assembly can
create aperiodic structures based on local rules. Furthermore,
traditional methods of measuring order, such as X-ray
diffraction, will not recognize order that exists in certain
algorithmic crystals. For example, an algorithmic crystal
simulating a pseudo-random number generator (Wolfram
1986; Jen 1990; Knuth 1997) would appear disordered, yet
each molecule would be precisely and deterministically
positioned. Thus, the growth of algorithmic crystals motivates
the use of algorithmic definitions of order (Kolmogorov 1965;
Levin 1984; Bennett 1995) that generalize crystallography
(Mackay 1975).
Finally, we ask whether the study of algorithmic
assembly might further our understanding of biological
self-assembly. Algorithmic crystals composed of simple
sugar-based tiles have appeared in science fiction as a form of life
(Egan 1995); indeed, the simplicity and versatility of
crystal-line self-assembly suggests that templating, as a basis for
simple organisms (Penrose and Penrose 1957; Cairns-Smith
1971), may be more natural than previously supposed.
However, examination of self-assembly in modern organisms
reveals many mechanisms beyond those considered here,
including conformational changes, dissipative mechanisms
such as ATP hydrolysis, and interactions with genetic
regulatory networks—themselves biochemical information
processors. The development of a theory of molecular
algorithms that encompasses these additional mechanisms,
Figure 5.AFM Images of DAE-E Crystals
(A) Several frequent morphologies that appear in most samples, including all-’0’ (upper arrow) and ‘011011’-striped crys-tals (lower arrow). The all-’0’ crystal may be a tube that opened upon adsorption to the mica.
(B) A templated crystal. The identifica-tion of tiles in this crystal is given in Figure 1E. Crosses indicate mismatch errors. Asterisks indicate ‘1’s on the nucleating strand.
(C) A crystal containing 10 rows of error-free Sierpinski triangle. A red triangle marks a lattice defect in the input row. (D) Another Sierpinski triangle, better resolved.
(E) A crystal containing a perfect 1936 subregion. Individual tiles can be clearly seen; three tiles are outlined in the lower left. Unfortunately, this crystal landed atop a thin sliver of DNA (lower arrow), obscuring the central columns of the Sierpinski triangle. The upper arrow indicates a 4-tile wide tube, near the point where it opens. A pentagon marks a lattice dislocation. Scale bars are 100 nm.
if successful, will deepen our understanding of the complex
processes found in nature, their fundamental limits, and their
remarkable potential.
Materials and Methods
kTAM simulations. Simulations described in this paper were
performed with the xgrow program, written by Erik Winfree and available, along with tile sets used here, from http://www.dna.calte-ch.edu/SupplementaryMaterial.
The xgrow program simulates the kTAM for a set of square Wang tiles (see Figure S1), beginning with a single seed tile. The tile set used here consists of the four Sierpinski rule tiles T-00, T-11, T-01, and T-10, augmented by three border tiles B-0, B-1, and B-B, the latter being used as the seed tile. To simulate the presence of a nucleating structure, the binding domain that joins border tiles is considered to be twice as strong as the other bonds—that is, it counts as two bonds in the sumbthat determines off-ratesrr;b¼ke
bGse. The border row
grows—simulating the long nucleating structure becoming straight— by association of border tiles at the raterf¼k½tilei ¼kSieGmc, where Siis the stoichiometry of border tileirelative to the concentration of
the four Sierpinski rule tiles. Since we have no knowledge of how quickly DNA nucleating structures straighten in our experiments, we considered two cases: (1) A rigid or quickly straightening nucleating structure was simulated by settingSi¼4, so that near the crystal
melting temperature whereGmc’2Gse, the border growth is strongly
favorable. This was used for Figure 2B, where the seed tile stoichiometry was also set to zero, so that exactly one seed tile would be incorporated into the nucleating structure. (2) A floppy and slowly straightening nucleating structure was simulated by settingSi¼0.25
for the border tiles; in this case, near the melting temperature border growth requires stabilization by growth of rule tiles, resulting in faceted crystals. In combination with doubled concentrations of T-00 and T-11 (Si¼2), this case was used for Figure 2C, where additionally
the seed tile stoichiometry was set to 0.01 so that roughly 1% of border tiles output a ‘1,’ in rough agreement with the observed fraction of ‘1’s within the DNA nucleating structures in our DAO-E experiments.
The strong effect of these variations may be seen in Figure S2. Slow border growth significantly increases the mismatch error rate,
resulting in the information contained in the border being lost in a few layers. The primary effect of doubled T-00 and T-11 concen-trations is to increase the predominance of all-zero patches in the resulting crystal; not only are zero patches typically larger, but all-zero information in the border is propagated more reliably. Addi-tionally, under these conditions spontaneous nucleation almost exclusively involves an initial all-zero nucleus.
Simulations confirm the preferential nucleation of T-00 tiles on all-zero facets when T-00 and T-11 concentrations are doubled (Figure S3). In contrast, preferential nucleation on facets isnotseen for the T-11 tile, despite its increased concentration. This is because, regardless of what information is presented on the facet, there is no way to create a layer containing more than 50% T-11 tiles and no mismatches; T-01 or T-10 tiles must intervene. Thus the nucleation rate is substantially reduced, relative to T-00 nucleation on all-zero facets. This can be assessed in simulations by measuring the probability, p(L), that a T-00 tile will be found after L layers of growth from a facet. Simulations with parameters similar to Figure 2C (doubled T-00 and T-11 concentrations) show that
p(L)’0.66eL /27 þ 0.34 for all-zero facets, indicating strongly
preferential nucleation, but for all other facetsp(L)relaxes quickly to the asymptotic distribution. Simulations with parameters similar to Figure 2B (normal T-00 and T-11 concentrations) show no preferential nucleation, asp(L)relaxes to the asymptotic distribution immediately for every facet type investigated.
DNA sequence design.Design of DNA Wang tiles occurs in three
steps. First, the tile and lattice geometry must be determined. Here, the sizes (number of base-pairs) of each double-helical domain and sticky end, and other structural adornments such as contrast hairpins, are decided. These decisions impact the stability of each tile molecule, as the natural geometry of the DNA double-helix (10.5 bp for a full turn of B-form DNA) (Wang 1979; Rhodes and Klug 1980) constrains, for example, the separation between crossover points to be an integral number of half-turns. For the double-crossover motif used here (Fu and Seeman 1993), the acronym DAE-E refers to some of these choices at the structural level: double-crossover; antiparallel orientation of non-crossover strands at each junction; even number of half-turns (21 bp) between crossover points within each molecules; and even number of half-turns (21 bp) between nearest crossover points in two molecules joined by sticky ends. DAO-E refers to a similar set of choices, except that an odd number of half-turns (16 bp) Figure 6.AFM Images of DAO-E Crystals
(A) A large templated crystal in a 5-tile reaction (no R-11). A single ‘1’ in the input row (asterisk) initiates a Sierpinski triangle, which subsequently devolves due to errors. Mismatch errors within ‘0’ domains initiate isolated Sierpinski patterns terminated by additional errors at their corners.
(B) A large untemplated fragment in a 5-tile reaction (no S-11). Large triangles of ‘0’s can be seen. Crystals similar to this are also seen in samples lacking the nucleating structure.
(C) Several large crystals in a 6-tile reaction, some with more zeros than ones, some with more ones than zeros. It is difficult to determine whether these crystals are templated or not.
(D) An average of several scans of the boxed region from (C), containing roughly 1,000 tiles and 45 errors. (E) An average of several scans of a Sierpinski triangle that initiated by a single error in a sea of zeros and terminated by three further errors (a 1% error rate for the 400 tiles here). Red crosses in (D) and (E) indicate tiles that have been identified (by eye) to be incorrect with respect to the two tiles from which they receive their input. Scale bars are 100 nm.
separates the crossover points within each molecule. Where hairpin sequences were inserted for AFM contrast, we included two unpaired Ts at the bulged three-arm junctions, which has been shown to encourage stacking in the original helix domain (Ouporov and Leontis 1995) without significantly affecting the rigidity of the molecule (Li et al. 1996).
At the second level, specific sequences must be chosen. The issue here is that we wish to prevent undesired associations between strands that might inhibit formation of the correct molecular structure. We used the heuristic principle of sequence symmetry minimization (Seeman 1982, 1990) to minimize the length and number of unintentional Watson–Crick complementary subsequen-ces among all strands in each system (DAO-E and DAE-E). Violations that occurred within a single strand were weighed more heavily than violations between two strands; similarly, violations between strands in the same tile were weighed more heavily than violations between strands in different molecules. A simple adaptive walk algorithm was found to be effective in minimizing the violations and arriving at acceptable sequences. Sticky-end sequences were chosen with particular care to minimize the possibility of erroneous hybrid-ization.
The third level of design concerns variations. We conceptualize DNA Wang tiles as consisting of three modules: the sticky ends, the core helical regions, and adornments such as the hairpin structures that provide contrast for AFM imaging. A given double-crossover core can be given different sticky ends (reprogrammed) by replacing just one or two strands, thus allowing reuse of core designs to implement different tile sets. In our experience, the structural and thermodynamic stability of a given core is not significantly affected by changes in the sticky-end sequences. Similarly, using additional strands, a given core can be used with or without the hairpin adornments, which can be inserted at various locations. Although the hairpin adornments can affect the integrity of a DNA tile (e.g., strand dimers or other high molecular weight species), we have seldom found the undesired products to exceed 20% of the material.
The core sequences for R-00 and S-00 are identical to the A and B tiles from a previous study (Winfree et al. 1998a). We usually give tiles names that indicate their core, sticky ends, and adornments. However, in the main text of this paper we have dispensed with the indication of these variations for clarity. For example, R-01 would more properly be called R-01n-23JC; S-01 called S-01-23JC; RE-01 called RE-01-15J; and SE-10 called SE-10-15J to specify which component strands have hairpins, and where those hairpins are. (The shorter names properly refer to unadorned tiles.)
DNA tile preparation and gel electrophoresis.All oligonucleotides
were synthesized by standard methods (Integrated DNA Technolo-gies), PAGE purified, and quantitated by UV absorption at 260 nm in H2O (purified by a Milli-Q system, Millipore, Bedford, Massachusetts, United States) based on extinction coefficients estimated using a nearest-neighbor model (Bloomfield et al. 2000). DNA tiles were prepared by mixing stoichiometric quantities of each component strand in a TAE/Mg2þ
buffer, as described in Winfree et al. (1998a). Proper formation of each of the ten DAE-E and DAO-E tile cores was confirmed in non-denaturing PAGE (10%–15% 19:1 bis:acrylamide, 3–5 h at 15 V/cm and 4C, 2 pmol complex/lane, Sybr Gold [Molecular Probes, Eugene, Oregon, United States] stained for 20–30 min, excited at 488 nm, imaged with 530 bandpass filter on a Bio-Rad [Hercules, California, United States] Molecular Imager FX Pro Plus) by observing a single major band (see Figure S8; typically between 5% and 20% of the total material appears in bands identified as partial products, such as incomplete tiles with missing strands). We redesigned the core sequences for one tile (R01) that initially did not form clean gel bands; the new tile (R01n) was used exclusively in this study. Most notably in DAE-E tiles, some lanes containing subsets of a tile’s component strands showed ill-formed or heavy species such as dimers, but these difficulties were not pronounced in lanes containing the complete tile. Formation gels also allow us to estimate the relative accuracy of our concentration measurements: mis-matches in stoichiometry would result in excess single-stranded or partial complexes. Concentrations appear to be accurate to610%. This suggests that purification of tile complexes could result in cleaner self-assembly reactions and lower error rates.
Synthesis of the nucleating strand.The single-stranded nucleating
strands were synthesized using a procedure based on Stemmer’s assembly PCR (Stemmer et al. 1995). In assembly PCR, a long, repetitive, double-stranded product is generated by performing PCR on a set of splints, primer-like short (typically 40 nt) oligos that are subsequences of the desired repeat sequence as shown in Figure S9. To generate the single-stranded product needed for subsequent assembly of tiles on the nucleating strand, asymmetric PCR with
primers for just one of the two complementary product strands could be used, in principle. In practice, we have found that such reactions result in more double-stranded product and little or no single-stranded product—probably because the repetitive nature of the assembly PCR product means that every 39end, including those of the undesired strand, may act as a primer. Thus we designed the long covalent strand of our nucleating structures to contain exclusively As, Cs, and Ts and generated single-stranded nucleating strands from the output of an assembly PCR by performing synthesis using a reaction mixture containing just dATP, dCTP, and dTTP. Although predom-inantly stranded, the output of this reaction has both single-and double-strsingle-anded material in it. We do not purify the single strands and thus double-stranded material persists in our experi-ments (Figure S17). The splint strands for generating the DAE-E nucleating strands and the DAO-E nucleating strands are given in Figure S10. Note that in order to have 20 base overlaps, some splint strands complement the same central three base sections of complementary splints.
Assembly reactions for DAO-E and DAE-E nucleating strands were designed using slightly different principles. The improved design used for DAO-E nucleating strands is simpler: A single periodic sequence is generated. The fraction of ‘1’ sites is determined by the stoichiometry of input tile strands used in subsequent self-assembly reactions—strands A4SV and A4-S00 both assemble in the input tile in the same place, but one carries a ‘1’ sticky end while the other carries a ‘0’ sticky end. The approach used for DAE-E nucleating strands is more complex but more powerful for generating non-trivial input patterns. By having multiple splints that can overlap a given sequence, the assembly can be directed to non-deterministically choose one of several ways to extend a sequence. Thus, assembly PCR can be used to generate any regular language (Winfree 1998b). In this work, we used a combination of splint strands that generates substrings of the language (NRE NUEþ)*. The fraction of NRE subsequences is controlled by the amount of SplintNREUE2 and SplintNUERE2, which mediate the transitions into and out of the NRE sequence. (Here, we used these splints at one-fifth the concentration of other splints.) The NRE input tile outputs ‘0’ and ‘1,’ while the NUE input tile outputs ‘0’ and ‘0’. To generate a different language, or a different distribution of sequences in the same language, a new assembly PCR must be run. (The simpler design approach used for DAO-E could also be used for DAE-E nucleating structures.)
For both methods, the PCR protocol has four stages, the first three for assembly PCR and the last to generate single-stranded material. PCR was performed in a Stratagene (La Jolla, California, United States) MX 4000 real-time PCR instrument using a Perkin-Elmer (Torrance, California, United States) GeneAMP XL kit that uses rTth polymerase. In stage 1, a 20ll reaction mixture containing 1 pmol
total of splints (of which there are N types) is prepared without polymerase (Mix A, per 20ll: 1ll of 1lM mixed splints, 1/NlM each;
1.6 ll of 10 mM dNTPs, 2.5 mM each; 1ll of 25 mM magnesium
acetate, 6ll of 3.3X GeneAMP XL PCR buffer; 10ll water). To avoid
mispriming events, the splints are annealed in the reaction mixture at 378C for 5 min. The polymerase (0.4ll) is added and the reaction is
subjected to an initial 728C extension step, followed by 40 cycles (94
8C for 15 s, 408C for 30 s, 728C for 10 sþ1 s/cycle; about 2 h). In stage 2, 40ll of new PCR Mix B (Mix A minus the splints, plus 0.4ll of
polymerase, water adjusted to 20ll), is added to the first reaction
volume and the reaction cycled for an additional 25 cycles (948C for 15 s, 408C for 30 s, 728C for 45 sþ1 s/cycle; about 1.5 h). In stage 3, the 60 ll reaction volume is split into three 20 ll volumes, an
additional 40ll of Mix B is added to each and an additional 20 cycles
(948C for 15 s, 408C for 30 s, 728C for 70 sþ1 s/cycle; about 1.3 h) are performed. At this point, long double-stranded product should be formed. (We have observed that such products remain in the well of an agarose gel long after a 20 kb marker has entered the gel.) Also the dNTPs in the mixture are presumably nearly exhausted—specifically there is little dGTP left. (Any remaining dGTP will be used up early in stage 4.) In stage 4, to create single-stranded nucleating strands, 5ll
of the stage 3 product are mixed with 55ll of fresh PCR mixture (Mix
B with 1.6ll of a mixture containing 2.5 mM each dATP, dCTP, and
pooled in a single recovery step and DNA was resuspended in 200ll
of water. Absorbance measurements of freshly resuspended material appeared unstable, perhaps because clumps of nucleating material scatter light. Long single-stranded DNAs may be prone to hydrolysis in water or strand-breakage upon freeze–thaw. However, after storage in water at 4 8C for a year, the nucleating structure still works well (as in Figure S18).
To check whether the output of stage 4 is suitable as a nucleating strand for self-assembly, one can estimate the binding capacity of the nucleating strand material. Figure S11 shows such a gel (non-denaturing PAGE, 5% 19:1 bis:acrylamide, 1 h, 150 V) for the DAO-E nucleating strand, examining how much of the fluorescently labeled Cy3-cpBr1 can be bound. We observe several things. First, stage 3 double-stranded material does not bind Cy3-cpBr1 well, as expected. Second, stage 4 material does bind Cy3-cpBr1 well, quantitatively absorbing the full amount (1ll) added. Third, stage 4
material cannot absorb 2ll of Cy3-cpBr1, giving us an estimate of the
binding capacity of the nucleating strands. This is important for determining how much of the input tile strands must be added to ensure that a tile assembles onto nearly every site on the nucleating strand. Fourth, the presence of Sybr Green I during PCR does not appear to affect the quality of double or single-stranded material generated.
UV melts of tiles and crystals.Melting temperatures for tiles and
crystals were estimated based on UV260melts of S-00 and R-00-23J and a mixture of both tiles (Figure S12). These tiles, also used in Winfree et al. (1998a), are identical to the R-00 and S-00 tiles for the DAO-E Sierpinski system, but with hairpins added to the R-00 tile. Individual tiles were at 0.4lM of each component strand in TAE/
Mg2þ. The mixture of R-00-23J and S-00, which forms crystals when annealed slowly, contained each strand at 0.2lM. Melts were
performed on an Aviv model 14NT-UV-VIS spectrophotometer (Aviv Instruments/Protein Solutions, Lakewood, NJ, United States), and began with preannealed samples at 158C, increasing to 808C over the course of several hours. Single-tile melts were superimposable with the reanneal from 808C back to 158C, indicating that equilibrium values were measured. Raw absorbance values were normalized. Whereas S-00 has a sharp melting transition (also seen for most other tiles lacking hairpins) near 658C, the R-00-23J tile has a somewhat more gradual transition, which we attribute to the presence of the hairpin. Above 40 8C, the absorbance of the mixture equals the average absorbance of the individual tiles, indicating that crystals have completely melted by that point. Prior to the crystal melting transition between 368C and 408C, there is significant noise in the measurement, presumably due to light scattering.
We have not performed UV260melts of all tiles; however, several other DAO-E and DAE-E tiles have similar transitions between 508C and 708C. Therefore we assume that the templated and untemplated Sierpinski crystals also melt at approximately 408C and that at that temperature, the DNA tiles are reasonably well formed.
Self-assembly reactions.Self-assembly was performed by bulk
an-nealing of all relevant rule tile, input tile, capping, and nucleating strands in a (typically) 50ll volume of 13TAE/Mg2þbuffer (40 mM
Tris–acetate [pH 8.0], 2 mM EDTA, 12.5 mM Mg2þ), annealing from 90 8C to 20 8C at a rate of 1 8C/min (taking about 1 h). Longer annealing schedules (e.g., 18C/min from 908C to 508C followed by 1
8C/30 min in the critical region from 508C to 208C, a total of about 15 h) did not seem to decrease the error rate or the number of untemplated tubes or crystals.
DAO-E reactions contained nucleating strands sufficient to bind 0.004lM of input tile (as estimated from binding capacity gels), 0.2 lM of each capping and input tile strand (A1S, A2, A3-nick, A4-S00,
cpBr1, and 1/100 as much A4SV), and 0.2lM of each rule tile strand
(for each of the five or six tiles used). An excess of input tile strands was used to ensure complete coverage of the nucleating strand. The excess partial input tiles appeared not to significantly interfere with the self-assembly of algorithmic crystals.
DAE-E reactions contained nucleating strands sufficient to bind 0.002–0.008lM of input tile (as inferred from the estimated yield of the
PCR), 0.2lM of each capping and input tile strand (NRE1 to NRE4,
NUE1 to NUE4, CapNRERE and CapNUERE), and 0.2lM of each tile
strand (for each of the four tiles used). Again, an excess of input tile strands was used to ensure complete coverage of the nucleating strand.
AFM imaging. AFM imaging was performed in tapping mode
under TAE/Mg2þ buffer on a Digital Instruments Nanoscope III (Veeco Metrology, Woodbury, New York, United States) equipped with a nano-Analytics Q-control III (Asylum Research, Santa Barbara, California, United States) and a vertical engage J-scanner, using the roughly 9.4 kHz resonance of the narrow 100lM, 0.38 N/m force
constant cantilever of an NP-S oxide-sharpened silicon nitride tip
(Veeco Metrology). After self-assembly is complete, samples were prepared for AFM imaging by deposition of 5 ll onto a freshly
cleaved mica surface (Ted Pella) attached by hot melt glue to a 15 mm metal puck; an additional 30ll of buffer was added to both
sample and cantilever (mounted in the standard tapping mode fluid cell) before the sample and fluid cell were positioned in the AFM head. The tapping amplitude setpoint, after engage, was typically 0.2– 0.4 V, the drive amplitude was typically 100–150 mV, scan rates ranged from 2 to 5 Hz. Individual tiles are most clearly resolved for low amplitude setpoint and high drive amplitude values. However, under such conditions, the greatest damage is done to the sample and the hairpin labels are less distinct, sometimes disappearing entirely. Thus, to prevent damage to samples, amplitude setpoint was maximized and/or drive amplitude minimized subject to the constraint that tiles and their hairpin labels be visible.
After acquisition, most images were flattened by subtracting a low-order polynomial from each scan line, or by adjusting each scan line to match intensity histograms. For some images (see Figures 6D–6E and S18, bottom), multiple scans were aligned using hand-picked fiducial marks and averaged in Matlab (The Mathworks, Inc., Natick, Massachusetts, United States).
Supporting Information
Figure S1.Representations and Tile Sets Used in Simulations
Found at DOI: 10.1371/journal.pbio.0020424.sg001 (57 KB PDF).
Figure S2.Behavior of Simulated Crystal Growth
Found at DOI: 10.1371/journal.pbio.0020424.sg002 (160 KB PDF).
Figure S3.Simulations of Growth on Large Facets
Found at DOI: 10.1371/journal.pbio.0020424.sg003 (126 KB PDF).
Figure S4.DAE-E Strand Sequences
Found at DOI: 10.1371/journal.pbio.0020424.sg004 (16 KB PDF).
Figure S5.DAE-E Tile Diagrams
Found at DOI: 10.1371/journal.pbio.0020424.sg005 (21 KB PDF).
Figure S6.DAO-E Strand Sequences
Found at DOI: 10.1371/journal.pbio.0020424.sg006 (16 KB PDF).
Figure S7.DAO-E Tile Diagrams
Found at DOI: 10.1371/journal.pbio.0020424.sg007 (22 KB PDF).
Figure S8. Formation Gels for Representative DAO-E and DAE-E
Tiles
Found at DOI: 10.1371/journal.pbio.0020424.sg008 (244 KB PDF).
Figure S9.Using Assembly PCR to Generate Long, Repetitive,
Single-Stranded DNA
Found at DOI: 10.1371/journal.pbio.0020424.sg009 (22 KB PDF).
Figure S10.Assembly PCR Scheme for DAE-E and DAO-E Nucleating
Strands
Found at DOI: 10.1371/journal.pbio.0020424.sg010 (25 KB PDF).
Figure S11.Binding Capacity Gel for Determining Nucleating Strand
Stoichiometry
Found at DOI: 10.1371/journal.pbio.0020424.sg011 (53 KB PDF).
Figure S12.Melts of R-00-23J and S-00 and Their Mixture
Found at DOI: 10.1371/journal.pbio.0020424.sg012 (33 KB PDF).
Figure S13.AFM Images Showing the Context and Distribution of
DAE-E Crystals
Found at DOI: 10.1371/journal.pbio.0020424.sg013 (234 KB PDF).
Figure S14.AFM Images Showing the Context and Distribution of
DAE-E Crystals
Found at DOI: 10.1371/journal.pbio.0020424.sg014 (203 KB PDF).
Figure S15.AFM Images of DAE-E Crystals and Tubes
Found at DOI: 10.1371/journal.pbio.0020424.sg015 (226 KB PDF).
Figure S16.AFM Images Showing the Context and Distribution of
DAO-E Crystals