BGD
10, 3079–3120, 2013Low pH and carbonate saturation
state in the North Yellow Sea
W.-D. Zhai et al.
Title Page
Abstract Introduction
Conclusions References
Tables Figures
◭ ◮
◭ ◮
Back Close
Full Screen / Esc
Printer-friendly Version Interactive Discussion
Discussion
P
a
per
|
Dis
cussion
P
a
per
|
Discussion
P
a
per
|
Discussio
n
P
a
per
|
Biogeosciences Discuss., 10, 3079–3120, 2013 www.biogeosciences-discuss.net/10/3079/2013/ doi:10.5194/bgd-10-3079-2013
© Author(s) 2013. CC Attribution 3.0 License.
Open Access
Biogeosciences
Discussions
Geoscientiic Geoscientiic
Geoscientiic Geoscientiic
This discussion paper is/has been under review for the journal Biogeosciences (BG). Please refer to the corresponding final paper in BG if available.
Subsurface low pH and carbonate
saturation state of aragonite on China
side of the North Yellow Sea: combined
e
ff
ects of global atmospheric CO
2
increase, regional environmental
changes, and local biogeochemical
processes
W.-D. Zhai1,2, N. Zheng1, C. Huo1, Y. Xu2, H.-D. Zhao1,2, Y.-W. Li1, K.-P. Zang1, J.-Y. Wang1, and X.-M. Xu1
1
Key Laboratory for Ecological Environment in Coastal Areas (State Oceanic Administration), National Marine Environmental Monitoring Center, Dalian 116023, China
2
State Key Laboratory of Marine Environmental Science, Xiamen University, Xiamen 361005, China
BGD
10, 3079–3120, 2013Low pH and carbonate saturation
state in the North Yellow Sea
W.-D. Zhai et al.
Title Page
Abstract Introduction
Conclusions References
Tables Figures
◭ ◮
◭ ◮
Back Close
Full Screen / Esc
Printer-friendly Version Interactive Discussion
Discussion
P
a
per
|
Dis
cussion
P
a
per
|
Discussion
P
a
per
|
Discussio
n
P
a
per
|
Received: 31 December 2012 – Accepted: 8 February 2013 – Published: 19 February 2013
Correspondence to: W.-D. Zhai ([email protected])
BGD
10, 3079–3120, 2013Low pH and carbonate saturation
state in the North Yellow Sea
W.-D. Zhai et al.
Title Page
Abstract Introduction
Conclusions References
Tables Figures
◭ ◮
◭ ◮
Back Close
Full Screen / Esc
Printer-friendly Version Interactive Discussion
Discussion
P
a
per
|
Dis
cussion
P
a
per
|
Discussion
P
a
per
|
Discussio
n
P
a
per
|
Abstract
Based upon seven field surveys conducted between May 2011 and January 2012, we investigated pH, carbonate saturation state of aragonite (Ωarag), and ancillary
param-eters on the Chinese side of the North Yellow Sea, a western North Pacific continen-tal margin of major economic importance. Subsurface waters were nearly in equilib-5
rium with air in May and June. From July to October, the fugacity of CO2 (fCO2) of
bottom water gradually increased to 697±103 µatm and pH decreased to 7.83±0.07
due to respiration/remineralization processes of primary production induced biogenic particles. In November and January, bottom water fCO2 decreased and pH
grad-ually returned to an air-equilibrated level due to cooling enhanced vertical mixing. 10
The corresponding bottom water Ωarag was 1.74±0.17 (May), 1.77±0.26 (June),
1.70±0.26 (July), 1.72±0.33 (August), 1.32±0.31 (October), 1.50±0.28
(Novem-ber), and 1.41±0.12 (January). Critically low Ωarag values of 1.0 to 1.2 were mainly
observed in subsurface waters in a salinity range of 31.5–32.5 psu in October and November, accounting for∼10 % of the North Yellow Sea area. Water mass derived
15
from the adjacent Bohai Sea had a typical water salinity of 30.5–31.5 psu, and bottom water Ωarag values ranged mostly between 1.6 and 2.4. This study showed that the
carbonate system in the North Yellow Sea was substantially influenced by global at-mospheric CO2 increase. The community respiration/remineralization rates in typical
North Yellow Sea bottom water mass were estimated at 0.55–1.0 µmol O2kg−1d−1 in
20
warm seasons, leading to seasonal drops in subsurface pH andΩarag. Outflow of the
Bohai Sea water mass counteracted the subsurfaceΩaragreduction in the North Yellow
Sea.
1 Introduction
Over the past 200 yr, atmospheric CO2 concentration has increased from a
pre-25
industrial value of 280 ppmv (parts per million by volume) to a present day value of
BGD
10, 3079–3120, 2013Low pH and carbonate saturation
state in the North Yellow Sea
W.-D. Zhai et al.
Title Page
Abstract Introduction
Conclusions References
Tables Figures
◭ ◮
◭ ◮
Back Close
Full Screen / Esc
Printer-friendly Version Interactive Discussion
Discussion
P
a
per
|
Dis
cussion
P
a
per
|
Discussion
P
a
per
|
Discussio
n
P
a
per
|
390 ppmv (WMO/GAW, 2012). Due to sea surface equilibrium with atmosphere, car-bonic acid levels in the upper ocean have risen and pH has decreased by approxi-mately 0.1 units since pre-industry (Zeebe et al., 2008; Doney et al., 2009). These processes may threaten many marine species and even whole ecosystems. This is partially because, at a given pressure, temperature, salinity, and alkalinity, pH deter-5
mines the carbonate saturation state of aragonite (Ωarag) in seawater (based on the
calculation program developed by Lewis and Wallace, 1998). HereΩis defined as the product of the concentrations of calcium and carbonate ions divided by the apparent solubility product (Ksp*) of calcium carbonate, i.e. Ω =[Ca2+][CO23−]/Ksp*. When car-bonate levels in seawaters drop below saturation (Ωarag<1), carbonate biominerals in
10
calcic shells and skeletons may undergo dissolution (Feely et al., 2002, 2010; Gruber et al., 2012).
Previous laboratory and mesocosm studies show that a pH decrease of 0.2 to 0.3 units inhibits or slows calcification in marine organisms, including corals, foraminifera, and some calcareous plankton (Gao et al., 1993; Zeebe et al., 2008). A pH level of 15
7.8 or lower (on the NIST-traceable scale) has been shown to influence the survival of
Chlamys farreri(Yuan et al., 2000), which is an extensively cultured scallop species in
the Bohai Sea and the North Yellow Sea (NYS). Further, gastropod shells significantly dissolve at pH values of less than 7.6 (on the NIST-traceable scale) in marine ecosys-tems affected by volcanic CO2 vents (Hall-Spencer et al., 2008). Negative effects of 20
increasing CO2 and acidification have been reported widely for many aquatic
organ-isms, including non-calcifying species (Munday et al., 2009, 2010; Baumann et al., 2012; Domenici et al., 2012).
In eutrophicated coastal regions, algae and other biogenetic particles sink to the bot-tom waters, where they are remineralized through oxygen-consuming processes. The 25
integrated stoichiometry associated with these processes can be roughly characterized by the traditional Redfield equation:
BGD
10, 3079–3120, 2013Low pH and carbonate saturation
state in the North Yellow Sea
W.-D. Zhai et al.
Title Page
Abstract Introduction
Conclusions References
Tables Figures
◭ ◮
◭ ◮
Back Close
Full Screen / Esc
Printer-friendly Version Interactive Discussion
Discussion
P
a
per
|
Dis
cussion
P
a
per
|
Discussion
P
a
per
|
Discussio
n
P
a
per
|
Oxygen-consuming remineralization is associated with a significant release of CO2, which increases carbonic acid levels in subsurface waters. If local hydrological dy-namics cannot enable degassing of the subsurface CO2, a pH decrease of 0.2 to 0.3
units can occur on seasonal or even intra-seasonal timescales (Cai et al., 2011; Zhai et al., 2012). So far only a few mechanism-involved studies have been designed to 5
understand the integrated effects of global atmospheric CO2increase and local
respi-ration/remineralization processes (e.g. Feely et al., 2010; Cai et al., 2011; Sunda and Cai, 2012). In this research, we investigated seasonal variations of pH andΩarag in
the western and central parts of the NYS, revealing controls of subsurface pH/Ωarag
dynamics in this continental margin, which will assist future predictions of marine en-10
vironment changes in the context of ocean acidification. This high quality dataset of
Ωaragis the first reported for this important marine aquaculture region.
2 Materials and methods
2.1 Study area
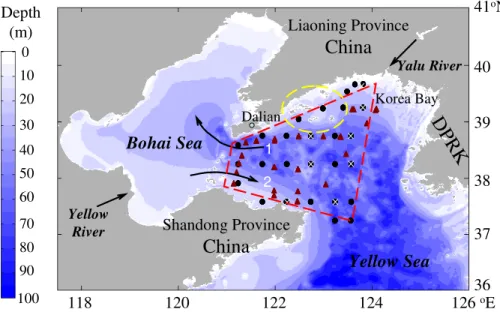
The NYS is a shallow semi-enclosed marginal sea of the western North Pacific, with an 15
area of 71 300 km2and a mean depth of 38 m. It is connected to the Bohai Sea through a narrow channel, while it is relatively open to the South Yellow Sea (Fig. 1). The Bo-hai Sea has a volume of 1.4×10¹²m3 (with an area of 77 000 km2and a mean depth
of 18 m), fed by runoff of approximately 89×109m3yr−1 (Feng et al., 2007),
includ-ing major runoff contributions from the Yellow River, the largest river in North China. 20
This implies that significant Bohai Sea water mass outflow occurs in flood seasons along the southern shoreline (Fig. 1). Yellow River water has a very high alkalinity of
∼3600 µmol kg−1before it empties into the Bohai Sea (Wang et al., 2005). This is
be-cause of intensive carbonate weathering and evaporation in the Yellow River drainage basin (Chen et al., 2005). Therefore, dynamics of water discharge and alkalinity export 25
BGD
10, 3079–3120, 2013Low pH and carbonate saturation
state in the North Yellow Sea
W.-D. Zhai et al.
Title Page
Abstract Introduction
Conclusions References
Tables Figures
◭ ◮
◭ ◮
Back Close
Full Screen / Esc
Printer-friendly Version Interactive Discussion
Discussion
P
a
per
|
Dis
cussion
P
a
per
|
Discussion
P
a
per
|
Discussio
n
P
a
per
|
from the Yellow River have significant impacts on the Bohai Sea water mass outflow and thereby on the carbonate system in the adjacent NYS.
The NYS is also surrounded by the Liaoning and Shandong provinces of China, and the Democratic People’s Republic of Korea. Liaoning and Shandong provinces are both fast-developing marine aquaculture zones, and highly populated regions of China. 5
Although acidification-sensitive bivalve mollusks of the family Pectinidaeand echino-derms of the class Holothuroidea are of major ecological and economic importance in these NYS coastal ecosystems, thus far information regarding pH and carbonate saturation state in the NYS remains limited.
2.2 Survey design
10
From May 2011 to January 2012, we conducted seven field surveys (Table 1) in central and western parts of the NYS (Fig. 1). Recently, water flux from the lower Yellow River has been mainly modulated by the manipulation of water discharge from several major dams located 800–1000 km upstream of its estuary (Wang et al., 2011). From January to mid-June in 2011, water discharge remained less than 300 m3s−1in the lower Yellow 15
River (Fig. 2). In late June, however, it reached a peak of∼3000 m3s−1. From mid-July
to early September, the water discharge ranged between 190 and 650 m3s−1, and reached the second peak of∼3000 m3s−1 in late September. From October 2011 to
early January 2012, the mean water discharge was 1070±300 m3s−1. Therefore, our
surveys were conducted from late spring (May), early summer (June) before human-20
controlled flooding, mid-summer (July) shortly after the human-controlled flood, and dry late summer (August), to flooding autumn (October and November) and winter (January) (Fig. 2a). During these surveys, water samples for pH, total alkalinity (TAlk), dissolved oxygen (DO), and chlorophylla (chl a) determination were collected at 8– 26 grid stations. Most sampling stations had a water depth of 25–78 m (Fig. 1). The 25
BGD
10, 3079–3120, 2013Low pH and carbonate saturation
state in the North Yellow Sea
W.-D. Zhai et al.
Title Page
Abstract Introduction
Conclusions References
Tables Figures
◭ ◮
◭ ◮
Back Close
Full Screen / Esc
Printer-friendly Version Interactive Discussion
Discussion
P
a
per
|
Dis
cussion
P
a
per
|
Discussion
P
a
per
|
Discussio
n
P
a
per
|
2.3 Sampling and analyses
Depth profiles of temperature and salinity (Practical Salinity Scale of 1978) were de-termined with calibrated Conductivity-Temperature-Depth/Pressure (CTD) recorders (SBE911+in June and in November, and SBE19+during other surveys, Sea-Bird Co., USA), on board the R/V Dongfanghong II (June and November) and the R/V Yixing
5
(other survey times). Water samples were obtained at 3–4 depths using rosette sam-plers fitted with 8 L or 2.5 L Niskin bottles, which were mounted with CTD units. The bottom water samples were collected from a depth of 2 to 5 m above the sea bed.
Water samples for DO analyses were collected, fixed, and titrated on board following the classic Winkler procedure. A small quantity of NaN3was added during subsample 10
fixation to remove possible interference from nitrites (Wong, 2012). Based on repeat determinations of the concentration of the Na2S2O3titration reagent used, the
uncer-tainty of the DO data was estimated to be at a satisfactory level of<0.5 % (Zhai et al., 2012). The DO saturation was calculated from field-measured DO concentration di-vided by DO concentration at equilibrium with the atmosphere, as per the Benson and 15
Krause (1984) equation and local air pressure.
Water samples for pH analyses were collected on board using a procedure simi-lar to that used for DO. They were preserved with HgCl2 and determined at 25.0◦C
within 6 h of sampling. The precision pH analyzer (Orion Star™, Thermo Electron Co., USA) used was equipped with an Orion®8102BN Ross combination electrode (Thermo 20
Electron Co., USA) against two or three standard buffers. During field surveys, we used two pH buffer sets. The first set included three NIST-traceable buffers, which were used during all surveys. The second set of pH buffers was used only during the June and November surveys, and included two carefully prepared solutions of 2-amino-2-hydroxy-1,3-propanediol (tris) and 2-aminopyridine. These are used by chem-25
ical oceanographers as total-hydrogen-ion-scale pH buffers (pHT=−log10[H+]T, where
[H+]T=[H+]+[HSO−4]) (Dickson et al., 2007). Based on parallel measurements in June
and November using the two pH buffer sets, we concluded that the pH data on the
BGD
10, 3079–3120, 2013Low pH and carbonate saturation
state in the North Yellow Sea
W.-D. Zhai et al.
Title Page
Abstract Introduction
Conclusions References
Tables Figures
◭ ◮
◭ ◮
Back Close
Full Screen / Esc
Printer-friendly Version Interactive Discussion
Discussion
P
a
per
|
Dis
cussion
P
a
per
|
Discussion
P
a
per
|
Discussio
n
P
a
per
|
total-hydrogen-ion scale were lower than the NIST-traceable pH data by 0.143±0.003
pH units (mean±standard deviation,n=62) in the NYS (Fig. A1), which was
compa-rable with the Bohai Sea results (Zhai et al., 2012) and the commonly accepted value for this difference (Lewis and Wallace, 1998). Based on this result, we transferred the other NIST-traceable pH data to the total-hydrogen-ion scale, although we did not use 5
the total-hydrogen-ion-scale pH buffers during those surveys. The overall uncertainty of our pH dataset was estimated to be 0.01 pH units (Zhai et al., 2012).
Water samples for TAlk analyses were unfiltered but allowed to settle before mea-surement. They were preserved at room temperature with HgCl2 and sealed. TAlk
was determined by Gran acidimetric titration on a 25 mL sample with a Kloehn® dig-10
ital syringe pump, using the above-mentioned precision pH analyzer and electrode for detection. Reference materials were used to calibrate the system at a precision of±2 µmol kg−1(Dickson et al., 2007).
For chladetermination, water samples of 300–1000 mL were filtered on board, de-pending on the chla concentration. Filters were folded and wrapped in aluminum foil, 15
and stored in liquid nitrogen until analysis. After extraction by acetone, concentrations of chlawere measured using a TD-700 laboratory fluorometer (Turner Designs, USA) with the excitation and emission wavelengths set at 430 and 670 nm, respectively (Par-sons et al., 1984).
2.4 Calculation of other carbonate system parameters
20
Seawater fugacity of CO2 (fCO2) and Ωarag were calculated from pHT (25◦C), TAlk,
seawater temperature, and salinity, using a calculation program CO2SYS.xls (Pel-letier et al., 2011), which is an updated version of original CO2SYS.EXE (Lewis and Wallace, 1998). The dissociation constants for carbonic acid were those determined by Millero et al. (2006), and the dissociation constant for the ion HSO−4 was deter-25
BGD
10, 3079–3120, 2013Low pH and carbonate saturation
state in the North Yellow Sea
W.-D. Zhai et al.
Title Page
Abstract Introduction
Conclusions References
Tables Figures
◭ ◮
◭ ◮
Back Close
Full Screen / Esc
Printer-friendly Version Interactive Discussion
Discussion
P
a
per
|
Dis
cussion
P
a
per
|
Discussion
P
a
per
|
Discussio
n
P
a
per
|
with field measured dissolved inorganic carbon (DIC) and Ca2+ data in June, August, and November (Zhai et al., unpublished data), most relative deviations of calculated DIC/Ca2+ values were at satisfactory levels of <1 % for DIC (Fig. A2) and <2 % for Ca2+ (plots not reported). These comparison results suggested that our calculated re-sults of carbonate system parameters were reliable.
5
3 Results
3.1 Environmental settings
Our surveys covered fully four seasons. In January, a typical winter month, water tem-perature ranged mostly between 3.19◦C and 6.74◦C (Fig. 3a), although extremely low temperatures between−1.45◦C and 0.64◦C were also measured at two northern
sta-10
tions. From early spring through to late summer, sea surface temperature (SST) in-creased from 6.21–13.22◦C in May to 19.22–24.83◦C in July/August (Fig. 3a–d), while the mean bottom water temperature of deep stations (water depth>25 m, the same below) increased from 5.5±1.3◦C in May to 13.3±5.0◦C in August (Table 1).
There-fore, a clear stratification was observed at most stations in those summer months (from 15
June to August) (Fig. 3b–d). Stratification was also observed in October (Fig. 3e), de-spite the fact that surface waters had cooled to 14.73–18.37◦C. In November, SST
declined to 11.47–14.53◦C and the temperature induced water stratification was not observed at those northern stations in the area under survey (Fig. 3f).
Compared with the significant seasonal variation of bottom water temperatures at 20
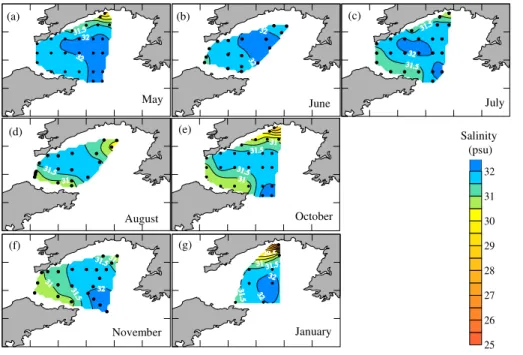
deep stations, bottom water salinity showed only small changes on average (Ta-ble 1). However, spatial distributions of bottom water salinity showed seasonal vari-ations (Fig. 4). In May and June, bottom water salinity was 31.5–32.5 psu at most stations (Fig. 4a, b), which was typical for NYS subsurface waters (Fig. 4). After the human-controlled discharge period in the lower Yellow River in late June (Fig. 2a), 25
however, a tongue-like bottom water mass with relatively low salinity of 30.5–31.5 psu
BGD
10, 3079–3120, 2013Low pH and carbonate saturation
state in the North Yellow Sea
W.-D. Zhai et al.
Title Page
Abstract Introduction
Conclusions References
Tables Figures
◭ ◮
◭ ◮
Back Close
Full Screen / Esc
Printer-friendly Version Interactive Discussion
Discussion
P
a
per
|
Dis
cussion
P
a
per
|
Discussion
P
a
per
|
Discussio
n
P
a
per
|
was observed from July to November in the southwestern part of the NYS under sur-vey (Fig. 4c–f). Since salinity of 30.5–31.5 psu is typical for the Bohai Sea in 2011 (Zhai et al., 2012), our southwestern stations may reflect influences of the Bohai Sea water mass on the NYS.
Figure 5 shows the surface chl a distributions in May, July, October, and Jan-5
uary. On average, surface chla values were measured at 1.96±1.42 µg L−1 in May,
1.87±1.58 µg L−1 in July, 3.29±2.70 µg L−1 in October, and 1.06±1.01 µg L−1in
Jan-uary. Most of these values were higher than the typical surface chl a concentration of 0.1–1.0 µg L−1 in the oligotrophic northern South China Sea (e.g. Huang et al., 2008). Significantly high values of surface chl a were measured at 4 to 7 µg L−1 in 10
July in the northern and southwestern parts of the NYS under study, and 11 µg L−1
was observed in October in the northern part of the NYS (Fig. 5c), indicating high primary production in the northern and southwestern areas under study. According to the marine environmental status bulletin released by the State Oceanic Administration of China, 7 cases of red tide were recorded in 2011 in the northern part of the NYS 15
(http://www.mem.gov.cn/gjgb/index.htm).
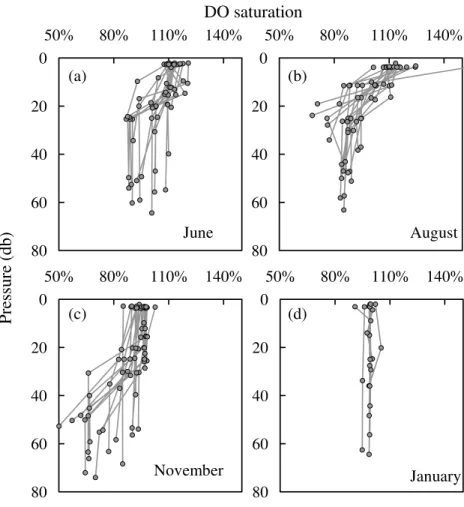
Relatively high DO saturation of 110 % to 150 % in surface waters in June and August (Fig. 6a, b) also indicated high primary production in the upper water columns of the NYS. Below the thermocline depths, DO saturation ranged from 87 % to 103 % in June and from 68 % to 95 % in August (Fig. 6a, b). In November, although surface cooling 20
enhanced vertical mixing at several stations and therefore increased bottom water DO to relatively high saturation levels of 85 % to 94 % at several well-mixed northeastern stations, quite low DO saturation values of 50 % to 70 % were detected in bottom waters of most other stations (Fig. 6c), even at several northern temperature-homogeneous stations. In January, DO saturation was measured at 95 % to 105 % (Fig. 6d). Signifi-25
cantly, averaged bottom water DO in deep stations declined from 291±12 µmol O2kg− 1
in June to 227±24 µmol O2kg− 1
in August to 208±33 µmol O2kg− 1
BGD
10, 3079–3120, 2013Low pH and carbonate saturation
state in the North Yellow Sea
W.-D. Zhai et al.
Title Page
Abstract Introduction
Conclusions References
Tables Figures
◭ ◮
◭ ◮
Back Close
Full Screen / Esc
Printer-friendly Version Interactive Discussion
Discussion
P
a
per
|
Dis
cussion
P
a
per
|
Discussion
P
a
per
|
Discussio
n
P
a
per
|
3.2 pH and TAlk
From winter to spring, sea surface pHT(25◦C) varied between 7.67 and 7.92 in January
and between 7.85 and 8.11 in May (Fig. 7a). In June and July, sea surface pHT (25◦C)
varied between 7.87 and 8.06 (Fig. 7b, c). From late summer to autumn, sea surface pHT (25◦C) varied from 7.88–8.14 in August to 7.86–8.11 in October to 7.76–7.94 in
5
November (Fig. 7d–f). However, subsurface pHT(25◦C) was measured mostly between
7.65 and 7.90 at those stratified stations (Fig. 7). Even during autumn surveys (October and November), very low pHT (25◦C) values of 7.53 to 7.60 were observed in several
bottom waters (Fig. 7e, f). Typically, subsurface pHT (25◦C) was lower than surface
pHT (25◦C) by 0.2 to 0.4 units at those stratified stations (Fig. 7). At many sampling 10
sites, typically low pHT(25◦C) values of bottom waters were observed at a depth of 20
to 30 m above the sea bed (Fig. 7).
Figure 8 shows the bottom water pHT(25◦C) distributions during surveys in the
cen-tral and western parts of the NYS. Significantly, very low pHT (25◦C) of 7.53–7.60
dominated in October, reaching a maximum area of∼6150 km2(Fig. 8e), nearly 10 %
15
of the total area of the NYS. In November, bottom water low pHT (25◦C) of<7.6 only
existed at two northern stations (Fig. 8f). A tongue-like bottom water mass with rela-tively high pHT (25◦C) of>7.8 was observed in May/June and October/November in
the southwestern area under survey (Fig. 8).
Bottom water TAlk was typically measured at 2220–2310 µmol kg−1(Table 1). To
fil-20
ter the effect of salinity, we proportionally normalized bottom water TAlk to a uniform salinity of 35 psu (NTAlk hereafter). Figure 9 shows the typical NTAlk value in the west-ern area of the NYS under survey was 2460–2550 µmol kg−1, much higher than the open ocean value of 2300–2310 µmol kg−1 in the nearby western North Pacific (Lee et al., 2006). This was induced by long-term mixing with Bohai Sea waters, which are 25
directly influenced by high-TAlk Yellow River input. During most surveys, a tongue-like bottom water mass with a very high NTAlk of 2550–2605 µmol kg−1 was usually ob-served in the southwestern part of the NYS (Fig. 9a–f). This further suggested that the
BGD
10, 3079–3120, 2013Low pH and carbonate saturation
state in the North Yellow Sea
W.-D. Zhai et al.
Title Page
Abstract Introduction
Conclusions References
Tables Figures
◭ ◮
◭ ◮
Back Close
Full Screen / Esc
Printer-friendly Version Interactive Discussion
Discussion
P
a
per
|
Dis
cussion
P
a
per
|
Discussion
P
a
per
|
Discussio
n
P
a
per
|
southwestern stations reflected more characteristics of the Bohai Sea waters than did the other stations.
3.3 Carbonate saturation state and bottom waterfCO2
In May and June, typical bottom waterΩarag was calculated at 1.4–2.0 in the central
and western parts of the NYS under study (Fig. 10a, b). In July and August, very low 5
Ωaragvalues of 1.25–1.35 were observed in bottom waters at several western stations
(Fig. 10c, d). Similar to the above-mentioned bottom water pHT distributions (Fig. 8),
critically low bottom waterΩarag values of 1.0–1.2 were detected at nine stations (with
water depths of 45–70 m) in October (Fig. 10e), accounting for ∼10 % of the NYS
area. In November, critically low bottom waterΩarag values of less than 1.2 were only
10
observed at two northern stations, although very lowΩaragvalues of less than 1.4 were
still dominant in the central and western parts of the NYS (Fig. 10f). In January, the bottom waterΩaragwas 1.30–1.88 (Fig. 10g).
Vertical profiles suggested that low Ωarag values of less than 1.8 were generally
confined to subsurface waters (below 20 m depth) (Fig. 11). However, they were mixed 15
with surface waters in cooling/cold months (Fig. 11a–f). At many stratified stations, the typical low Ωarag values of bottom waters were also observed at a depth of 20–
30 m above the sea bed (Fig. 11). In the above-mentioned tongue-like Bohai Sea water mass, relatively highΩaragvalues of 1.8–2.4 were frequently observed (Fig. 10).
Figure 12a shows the seasonal variation of calculated bottom water fCO2 at
20
the deep stations in the NYS. On average, bottom water fCO2 increased from nearly air-equilibrated 371±42 µatm in May and 392±35 µatm in June to CO2
-supersaturated 459±41 µatm in July and 536±61 µatm in August, reaching a peak
value of 697±103 µatm in October. In November and January, bottom waterfCO2 de-clined to 576±116 µatm and 468±61 µatm, respectively. When bottom waters were
25
BGD
10, 3079–3120, 2013Low pH and carbonate saturation
state in the North Yellow Sea
W.-D. Zhai et al.
Title Page
Abstract Introduction
Conclusions References
Tables Figures
◭ ◮
◭ ◮
Back Close
Full Screen / Esc
Printer-friendly Version Interactive Discussion
Discussion
P
a
per
|
Dis
cussion
P
a
per
|
Discussion
P
a
per
|
Discussio
n
P
a
per
|
4 Discussion
4.1 Major effects of temperature on pH
We calculated pHT from 25◦C to in situ, based on datasets of TAlk, seawater
temper-ature, and salinity, using the calculation program CO2SYS.xls (Pelletier et al., 2011). A typical seasonal variation of bottom water pHT(in situ) at the deep NYS stations was
5
revealed (Fig. 12b), which overall mirrored the seasonal variation pattern of bottom waterfCO2 (Fig. 12a). In May and June, bottom water pHT (in situ) was 8.08±0.05
and 8.06±0.04, respectively, close to the present air-equilibrated level of 8.06–8.07.
In July and August, it declined to 8.00±0.04 and 7.94±0.04, respectively. In
Octo-ber, the bottom water pHT(in situ) reached the lowest value of 7.83±0.07 on average.
10
In November and January, bottom water pHT (in situ) increased to 7.91±0.08 and
7.98±0.06, respectively.
According to Gieskes (1969), a temperature increase of 1◦C led to a seawater pH drop of 0.0114 units, since increasing temperature added a greater proportion of free CO2 than that of CO2−
3 in water at a given salinity, TAlk, and pressure. In the NYS,
15
the apparent temperature coefficient of bottom water pHT in 2011 was estimated at −0.0144 pH units◦C−1 (n=7,r=0.996), based on the survey averaged dataset
sum-marized in Table 1. Its absolute value was only a quarter higher than the typical tem-perature coefficient of seawater pH as suggested by Gieskes (1969). This implied that salinity and TAlk together had minor effects on the pH in the NYS. Based on the dataset 20
of bottom water temperature variation (Table 1), using the two temperature coefficients (−0.0114 and −0.0144 pH units◦C−1), we estimated that the effect of temperature on
bottom water pHT accounted for a variation of 0.09–0.11 units in the overall seasonal
variation of 0.25 units in 2011.
In contrast, temperature only had minor effects on bottom water Ωarag in the NYS
25
(Fig. 12c). If we calculated bottom waterΩaragfrom in situ to 5◦C and 15◦C, based on
the datasets of TAlk, pHT (in situ), seawater temperature, and salinity, relative changes
in Ωarag ranged between −3 % and 5 %. The effect of temperature on bottom water
BGD
10, 3079–3120, 2013Low pH and carbonate saturation
state in the North Yellow Sea
W.-D. Zhai et al.
Title Page
Abstract Introduction
Conclusions References
Tables Figures
◭ ◮
◭ ◮
Back Close
Full Screen / Esc
Printer-friendly Version Interactive Discussion
Discussion
P
a
per
|
Dis
cussion
P
a
per
|
Discussion
P
a
per
|
Discussio
n
P
a
per
|
Ωaragonly accounted for a variation of less than 0.09 on the overall seasonal variation
of 0.45 in 2011 (Fig. 12c).
4.2 Responses of pH andΩaragtofCO2increases
Based on TAlk, seawater temperature, and salinity datasets (Table 1), and using the calculation program CO2SYS.xls (Pelletier et al., 2011), we calculated sea-5
sonal variations of bottom water pHT and Ωarag under three constant fCO2
lev-els of 270 µatm, 380 µatm, and 700 µatm, representing the different air-equilibrated states of pre-industry, present day, and a future scenario by the end of this century. Under different fCO2 levels, pHT (in situ) in the NYS was calculated at 8.19–8.20
(fCO2=270 µatm), 8.06–8.07 (fCO2=380 µatm), and 7.82–7.83 (fCO2=700 µatm),
10
respectively (Fig. 12b). Therefore, air-equilibrated pH levels in the NYS declined by 0.13 pH units since the pre-industrial period, similar to the global mean rate of sea surface pH reduction due to the continuous increase of atmospheric CO2(Zeebe et al.,
2008; Doney et al., 2009). By the end of this century, the air-equilibrated pH may de-crease by more 0.24 pH units (Fig. 12b), meaning an inde-crease in total-hydrogen-ion 15
concentrations of 130 % as compared with the pre-industrial period.
Similar to pH, air-equilibratedΩaragin the NYS declined significantly by 0.6 from
pre-industrial to present day (Fig. 12c). By the end of this century, the air-equilibratedΩarag
may reach a critically low level of 1.00–1.37 in the NYS (Fig. 12c).
Figure 12 suggests that the seasonal variation of bottom water pHT (in situ) was
20
mainly driven by fCO2. The seasonal variation of bottom water Ωarag was different
(Fig. 12c). Although differences between air-equilibrated Ωarag and survey averaged
bottom water Ωarag (in situ) were positively correlated with the survey mean bottom
waterfCO2(in situ) (plots not reported), seasonal variation of bottom waterΩaragwas
only partially dominated byfCO2. As discussed above, temperature had major effects
25
onfCO2. At a constant temperature, mean values of subsurfacefCO2varied little from
May to August (Fig. 12a). From August to October, however, temperature normalized
BGD
10, 3079–3120, 2013Low pH and carbonate saturation
state in the North Yellow Sea
W.-D. Zhai et al.
Title Page
Abstract Introduction
Conclusions References
Tables Figures
◭ ◮
◭ ◮
Back Close
Full Screen / Esc
Printer-friendly Version Interactive Discussion
Discussion
P
a
per
|
Dis
cussion
P
a
per
|
Discussion
P
a
per
|
Discussio
n
P
a
per
|
fCO2 led to drops of 0.12 in pHT (25◦C) and 0.40 in Ω
arag (in situ) from August to
October (Fig. 12b, c).
4.3 Community respiration rate and its roles on the seasonal drops of subsurface pH andΩarag
At the same stations in June, August, and November, significant bottom water DO 5
declines of 75 to 123 µmol O2kg− 1
were determined from June to August in the south-western and northern NYS areas under study (Fig. 13a), which were located around two high primary production cores (Fig. 5b) as indicated by the surface chlavalues of 2.0–4.7 µg L−1observed in July. From August to November, bottom water DO declined again by 70 to 100 µmol O2kg−
1
in the northwestern area (Fig. 13b). This highly DO 10
depleted area was also located around the highest primary production core (Fig. 5c) as indicated by the surface chla values of 4–11 µg L−1observed in October. Although changes in bottom water DO were subject to notable disturbance from horizontal trans-port and even vertical mixing, it was reasonable to conclude that the primary production indicated by the chlaresults formed sufficient biogenic sinking particles, supporting no-15
table respiration/remineralization in the bottom waters to consume bottom water DO. It was also reasonable to deduce that this DO consuming process (Eq. 1) led to a sub-stantial addition offCO2(Fig. 12a) and the seasonal drops in subsurface pH andΩarag
(Fig. 12b, c). Similar to the pH-DO correlation cases in the northern Gulf of Mexico, and the northwestern East China Sea offthe Changjiang Estuary, and the northwestern-20
northern Bohai Sea (Cai et al., 2011; Zhai et al., 2012), a positive correlation between subsurface DO and pH (25 oC) was also observed in the NYS (plots not reported), although it was biased in August and November by the water mixing process (see Sect. 4.4).
To estimate community respiration rates in the NYS bottom waters, we plotted bottom 25
water DO concentrations versus salinity for deep stations in June, August, and Novem-ber (Fig. 14a–c). In the NYS bottom water mass with typical salinity of 31.5–32.5 psu, the DO declined from 273–305 µmol O2kg−
1
(average 292 µmol O2kg− 1
BGD
10, 3079–3120, 2013Low pH and carbonate saturation
state in the North Yellow Sea
W.-D. Zhai et al.
Title Page
Abstract Introduction
Conclusions References
Tables Figures
◭ ◮
◭ ◮
Back Close
Full Screen / Esc
Printer-friendly Version Interactive Discussion
Discussion
P
a
per
|
Dis
cussion
P
a
per
|
Discussion
P
a
per
|
Discussio
n
P
a
per
|
229–263 µmol O2kg− 1
(average 245 µmol O2kg− 1
) in August to 136–244 µmol O2kg− 1
(average 193 µmol O2kg− 1
) in November (Fig. 14a–c). Since water stratification oc-curred in the summer months (Fig. 3), we can reasonably assume that possible DO recovery via vertical mixing was negligible. Therefore, this apparent DO depletion rate can be regarded as a rough estimate of the community respiration rate in the NYS 5
bottom water mass, i.e. 0.8 µmol O2kg−1d−1 from June to August. This value was
lower than the DO depletion rates of 2.0–2.8 µmol O2kg−1
d−1
observed in the sum-mer oxygen-depleted bottom water mass in the northwestern-northern Bohai Sea (Zhai et al., 2012).
From August to November, vertical mixing was enhanced (Fig. 3), resulting in DO re-10
covery in many sampling sites. Even under strong disturbance, however, bottom water DO at seven selected sampling sites (from eleven stations with bottom water salinity of >31.5) declined again by 50–90 µmol O2kg−1 in the NYS water mass (Fig. 14c),
indicating August–November DO depletion rates in the NYS bottom water mass were 0.55–1.0 µmol O2kg−
1
d−1. This range was quite similar to the typical NYS bottom water 15
DO depletion rate from June to August.
Figure 13 also shows the distributions of differences in bottom water pHT (in situ)
and Ωarag in June, August, and November. These distributions reflect a synthesis
ef-fect of all regional/local processes on seasonal variations of subsurface pH andΩarag.
Despite potential disturbances of water mixing, Fig. 13c–f present similar patterns to 20
the apparent DO declines (Fig. 13a, b). From June to August, the great declines in pHT (in situ) (0.20–0.26 pH units) andΩarag (0.30–0.43) occurred in the southwestern
near-shore bottom waters (Fig. 13c, e). From August to November, however, another pHT (in situ) reduction of 0.20 units and the greatestΩaragdecrease of 0.60–0.62 were
revealed in the northwestern near-shore bottom waters (Fig. 13d, f). If combined with 25
distributions of bottom water pHT and Ωarag (Figs. 8, 10), the northwestern zone may
BGD
10, 3079–3120, 2013Low pH and carbonate saturation
state in the North Yellow Sea
W.-D. Zhai et al.
Title Page
Abstract Introduction
Conclusions References
Tables Figures
◭ ◮
◭ ◮
Back Close
Full Screen / Esc
Printer-friendly Version Interactive Discussion
Discussion
P
a
per
|
Dis
cussion
P
a
per
|
Discussion
P
a
per
|
Discussio
n
P
a
per
|
4.4 Effects of Bohai Sea water mass outflow
Figure 12c suggests that seasonal variation in air-equilibratedΩaragwas also
remark-able. With lowest salinity in August (Table 1), the air-equilibratedΩaragreached its
high-est peak (Fig. 12c) due to the outflow of the above-mentioned low-salinity/high-NTAlk Bohai Sea water mass.
5
To examine effects of the Bohai Sea water mass outflow, bottom waterΩaragat deep
stations in the NYS were plotted against salinity (Fig. 15a–g). In all these surveys, bot-tom waterΩarag declined with salinity increase. In the typical Bohai Sea water salinity
range of 30.5–31.5 psu, the bottom waterΩaragranged between 1.6 and 2.4 (Fig. 15a–
g), although very low values of 1.3–1.4 with salinity of 30.5–31.5 psu were also revealed 10
at three stations in October and at one station in November (Fig. 15e, f). In the typical NYS water salinity range of 31.5–32.5 psu, however, low Ωarag values of <1.6 were
frequently observed during every survey. Even in October, most bottom water Ωarag
values were in the critically low range of 1.0–1.2 at nine out of thirteen deep stations with salinity of>31.5 psu (Fig. 15e).
15
Similarly, bottom water pHT (25◦C) in general declined with salinity increase
(Fig. 14d–g). In the salinity range of 30.5–31.5 psu, the bottom water pHT (25◦C)
ranged mostly between 7.76 and 7.94 (Fig. 14d–g). In the typical NYS water salin-ity range of 31.5–32.5 psu, however, low bottom water pHT (25◦C) values of <7.70
were frequently observed during most surveys. In October, all bottom water pHT
val-20
ues (25◦C) with salinity of>31.5 psu were observed at very low values of 7.53 to 7.66 (Fig. 14f).
In the southwestern part of the NYS, the Bohai Sea water mass influenced bottom waters, as indicated by low salinity (Fig. 4) and high NTAlk (Fig. 9). The high pHT(25◦C)
(Fig. 8) and highΩarag(Fig. 10) characteristics of this water mass were consistent with
25
previously reported insignificant bottom water DO depletion/pH decline in the south-eastern Bohai Sea in summer months (Zhai et al., 2012). Therefore, the Bohai Sea water mass outflow had important impacts on the dynamics of subsurface pH (25◦C)
BGD
10, 3079–3120, 2013Low pH and carbonate saturation
state in the North Yellow Sea
W.-D. Zhai et al.
Title Page
Abstract Introduction
Conclusions References
Tables Figures
◭ ◮
◭ ◮
Back Close
Full Screen / Esc
Printer-friendly Version Interactive Discussion
Discussion
P
a
per
|
Dis
cussion
P
a
per
|
Discussion
P
a
per
|
Discussio
n
P
a
per
|
andΩarag in the NYS (Figs. 8, 10). In the most acidified month of October, Bohai Sea
water mass outflow effectively increased the NYS mean bottom water Ωarag by 0.28
(Fig. 12c), although its effects on pH (in situ) were counteracted with the temperature effect (Fig. 12b). Figure 15h eliminates the influences offCO2on bottom waterΩarag,
suggesting that the seasonal effect of the Bohai Sea water mass outflow on bottom wa-5
terΩaragaccounted for a variation of 0.54, which was larger than the overall seasonal
variation of 0.45 in bottom waterΩaragin 2011 (Fig. 12c).
4.5 Recent regional environmental changes and their potential impacts
The high frequency of red tides in the past 30 yr indicates eutrophication in the NYS (Zhang, 1994; State Oceanic Administration of China, http://www.mem.gov.cn/gjgb/ 10
index.htm). In June 2011, however, surface water nutrients in the NYS were mea-sured at low concentrations of 0.5–1.2 µmol L−1 for DIN (nitrate+nitrite+ammonium),
<0.03 µmol L−1 for phosphate, and 1.0–5.0 µmol L−1 for dissolved silicate (Zhai et al., unpublished data), which were similar to values obtained in the early 1990s (Zhang, 1994). According to Zhang (1994), atmospheric deposition of nutrient elements and 15
trace species causes red tides to develop in this region. Based on a synthesis research, Bashkin et al. (2002) concluded that typical annual nitrogen input into the Yellow Sea in the late 1990s was approximately 2.6×10¹²g N. Annual accumulation of N in the
Yellow Sea was estimated at approximately 1.2×10¹²g N, with a residence time for
nitrogen of about 1.5 yr (Bashkin et al., 2002). The majority of this nitrogen loading was 20
human-derived, which led to excessive water eutrophication in the Yellow Sea.
On the other hand, annual water discharge of the lower Yellow River has signifi-cantly declined during the past 50 yr from mostly (30–70)×109m3yr−1 in the 1950s
and 1960s to∼5×10⁹m3yr−1 in the late 1990s (Wu et al., 2004; Wang et al., 2007;
Fig. 2b), and leading to a salinity increase in the Bohai Sea by 2 psu (Wu et al., 2004; 25
Ning et al., 2010). Although water flux from the Yellow River estuary into the Bohai Sea increased again to∼20×109m3yr−1over the last ten years (Fig. 2b) due to human
BGD
10, 3079–3120, 2013Low pH and carbonate saturation
state in the North Yellow Sea
W.-D. Zhai et al.
Title Page
Abstract Introduction
Conclusions References
Tables Figures
◭ ◮
◭ ◮
Back Close
Full Screen / Esc
Printer-friendly Version Interactive Discussion
Discussion
P
a
per
|
Dis
cussion
P
a
per
|
Discussion
P
a
per
|
Discussio
n
P
a
per
|
River only account for 30 %–66 % of those values in the 1950s and 1960s. The re-duced water discharge still supports the significant Bohai Sea water mass outflow and thereby an alkalinity source in the NYS, as indicated by the NYS mean bottom water salinity drop in August (Table 1) and the NYS bottom water NTAlk distributions (Fig. 9). In the hydrological settings during the 1950s and 1960s, more Bohai Sea water and 5
TAlk were introduced into the NYS, and the above-mentioned seasonal acidification processes were mitigated much more than present. Therefore, the recent occurrence of lowΩarag status in the NYS subsurface waters is not only influenced by global
at-mospheric CO2increase and local respiration/remineralization (Feely et al., 2010; Cai
et al., 2011; Sunda and Cai, 2012), but also by major environmental changes in the re-10
gional system of the Yellow River – Bohai Sea – North Yellow Sea. This issue requires further investigation.
5 Summary and implications
In summary, we investigated the dynamics of subsurface pH and Ωarag in 2011 on
the Chinese side of the North Yellow Sea. Our results indicate that this western North 15
Pacific continental margin was substantially influenced by global atmospheric CO2
in-crease. Local community respiration/remineralization led to seasonal drops in subsur-face pH and Ωarag, although outflow of the Bohai Sea water mass counteracted the
subsurfaceΩaragreduction in the warm seasons. Very low pHT values (25◦C) of 7.53–
7.60 and critically low Ωarag values of 1.0–1.2 were revealed in subsurface waters in
20
October in∼10 % of the North Yellow Sea area. In areas with extremely low pH and
Ωarag, carbonate biominerals in calcic shells and skeletons may begin to significantly
dissolve. This status may seriously injure the adjacent marine aquaculture zones, which are of major economic importance in North China.
In a broader context, coastal ocean acidification is influenced by the combined effect 25
of many contributors, including global atmospheric CO2 increases and regional/local forcings (Feely et al., 2010; Kelly et al., 2011; Gruber et al., 2012). The North Yellow
BGD
10, 3079–3120, 2013Low pH and carbonate saturation
state in the North Yellow Sea
W.-D. Zhai et al.
Title Page
Abstract Introduction
Conclusions References
Tables Figures
◭ ◮
◭ ◮
Back Close
Full Screen / Esc
Printer-friendly Version Interactive Discussion
Discussion
P
a
per
|
Dis
cussion
P
a
per
|
Discussion
P
a
per
|
Discussio
n
P
a
per
|
Sea is clearly one of these complex regimes. Moreover, this study presents a unique example of regional environment changes resulting from elevated nutrient discharges from land and reduction in terrestrial alkalinity inputs on coastal ocean acidification.
Appendix A
Comparison between parallel pH measurements
5
Based on parallel measurements in June and November using two pH buffer sets, we concluded that the pH data on the total-hydrogen-ion scale were lower than the NIST-traceable pH data by 0.143±0.003 pH units (mean±standard deviation,n=62, based
on the experiment in June) in the North Yellow Sea (Fig. A1).
Appendix B
10
Comparison between measured and calculated dissolved inorganic carbon
By comparison with field measured dissolved inorganic carbon (DIC) data in June, August, and November (Zhai et al., unpublished data), most relative deviations of cal-culated DIC were at a satisfactory level of less than 1 % (Fig. A2).
Acknowledgements. We thank Liguo Guo, Xiao Huang, Di Qi, and Ying Wang for the
collec-15
tion of ancillary data, Deli Wang for his constructive discussion, and Christine Watts for her assistance with English. Houjie Wang, Xiao Huang, Yuewen Jiang, Minghao Li and the crews of R/VDongfanghong IIand R/VYixingprovided much help during the sampling surveys. The research was supported by the National Basic Research Program of China (2009CB421204) and the National Natural Science Foundation of China (NSFC) (41276061 and 41076044).
20
BGD
10, 3079–3120, 2013Low pH and carbonate saturation
state in the North Yellow Sea
W.-D. Zhai et al.
Title Page
Abstract Introduction
Conclusions References
Tables Figures
◭ ◮
◭ ◮
Back Close
Full Screen / Esc
Printer-friendly Version Interactive Discussion
Discussion
P
a
per
|
Dis
cussion
P
a
per
|
Discussion
P
a
per
|
Discussio
n
P
a
per
|
References
Bashkin, V. N., Park, S. U., Choi, M. S., and Lee, C. B.: Nitrogen budgets for the Republic of Korea and the Yellow Sea region, Biogeochemistry, 57/58, 387–403, 2002.
Baumann, H., Talmage, S. C., and Gobler, C. J.: Reduced early life growth and survival in a fish in direct response to increased carbon dioxide, Nat. Clim. Chang., 2, 38–41, 2012.
5
Benson, B. B. and Krause, D.: The concentration and isotopic fractionation of oxygen dissolved in fresh water and seawater in equilibrium with the atmosphere, Limnol. Oceanogr., 29, 620– 632, 1984.
Cai, W.-J., Hu, X.-P., Huang, W.-J., Murrell, M.-C., Lehrter, J. C., Lohrenz, S. E., Chou, W.-C., Zhai W.-D., Hollibaugh, J. T., Wang, Y.-C., Zhao, P.-S., Guo, X.-H., Gundersen, K., Dai,
M.-10
H., and Gong, G.-C.: Acidification of subsurface coastal waters enhanced by eutrophication, Nat. Geosci., 4, 766–770, 2011.
Chen, J.-S., Wang, F.-Y., Meybeck, M., He, D.-W., Xia, X.-H., and Zhang, L.-T.: Spatial and temporal analysis of water chemistry records (1958–2000) in the Huanghe (Yellow River) basin, Global Biogeochem. Cy., 19, GB3016, doi:10.1029/2004GB002325, 2005.
15
Dickson, A. G.: Standard potential of the reaction: AgCl(s)+1/2 H2(g)=Ag(s)+HCl(aq), and the standard acidity constant of the ion HSO−
4 in synthetic sea water from 273.15 to
318.15 K, J. Chem. Thermodyn., 22, 113–127, 1990.
Dickson, A. G., Sabine, C. L., and Christian, J. R.: Guide to Best Practices for Ocean CO2 Measurements, PICES Spec. Publ., no. 3, 2007.
20
Domenici, P., Allan, B., McCormick, M. I., and Munday, P. L.: Elevated carbon dioxide affects behavioural lateralization in a coral reef fish, Biol. Lett., 8, 78–81, 2012.
Doney, S. C., Fabry, V. J., Feely, R. A., and Kleypas, J. A.: Ocean acidification: the other CO2 problem, Annu. Rev. Mar. Sci., 1, 169–192, 2009.
Feely, R. A., Sabine, C. L., Lee, K., Millero, F. J., Lamb, M. F., Greeley, D., Bullister, J. L.,
25
Key, R. M., Peng, T.-H., Kozyr, A., Ono, T., and Wong, C. S.: In situ calcium carbonate disso-lution in the Pacific Ocean, Global Biogeochem. Cy., 16, 1144, doi:10.1029/2002GB001866, 2002.
Feely, R. A., Alin, S. R., Newton, J., Sabine, S. L., Warner, M., Devol, A., Krembs, C., and Maloy, C.: The combined effects of ocean acidification, mixing, and respiration on pH and
30
carbonate saturation in an urbanized estuary, Estuar. Coast. Shelf S., 88, 442–449, 2010.
BGD
10, 3079–3120, 2013Low pH and carbonate saturation
state in the North Yellow Sea
W.-D. Zhai et al.
Title Page
Abstract Introduction
Conclusions References
Tables Figures
◭ ◮
◭ ◮
Back Close
Full Screen / Esc
Printer-friendly Version Interactive Discussion
Discussion
P
a
per
|
Dis
cussion
P
a
per
|
Discussion
P
a
per
|
Discussio
n
P
a
per
|
Feng, S.-Z., Zhang, J., and Wei, H.: Environmental Dynamics in the Bohai Sea, Science Press, Beijing, China, 281 pp., 2007 (in Chinese).
Gao, K.-S., Aruga, Y., Asada, K., Ishihara, T., Akano, T., and Kiyohara, M.: Calcification in the articulated coralline algaCarollina pilulifera, with special reference to the effect of elevated CO2concentration, Mar. Biol., 117, 129–132, 1993.
5
Gieskes, J. M.: Effect of temperature on the pH of seawater, Limnol. Oceanogr., 14, 679–685, 1969.
Gruber, N., Hauri, C., Lachkar, Z., Loher, D., Fr ¨olicher, T. L., and Plattner, G. K.: Rapid progres-sion of ocean acidification in the California current system, Science, 337, 220–223, 2012. Hall-Spencer, J. M., Rodolfo-Metalpa, R., Martin, S., Ransome, E., Fine, M., Turner, S. M.,
10
Rowley, S. J., Tedesco, D., and Buia, M. C.: Volcanic carbon dioxide vents show ecosystem effects of ocean acidification, Nature, 454, 96–99, 2008.
Huang, B.-Q., Lan, W.-L., Cao, Z.-R., Dai, M.-H., Huang, L.-F., Jiao, N.-Z., and Hong, H.-S.: Spatial and temporal distribution of nanoflagellates in the northern South China Sea, Hydro-biologia, 605, 143–157, 2008.
15
Lee, K., Tong, L. T., Millero, F. J., Sabine, C. L., Dickson, A. G., Goyet, C., Park, G. H., Wan-ninkhof, R., Feely, R. A., and Key, R. M.: Global relationships of total alkalinity with salinity and temperature in surface waters of the world’s oceans, Geophys. Res. Lett., 33, L19605, doi:10.1029/2006GL027207, 2006.
Lewis, E., and Wallace, D. W. R.: Program Developed for CO2 System Calculations,
20
ORNL/CDIAC-105, Carbon Dioxide Information Analysis Center, Oak Ridge National Lab-oratory, US Department of Energy, Oak Ridge, Tennessee, 1998.
Millero, F. J., Graham, T. B., Huang, F., Bustos-Serrano, H., and Pierrot, D.: Dissociation con-stants of carbonic acid in seawater as a function of salinity and temperature, Mar. Chem., 100, 80–94, 2006.
25
Mucci, A.: The solubility of calcite and aragonite in seawater at various salinities, temperatures, and one atmosphere total pressure, Am. J. Sci., 283, 780–799, 1983.
Munday, P. L., Dixson, D. L., Donelson, J. M., Jones, G. P., Pratchett, M. S., Devitsina, G. V., and Døving, K. B.: Ocean acidification impairs olfactory discrimination and homing ability of a marine fish, P. Natl. Acad. Sci. USA, 106, 1848–1852, 2009.
30
BGD
10, 3079–3120, 2013Low pH and carbonate saturation
state in the North Yellow Sea
W.-D. Zhai et al.
Title Page
Abstract Introduction
Conclusions References
Tables Figures
◭ ◮
◭ ◮
Back Close
Full Screen / Esc
Printer-friendly Version Interactive Discussion
Discussion
P
a
per
|
Dis
cussion
P
a
per
|
Discussion
P
a
per
|
Discussio
n
P
a
per
|
Ning, X.-R., Lin, C.-L., Su, J.-L., Liu, C.-G., Hao, Q., Le, F.-F., and Tang, Q.-S.: Long-term environmental changes and the responses of the ecosystems in the Bohai Sea during 1960– 1996, Deep-Sea Res. Pt. II, 57, 1079–1091, 2010.
Parsons, T. R., Yoshiaki, M., and Lalli, C. M.: A Manual of Chemical and Biological Methods for Seawater Analysis, Pergamon Press, Oxford, 1984.
5
Pelletier, G. J., Lewis, E., and Wallace, D. W. R.: CO2SYS.XLS: a Calculator for the CO2System in Seawater for Microsoft Excel/VBA, Version 16, Washington State Department of Ecology, Olympia, Washington, 2011.
Sunda, W. G., and Cai, W.-J.: Eutrophication induced CO2-acidification of subsurface coastal waters: interactive effects of temperature, salinity, and atmosphericpCO2, Environ. Sci.
Tech-10
nol., 46, 10651–10659, 2012.
Wang, H.-J., Yang, Z.-S., Saito, Y., Liu, J.-P., Sun, X.-X., and Wang, Y.: Stepwise decreases of the Huanghe (Yellow River) sediment load (1950–2005): impacts of climate change and human activities, Global Planet. Change, 57, 331–354, 2007.
Wang, X.-L., Zhang, L.-J., Su, Z., Li, Y., Zhang, X.-S., and Gao, H.-W.: The conservative and
15
non-conservative behavior of total alkalinity in the Huanghe estuary, J. Ocean Univ. China, 35, 1063–1066, 2005 (in Chinese).
Wang, Y.-C, Liu, Z., Gao, H.-W., Ju, L., and Guo, X.-Y.: Response of salinity distribution around the Yellow River mouth to abrupt changes in river discharge, Cont. Shelf Res., 31, 685–694, 2011.
20
WMO/GAW: The state of greenhouse gases in the atmosphere based on global observations through 2011, WMO Greenhouse Gas Bull., no. 8, 1–4, 2012.
Wong, G. T. F.: Removal of nitrite interference in the Winkler determination of dissolved oxygen in seawater, Mar. Chem., 130/131, 28–32, 2012.
Wu, D.-X., Mu, L., Li, Q., Bao, X.-W., and Wan, X.-Q.: Characteristics of long-term variations of
25
sea water salinity in the Bohai Sea and the possible controls, Prog. Nat. Sci., 14, 191–195, 2004 (in Chinese).
Yuan, Y.-X., Chen, J.-F., Chen, B.-J., Qu, K.-M., Guo, F., Li, Q.-F., and Cui, Y.: Study on adapt-ability of scallopChlamys farrerito environment: effects of salinity and pH on survival, respi-ration, ingestion and digestion, J. Fish Sci. China, 7, 73–77, 2000 (in Chinese).
30
Zeebe, R. E., Zachos, J. C., Caldeira, K., and Tyrrell, T.: Carbon emissions and acidification, Science, 321, 51–52, 2008.
BGD
10, 3079–3120, 2013Low pH and carbonate saturation
state in the North Yellow Sea
W.-D. Zhai et al.
Title Page
Abstract Introduction
Conclusions References
Tables Figures
◭ ◮
◭ ◮
Back Close
Full Screen / Esc
Printer-friendly Version Interactive Discussion
Discussion
P
a
per
|
Dis
cussion
P
a
per
|
Discussion
P
a
per
|
Discussio
n
P
a
per
|
Zhai, W.-D., Zhao, H.-D., Zheng, N., and Xu, Y.: Coastal acidification in summer bottom oxygen-depleted waters in northwestern-northern Bohai Sea from June to August in 2011, Chin. Sci. Bull., 57, 1062–1068, 2012.
Zhang, J.: Atmospheric wet deposition of nutrient elements: correlation with harmful biological blooms in Northwest Pacific coastal zones, Ambio, 23, 464–468, 1994.
BGD
10, 3079–3120, 2013Low pH and carbonate saturation
state in the North Yellow Sea
W.-D. Zhai et al.
Title Page
Abstract Introduction
Conclusions References
Tables Figures
◭ ◮
◭ ◮
Back Close
Full Screen / Esc
Printer-friendly Version Interactive Discussion
Discussion
P
a
per
|
Dis
cussion
P
a
per
|
Discussion
P
a
per
|
Discussio
n
P
a
per
|
Table 1. Cruise summary and typical temperature, salinity, TAlk, pHT, DO, and calculated
Ωarag in bottom waters at deep stations (water depth>25 m). Data were summarized using
mean±standard deviation.
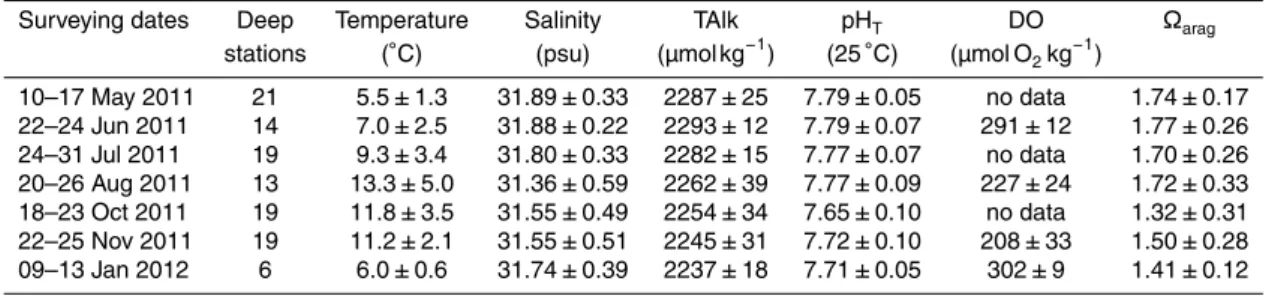
Surveying dates Deep Temperature Salinity TAlk pHT DO Ωarag stations (◦C) (psu) (µmol kg−1) (25◦C) (µmol O
2kg− 1)
10–17 May 2011 21 5.5±1.3 31.89±0.33 2287±25 7.79±0.05 no data 1.74±0.17 22–24 Jun 2011 14 7.0±2.5 31.88±0.22 2293±12 7.79±0.07 291±12 1.77±0.26 24–31 Jul 2011 19 9.3±3.4 31.80±0.33 2282±15 7.77±0.07 no data 1.70±0.26 20–26 Aug 2011 13 13.3±5.0 31.36±0.59 2262±39 7.77±0.09 227±24 1.72±0.33 18–23 Oct 2011 19 11.8±3.5 31.55±0.49 2254±34 7.65±0.10 no data 1.32±0.31 22–25 Nov 2011 19 11.2±2.1 31.55±0.51 2245±31 7.72±0.10 208±33 1.50±0.28 09–13 Jan 2012 6 6.0±0.6 31.74±0.39 2237±18 7.71±0.05 302±9 1.41±0.12
BGD
10, 3079–3120, 2013Low pH and carbonate saturation
state in the North Yellow Sea
W.-D. Zhai et al.
Title Page
Abstract Introduction
Conclusions References
Tables Figures
◭ ◮
◭ ◮
Back Close
Full Screen / Esc
Printer-friendly Version Interactive Discussion
Discussion
P
a
per
|
Dis
cussion
P
a
per
|
Discussion
P
a
per
|
Discussio
n
P
a
per
|
41oN
40
39
38
37
118 120 122 124 126 oE
36 Depth
(m)
0
10
20
30
40
50
60
70
80
90
100
Yellow
River
Bohai Sea
Yellow Sea
D
P
R
K
Liaoning Province
China
Shandong Province
China
1
2
Dalian
Yalu River
Korea Bay
Fig. 1.Area map and sampling sites. Closed circles were sampled in May, July, and October.
BGD
10, 3079–3120, 2013Low pH and carbonate saturation
state in the North Yellow Sea
W.-D. Zhai et al.
Title Page
Abstract Introduction
Conclusions References
Tables Figures
◭ ◮
◭ ◮
Back Close
Full Screen / Esc
Printer-friendly Version Interactive Discussion
Discussion
P
a
per
|
Dis
cussion
P
a
per
|
Discussion
P
a
per
|
Discussio
n
P
a
per
|
J F M A M J J A S O N D J F
2011 2012
0 500 1000 1500 2000 2500 3000 3500
Wat
er di
sc
harge
(m
3 s -1)
0 200 400 600 800 1000
1950 1960 1970 1980 1990 2000 2010
Annu
al
wa
te
r di
sc
h
arge
(1
0
8 m 3 yr -1)
(a)
(b)
Fig. 2.Evolutions of water discharge from the Yellow River empting into the Bohai Sea from
January 2011 to February 2012(a), and from 1950 to 2011(b). Annual data of 1950–2005 were from Wang et al. (2007), while real time data of 2006–2012 were weekly downloaded from website of China Bureau of Hydrology (http://xxfb.hydroinfo.gov.cn/). Vertical grey columns in
(a)show surveying dates.
BGD
10, 3079–3120, 2013Low pH and carbonate saturation
state in the North Yellow Sea
W.-D. Zhai et al.
Title Page
Abstract Introduction
Conclusions References
Tables Figures
◭ ◮
◭ ◮
Back Close
Full Screen / Esc
Printer-friendly Version Interactive Discussion
Discussion
P
a
per
|
Dis
cussion
P
a
per
|
Discussion
P
a
per
|
Discussio
n
P
a
per
|
0
20
40
60
80
0 5 10 15 20 25
P
res
sure (db)
0
20
40
60
80
0 5 10 15 20 25
0
20
40
60
80
0 5 10 15 20 25
0
20
40
60
80
0 5 10 15 20 25
P
re
ssure (db)
0
20
40
60
80
0 5 10 15 20 25
0
20
40
60
80
0 5 10 15 20 25
Temperature (oC)
(c) (b)
(f) (e)
(d)
July
August October November
June May
January
(a)
BGD
10, 3079–3120, 2013Low pH and carbonate saturation
state in the North Yellow Sea
W.-D. Zhai et al.
Title Page
Abstract Introduction
Conclusions References
Tables Figures
◭ ◮
◭ ◮
Back Close
Full Screen / Esc
Printer-friendly Version Interactive Discussion
Discussion
P
a
per
|
Dis
cussion
P
a
per
|
Discussion
P
a
per
|
Discussio
n
P
a
per
|
25 26 27 28 29 30 31 32
May June July
August October
November (f)
(a) (b) (c)
(d) (e)
(g)
January
Salinity (psu)
Fig. 4.Distributions of salinity in bottom waters.
BGD
10, 3079–3120, 2013Low pH and carbonate saturation
state in the North Yellow Sea
W.-D. Zhai et al.
Title Page
Abstract Introduction
Conclusions References
Tables Figures
◭ ◮
◭ ◮
Back Close
Full Screen / Esc
Printer-friendly Version Interactive Discussion
Discussion
P
a
per
|
Dis
cussion
P
a
per
|
Discussion
P
a
per
|
Discussio
n
P
a
per
|
0 0.5 1 2 4 6 8 10 chl-a
(μg L-1)
May July
October January
(a) (b)
(c) (d)
BGD
10, 3079–3120, 2013Low pH and carbonate saturation
state in the North Yellow Sea
W.-D. Zhai et al.
Title Page
Abstract Introduction
Conclusions References
Tables Figures
◭ ◮
◭ ◮
Back Close
Full Screen / Esc
Printer-friendly Version Interactive Discussion
Discussion
P
a
per
|
Dis
cussion
P
a
per
|
Discussion
P
a
per
|
Discussio
n
P
a
per
|
0
20
40
60
80
50% 80% 110% 140%
0
20
40
60
80
50% 80% 110% 140%
0
20
40
60
80
50% 80% 110% 140%
0
20
40
60
80
50% 80% 110% 140%
June August
November January
(a) (b)
(d) (c)
DO saturation
Pressure (db)
Fig. 6.Depth profiles of dissolved oxygen (DO) saturation.