Projection of Young-Old and Old-Old with
Functional Disability: Does Accounting for
the Changing Educational Composition of
the Elderly Population Make a Difference?
John P. Ansah1*, Rahul Malhotra1, Nicola Lew1, Chi-Tsun Chiu1, Angelique Chan1,2, Steffen Bayer1, David B. Matchar1,3
1Signature Program in Health Services and Systems Research, Duke-NUS Graduate Medical School, Singapore, Singapore,2Department of Sociology, National University of Singapore, Singapore, Singapore,
3Department of Medicine, Duke University Medical Center, Durham, North Carolina, United States of America
Abstract
This study compares projections, up to year 2040, of young-old (aged 60-79) and old-old (aged 80+) with functional disability in Singapore with and without accounting for the chang-ing educational composition of the Schang-ingaporean elderly. Two multi-state population models, with and without accounting for educational composition respectively, were developed, pa-rameterized with age-gender-(education)-specific transition probabilities (between active, functional disability and death states) estimated from two waves (2009 and 2011) of a na-tionally representative survey of community-dwelling Singaporeans aged60 years (N=4,990). Probabilistic sensitivity analysis with the bootstrap method was used to obtain the 95% confidence interval of the transition probabilities. Not accounting for educational composition overestimated the young-old with functional disability by 65 percent and under-estimated the old-old by 20 percent in 2040. Accounting for educational composition, the proportion of old-old with functional disability increased from 40.8 percent in 2000 to 64.4 percent by 2040; not accounting for educational composition, the proportion in 2040 was 49.4 percent. Since the health profiles, and hence care needs, of the old-old differ from those of the young-old, health care service utilization and expenditure and the demand for formal and informal caregiving will be affected, impacting health and long-term care policy.
Introduction
Aging is an issue that will impact population demographics and health profiles everywhere. Be-tween 2000 and 2040, the number of people at least 60 years of age worldwide is projected to grow from 610 million to more than 2 billion [1]. Medical advances have improved health and delayed mortality, resulting in a shift in population age structures globally. In part due to these OPEN ACCESS
Citation:Ansah JP, Malhotra R, Lew N, Chiu C-T, Chan A, Bayer S, et al. (2015) Projection of Young-Old and Young-Old-Young-Old with Functional Disability: Does Accounting for the Changing Educational Composition of the Elderly Population Make a Difference? PLoS ONE 10(5): e0126471. doi:10.1371/journal.pone.0126471
Academic Editor:Giuseppe Sergi, University of Padova, ITALY
Received:September 25, 2014
Accepted:April 2, 2015
Published:May 14, 2015
Copyright:© 2015 Ansah et al. This is an open access article distributed under the terms of the
Creative Commons Attribution License, which permits
unrestricted use, distribution, and reproduction in any medium, provided the original author and source are credited.
Data Availability Statement:All relevant data are within the paper and its Supporting Information files.
Funding:This work was supported by the Singapore Ministry of Health’s National Medical Research Council under its STaR Award Grant (grant number NMRC|STaR|0005|2009) as part of the project
reasons and significant developments in overall living standards, the Southeast Asian city-state Singapore has transitioned from a young population with high fertility and mortality rates in the 1980s to an aging population characterized by low mortality and below-replacement level fertility rates [2–4]. This demographic shift has also largely been fueled by the aging post-war baby boomer generation. In Singapore, the proportion of elderly aged 60 years and older is ex-pected to rise from 16 percent of the population in 2014 to over 30 percent of the population by 2040 [1]. Within this cohort, the group aged 80+ is anticipated to increase more than 4 times, from 121,800 in 2014 to 567,500 in 2040 [1]. This rapid growth of the elderly population is a source of concern due to the health implications of aging.
While people are increasingly avoiding fatal events, they are often not avoiding the physio-logical changes associated with aging and the accumulation of chronic conditions such as func-tional disability [5–10]. In 2001, the WHO adopted the International Classification of
Functioning, Disability and Health (ICF) to measure health and disability more broadly. In this paper, however, we look specifically at functional disability, which we have operationally de-fined as difficulty performing one or more activities of daily living (ADLs) or instrumental ADLs (IADLs). Functional disability is most common among the elderly [11], increasing their care needs, impacting family and other caregivers, and affecting health care utilization and ex-penditure. Thus, functional disability is a significant issue that accompanies population aging and merits great attention.
Since the 1980s, the elderly population in many countries has been substantial enough to warrant a sub-division of the cohort comprising individuals above the age of 60 [12–15], help-ing researchers identify the heterogeneity of the elderly population. Researchers have acknowl-edged the variability among those aged 60 and above and conducted multiple studies
attempting to determine the characteristics of the burgeoning old-old (aged 80+ years) cohort [16–19]; some have even suggested a delay of the traditional cut-off point of 60 or 65 that de-marcates entry into old age in light of the different health profiles of those aged 70, 78, and 85 [20]. Age-specific variations in mortality rates above 85 [21], as well as elevated risks of devel-oping health problems like depression [22], dementia [23–25] and disability [20,24] among the old-old have also supported the further delineation of age groups among those above 60. In this study, we too distinguish two cohorts of the elderly, the“old-old”and the“young-old,”to describe those aged 80+ and those aged 60–79 years respectively.
Aging alone could lead to undesirable consequences from a policymaker’s perspective such as rising dependency, greater health care utilization [26] and escalating health care costs [27–
29]. Additionally, numerous studies have demonstrated that the old-old have higher rates of health services utilization for both acute care [20,30,31] and long-term care [32,33] than the young-old. A rise in functional disability could exacerbate these problems. Elderly with func-tional disability are associated with greater formal long-term care use [34,35] and acute care utilization [36], and may result in growing health care expenditures [37]. Primary caregivers of those with severe disability also display elevated risks of high stress and depression [38], plac-ing greater strain on the health care system. Furthermore, there could be unanticipated effects on other sectors: research shows that caregivers of elderly with functional disability may choose to give care full-time [39], potentially decreasing participation in the labor market. The impor-tance of studying functional disability is amplified when we consider that functional disability is a crucial determinant of service needs. The ability to perform ADLs and IADLs is necessary for independent living and is thus a good indicator of the future need for caregivers, home-based and community services, as well as nursing homes, which are all relevant to policymak-ing. Currently, disability measures are used to assess individuals’qualification for care pro-grams and aid schemes. In Singapore, disabled Singaporeans are eligible to claim benefits under the ElderShield disability insurance scheme [40]. Meanwhile, in Taiwan, disabled analysis, decision to publish, or preparation of the
manuscript.
citizens over 50 years of age are eligible to receive services such as home rehabilitation and nursing under the national 10-year long-term care plan [41]. Hence, functional disability pro-jections are useful tools for policymakers to assess the elderly population’s health and social care needs and mitigate the negative consequences of aging and disability.
In the past few decades, studies have shown that socioeconomic factors, particularly educa-tion, are strong predictors of mortality and morbidity [42]. A higher level of education is asso-ciated with lower levels of disability, morbidity and mortality [42,43]. The relationship between education and disability has been supported in a number of populations using differ-ent methodologies, and measures such as the ability to perform ADLs and IADLs, cognitive ability and mobility status (needing help climbing stairs or walking half a mile), though not consistently [44]. Freedman and Martin [45] provided early evidence supporting the effect of education on declines in functional limitations among elderly Americans; of eight demographic and socioeconomic variables considered (education, age, sex, race, ethnicity, marital status, fi-nancial assets, and region), they found that education was the most important in explaining the declines in functional limitations. Sulander and colleagues [46] made a similar finding among Finns aged 65–84 years: those with a higher education had significantly better function-al ability (lower prevfunction-alence of ADL limitations) than those with a lower education, even after adjusting for age, survey period, chronic diseases and depressive symptoms.
In making functional disability projections, the differential effects of education on disability incidence, recovery and mortality are particularly relevant. Multiple studies have associated a lower level of education with higher disability incidence [47–51], though this association may depend somewhat on the disability measure used. For instance, Jagger and colleagues [52] found that having 9 years of full-time education or less was associated with higher incidence of mobility disability in both men and women, but was only associated with higher incidence of ADL disability in women. While several studies have found no relationship between education and recovery from disability [48–51], Jagger and colleagues [52] found that those with 9 years of education or less had a lower recovery of mobility disability. Meanwhile, researchers exam-ining education and mortality in those with disability found no association between the two [47,48,52]. Nonetheless, the studies examining education and incidence and recovery suggest that failing to account for education could affect functional disability projections.
Similar studies conducted in Asia suggest that the strong association between education and disability incidence observed in Western societies may not translate similarly in an Asian set-ting. A study conducted in 2012 among elderly Japanese found statistically significant differ-ences by education in disability incidence but not recovery from disability (though this could be due to the small sample sizes for mortality and recovery states and the transitions therein) [47]. An older study conducted in 1998 in Taiwan similarly only found an association between educational levels and disability incidence [53]. However, studies published in 2007 in Indone-sia that examine the relationship between education and disability using functional health sta-tus, active life expectancy, or functional transitions as a measure have not found robust associations between education and disability [54,55]. While Kaneda and Zimmer cite the low education rates among the elderly in Indonesia as a potential reason for the weak association [55], the variation in education and disability trends that countries in Asia display highlights the need for further research in this area not only in Asia but also in individual countries like Singapore.
to account for the changing educational composition of the future elderly population. Disabili-ty projections have been made to gauge the future long-term care need in the U.S. [56], U.K. [57] and Australia [58], as well as to determine the costs of caring for the population of disabled [59,60], but, to our knowledge, only one study thus far makes functional disability projections taking changing educational composition of the population into account. In this study, Samir & Lentzner [43] used sample data from 70 countries that participated in the World Health Sur-vey to project levels of disability to 2050 and reported that the prevalence of disability was con-sistently lower when they accounted for changing educational composition of the population in their projections.
Against this backdrop, projecting functional disability among elderly Singaporeans provides an ideal setting for considering the practical impact of educational composition of the elderly population. This study aimed to compare projections, up to year 2040, of young-old (aged 60– 79) and old-old (aged 80+) with functional disability in Singapore with and without accounting for the changing educational composition of the Singapore elderly population and achieved this aim.
Materials and Methods
To determine if the future number of Singaporean elderly with functional disability would dif-fer with and without accounting for a changing educational composition, two dynamic multi-state population models—one not accounting for educational composition and the other ac-counting for educational composition in disability transition probabilities, fertility rates, and mortality rates—were developed. The models required standard demographic data as well as estimates of the following transition probabilities: from active to functional disability, from functional disability to active, from active to death and functional disability to death. Demo-graphic data was obtained from the Department of Statistics Singapore (S1–S5 Files). The tran-sition probabilities and retention probabilities (probability of remaining in the same state) were estimated from two waves of a nationally representative survey of community-dwelling Singaporeans aged60 years (N = 4,990)—Wave 1, referred to as the Social Isolation, Health and Lifestyles Survey (SIHLS), conducted in 2009, and Wave 2, referred to as the Panel on Health and Aging of Singaporean Elderly (PHASE), conducted in 2011. Sampling methodology and survey details of the SIHLS [61] is available from the literature as cited and more details on each of these components are given below.
Dynamic multi-state population model
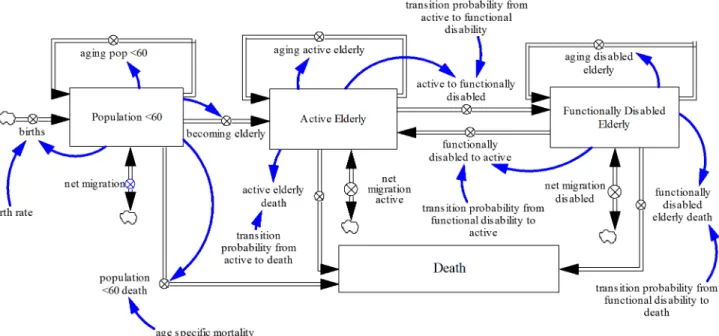
Two dynamic multi-state population models (i.e., with and without accounting for educational composition) were constructed using Vensim DSS (Ventana Inc). The dynamic multi-state population models were continuous time compartment models with explicit population stocks.
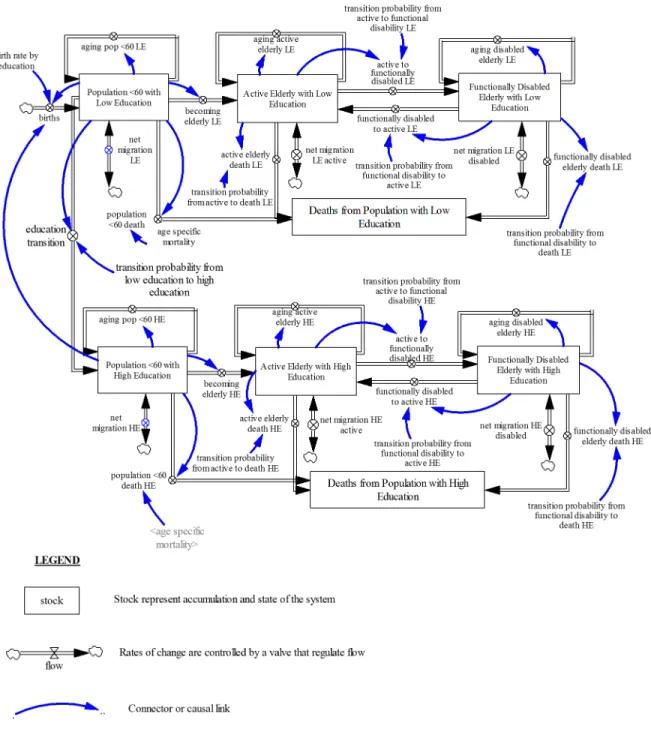
Fig 1depicts the structure of the model not accounting for educational composition. Fig 2depicts the structure of the model accounting for educational composition.
calculated using mortality rates for each age cohort obtained from life tables [62]. Emigration was estimated by calibration [63]. The aging process ensures that at the end of every year, the surviving population in each age cohort transitions to the subsequent cohort except for the final age cohort (aged 100 and older). The model configuration allows elderly Singaporeans to transition between the active and functional disability states, or flow out from either state as they die or emigrate. Disability transition probability estimates used here were not specific for education.
In Singapore, individuals typically attend pre-school from the ages of 4–6, primary school from 7–12, secondary school from 13–16, post-secondary school from 17–19, and university from 20–23 [64]. In the model that accounts for education, the fertility rates, mortality rates and disability transition probabilities were education-specific as seen inFig 2. Between ages 15 to 19, individuals could transition from low education (primary school education or less) to high education (secondary school education or higher), with this transition probability from low education to high education decreasing from 15 to 19 in line with past trends observed in the Singapore education system [65]. This demarcation was deemed appropriate due to low ed-ucational attainment levels of the current cohort of elderly, who did not benefit from Singa-pore’s subsequent push for greater education. The education transition assumes that changes in education by age and gender are uni-directional i.e. over time, people can only remain at their current educational level or move to a higher educational level and cannot move back-ward. It must be noted that no one is born into the high education population cohort because the transition into this cohort is assumed to occur between ages 15 to 19. Hence, all individuals below this age range are in the low education population cohort. Similar to the model described above, the low education and high education groups were each divided into three groups: the population under 60, active elderly and functionally disabled elderly. Within each group, the population was further sub-divided by age (single age cohorts from age 0—age 59 years for the under 60 group and single age cohorts from age 60-age 100 and older for the active and func-tionally disabled elderly groups) and gender.
Fig 1. Dynamic Multi-state Population Model Not Accounting for Education.Population model with fertility rates, mortality rates and disability transition probabilities that are not education-specific.
Assumptions
1. Fertility rate
a. The multi-state population model not accounting for educational composition used total fertility rates of Singapore from 2000 to 2013 as provided by the Department of Statistics Fig 2. Dynamic Multi-state Population Model Accounting for Education.Population model with education-specific fertility rates, mortality rates and disability transition probabilities.
Singapore to populate the model (S3 File). The fertility rate from 2013 to 2040 was as-sumed to remain constant.
b. The multi-state population model accounting for educational composition used fertility rates by education from 2000 to 2013 as provided by the Department of Statistics Singa-pore to populate the model (S3 File). The fertility rates by education from 2013 to 2040 were assumed to remain constant.
2. Mortality rate
a. The multi-state population model not accounting for educational composition applied age-specific mortality rates from 2000 to 2013 provided by the Department of Statistics Singapore (S1–S2 Files) to the population below 60 years of age. Mortality rates for those under 60 were assumed to remain constant from 2013 to 2040. For the population above 60, the mortality rates were estimated from SIHLS and PHASE. Likely changes in mortal-ity rates for those above 60 were addressed using bootstrap estimates.
b. The multi-state population model accounting for educational attainment applied age-specific mortality rates not disaggregated by education from 2000 to 2013 to the popula-tion below 60 years of age as mortality rates by educapopula-tion were not provided by the De-partment of Statistics Singapore. Hence, it was assumed that there were no educational differences in mortality for individuals below 60 years of age. Mortality rates for those under 60 were assumed to remain constant from 2000 to 2013. For individuals 60 years or older, mortality rates by education were estimated from SIHLS and PHASE and ap-plied. Likely changes in mortality rates for those above 60 were addressed using bootstrap estimates.
3. Education transition probabilities
a. The multi-state population model accounting for educational composition assumed that the educational transition occurred between ages 15–19. Educational transition probabil-ities were derived from the reference as cited [65].
4. Disability transition probabilities
a. Disability transition probabilities were estimated only for those above 60 as this paper fo-cuses on disability among the elderly.
Data and estimation of transition probabilities
death, was included in Wave 2; information on the individual’s month and year of death was de-rived primarily from the Singapore Registry of Births and Deaths or secondarily from decedent interviews with next-of-kin in Wave 2.
Using the longitudinal data, the probabilities of transitioning between active and functional disability states and from active and functional disability states to death were estimated for the overall sample as well as separately for those with low education and for those with high educa-tion. For the overall sample, Eq (1) below, with age and sex as covariates, was used in the dy-namic multi-state population model not accounting for educational composition. For those with low and high education respectively, Eq (2) below, with age, sex and education as covari-ates, was used in the dynamic multi-state population model accounting for educational compo-sition. The equations were solved through two multinomial logistic regression models using the“multinom”function in R [66].
lnðpij pii
Þ ¼b0ijþb1ijageþb2ijsex ð1Þ
lnðpij pii
Þ ¼b0ijþb1ijageþb2ijsexþb3ijeducation ð2Þ
pijis the disability transition probability from the current stateito statej(i6¼j), whereiis
ac-tive or functional disability andjis active, functional disability or death.
As suggested by the equations, the disability transition probabilities were disaggregated ac-cording to age (single age cohort from age 60—age 100+) and gender; for Eq (2), disability transition probabilities were additionally disaggregated by education.
Probabilistic Sensitivity Analysis
After computing point estimates for the disability transition probabilities from the multinomial logistic regression models (Eqs (1) and (2) above), the bootstrap method was used to estimate the distribution of disability transition probabilities to obtain the 95% confidence interval around these point estimates. First, we standardized the sampling weights, then used the stan-dardized weights as probabilities to draw bootstrap samples using the‘‘sample”function in R (v3.0.2). This process was repeated 300 times. Next, disability transition probabilities were esti-mated using the 300 samples with the two multinomial logistic regression models. Based on the 300 sets of estimated disability transition probabilities, the distribution of age-sex-(educa-tion)-specific disability transition probabilities and 95% confidence intervals (empirical inter-vals) were obtained (S1–S2Figs).
Results
Transition probabilities by age, gender and education
incidence of functional disability (Fig 3A), lower recovery from functional disability (Fig 3B), and higher probability of mortality for both active (Fig 3C) and functional disability states (Fig 3D) than those with high education.
Forecasting the number of elderly with functional disability
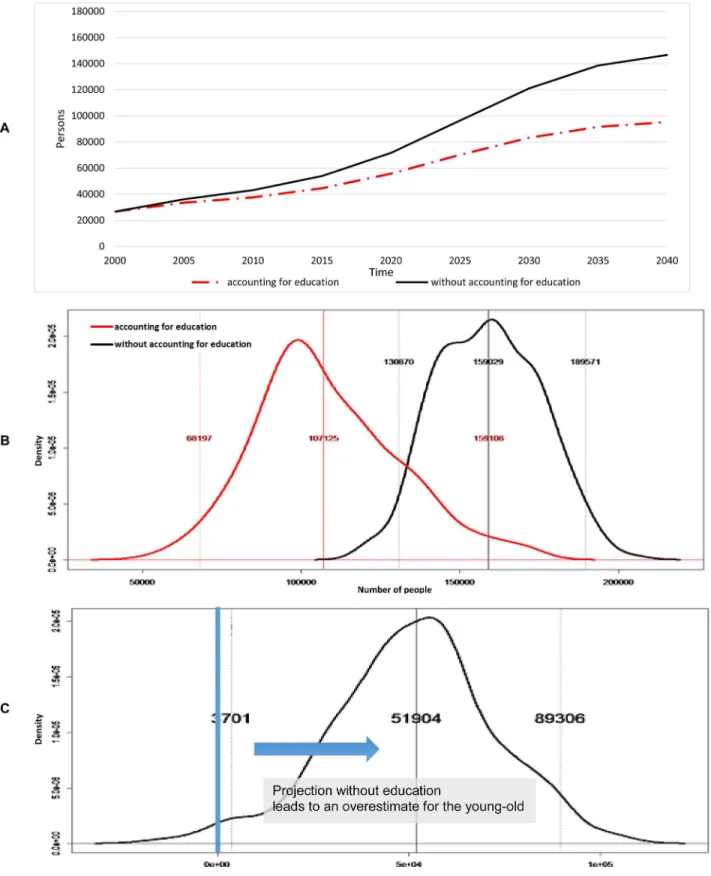
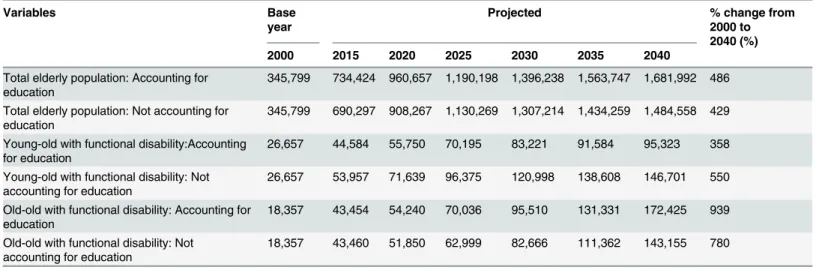
We looked at the population projections for the young-old (Fig 4A) and old-old (Fig 5A) up to year 2040 and compared them to year 2000 (Table 1). Accounting for educational composition, the total elderly population was projected to increase 486 percent from about 345,800 in 2000 to approximately 1.68 million by 2040 (Table 1); of these 1.68 million elderly in 2040, approxi-mately 95 percent were expected to have high education compared to 40 percent in 2000. Meanwhile, not accounting for educational composition, the total elderly population in Singa-pore was projected to increase 429% from about 345,800 in 2000 to about 1.48 million by 2040 (Table 1). Looking first at the young-old, not accounting for educational composition was pro-jected to overestimate the young-old by 65 percent relative to the projection made accounting for educational composition (Fig 4A).Fig 4Bshows the distribution of young-old with func-tional disability at 2040 whileFig 4Cdemonstrates the difference between projected young-old with functional disability with and without accounting for educational composition at 2040. These were estimated from 300 bootstrap samples, wherein transition probabilities were esti-mated from the same bootstrap sample. Probabilistic sensitivity analysis indicated a 98 percent likelihood that not accounting for educational composition overestimates the young-old with functional disability by 2040 (Fig 4C). The 95 percent confidence range for the effect of ac-counting for educational composition was an overestimation of the proportion of young-old with functional disability between 0.25 percent and 6 percent of total elderly by 2040.
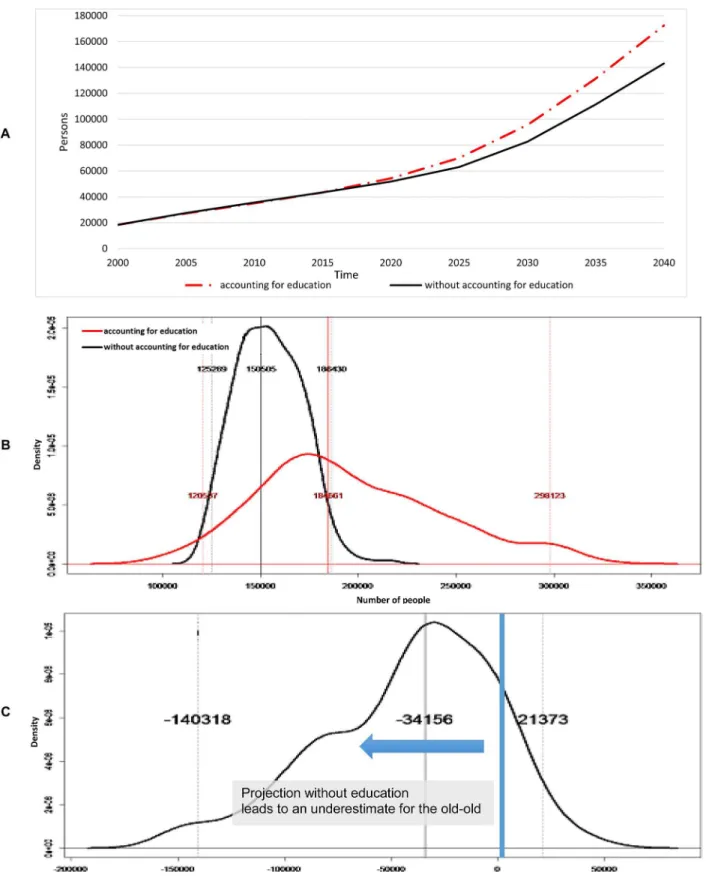
For the old-old, not accounting for educational composition was projected to underestimate the old-old by 20 percent in the year 2040. Accounting for educational composition, the pro-portion of old-old with functional disability is projected to increase from 40.8 percent of the total elderly with disability in 2000 to 64.4 percent in 2040; in the meantime, not accounting for educational composition, the proportion of the old-old with functional disability is pro-jected to increase from 40.8 percent in 2000 to 49.4 percent in 2040 (Fig 5A).Fig 5Bshows the distribution of elderly with functional disability for the old-old at 2040 whileFig 5C demon-strates the difference between projected elderly individuals with functional disability with and without accounting for educational composition for the old-old at 2040. For the old-old, proba-bilistic sensitivity analysis suggested an 86 percent chance at 2040 (Fig 5C) that not accounting for educational composition will underestimate the old-old with functional disability; the likely underestimation was estimated to be as much as 9.4 percent of total elderly in 2040 at a 95 per-cent confidence level.
Discussion
In projecting the future number of elderly with functional disability, we found that failing to ac-count for changes in educational composition would lead to an overestimation of the young-old with functional disability and an underestimation of the young-old-young-old with functional disability. Of the elderly with functional disability, accounting for educational composition would lead to a higher projection of the proportion belonging to the old-old (64 percent by 2040) as com-pared to the proportion projected without accounting for educational composition (49.4 Fig 3. Transition Probabilities by Age, Gender and Education.(A) Transition probabilities from active to functional disability. (B) Transition probabilities from functional disability to active. (C) Transition probabilities from active to death. (D) Transition probabilities from functional disability to death.
Fig 4. Young-old (aged 60–79).(A) Projected number of young-old with functional disability. (B) Distribution of young-old with functional disability at 2040.
Fig 5. Old-old (aged 80+).(A) Projected number of old-old with functional disability. (B) Distribution of old-old with functional disability at 2040. (C) Difference between not accounting and accounting for educational composition at 2040.
percent by 2040). Accounting for uncertainty in the transition probability estimates indicates a high probability that not accounting for educational composition will underestimate the num-ber of old-old individuals with functional disability and overestimate the numnum-ber of young-old.
These findings can be explained by the interacting effects of education on mortality and transition to and from functional disability. Higher education has three primary effects: lower mortality, lower incidence of functional disability, and higher recovery of functional disability. A lower mortality, all things equal, will increase the number of surviving elderly and shift the overall age distribution of the elderly population, with a delay, from a younger to an older el-derly population. Alone, this will lead to an increase in the number of individuals with func-tional disability. This effect is counterbalanced by a lower incidence of funcfunc-tional disability and higher recovery of functional disability, which lowers the projected number of elderly with functional disability. Since the rate of transition to functional disability exceeds the rate from functional disability especially at older ages, the net effect of changing educational composition is an increase in the number with functional disability and a shift in the distribution of those with functional disability towards the old-old.
Only one study so far, to our knowledge, examines the effect of education on functional dis-ability projections. A study by Samir and Lentzner [43] on the effect of education on adult mor-tality and disability used sample data from 70 countries that participated in the world health survey and reported similar results: not taking educational composition into account, under all the scenarios considered, reports a higher prevalence of disability compared to scenarios taking education into account. However, this study only projects disability prevalence for the age group 30–74 as a whole. In contrast, our study provides disability projections for the numbers of elderly with functional disability for both 60–79 year olds and 80+ year olds and compares this difference with and without accounting for educational composition. The current study is distinctive as it isolates the effect of education composition on transitions to and from func-tional disability, and death, and directly examines the impact of accounting for educafunc-tional composition on the projections of young-old and old-old with functional disability.
In Singapore, we show that accounting for educational composition, it is highly likely that there will be fewer young-old with functional disability and more old-old with functional dis-ability than expected without accounting for educational composition. This phenomenon should be given due consideration in policy and planning. This is potentially a cause for con-cern since the health profiles of the old-old differ from those of the young-old, which translates Table 1. Projections of total elderly population, young-old with functional disability and old-old with functional disability up to the year.
Variables Base
year
Projected % change from
2000 to 2040 (%)
2000 2015 2020 2025 2030 2035 2040
Total elderly population: Accounting for education
345,799 734,424 960,657 1,190,198 1,396,238 1,563,747 1,681,992 486 Total elderly population: Not accounting for
education
345,799 690,297 908,267 1,130,269 1,307,214 1,434,259 1,484,558 429 Young-old with functional disability:Accounting
for education
26,657 44,584 55,750 70,195 83,221 91,584 95,323 358 Young-old with functional disability: Not
accounting for education
26,657 53,957 71,639 96,375 120,998 138,608 146,701 550 Old-old with functional disability: Accounting for
education
18,357 43,454 54,240 70,036 95,510 131,331 172,425 939 Old-old with functional disability: Not
accounting for education
18,357 43,460 51,850 62,999 82,666 111,362 143,155 780
into different care needs. On average, the old-old have more ADL/IADL limitations [20], with the prevalence of ADL difficulties and ADL dependency having been shown to increase with age even after the age of 90 [24]. Similarly, the old-old are at higher risk of developing dementia than the young-old—incidence rates of dementia increase exponentially from age 65 to 90 [23] and even beyond the age of 90 [25]. In Singapore, a survey conducted by the Agency for Inte-grated Care supports these findings: the survey reported a higher prevalence of ADL limitations and dementia in old-old Singaporeans than in young-old Singaporeans.
First, our study’s findings will impact health care service utilization as utilization rates of both long-term and acute care services are much higher for the old-old than the young-old. Separate studies have found that the old-old population tends to have higher rates of home care use and hospitalization [20], use more ambulatory health care services (family physician visits, specialist physician visits and emergency room visits) [30], outpatient, emergency and inpatient services [36] and have a higher likelihood of visiting the emergency department, being hospitalized and staying for a longer period in the hospital [31] than the young-old co-hort. The demand for long-term care services is also likely to increase as the old-old have been shown to use more post-acute care services including skilled nursing facilities and home health agency services than the young-old [32], and nursing home use has been associated with age, even among those aged 85 and above [33]. The higher risks of acquiring dementia and develop-ing ADL/IADL limitations among the burgeondevelop-ing old-old population will also affect the types of health care services demanded. Investigating the factors that affect whether an elderly indi-vidual chooses to age in place, Paganini-Hill [67] found that elderly with dementia and poor functional ability were less likely to live at home. Hence, future health care planners might con-sider increasing alternative living facilities or providing more comprehensive home care for the anticipated old-old group with disability and dementia to help them age in place, depending on the government’s preference for institutionalized care or home care.
The second area that will be impacted is health care expenditure. In the US, one study esti-mated that disability-associated health care expenditures represented 26.7% of national health spending [68], while another found that less than one-fifth of older persons (72 years or older) with disability at baseline or who developed disability during the course of the study accounted for approximately half of total health care expenditures [69]. Dementia also places a substantial financial burden on individuals. Each patient above 40 years of age with dementia in Indiana spent almost $10,000 more per year than each patient without dementia (largely due to more days spent in nursing homes) and the total expenditure of the cohort with dementia was 1.78 times that of the cohort without dementia; when analyzed within specific age stratum, demen-tia-associated expenditures accounted for 15% and 17% of total health expenditures of patients aged 65+ and 80+ respectively [70]. Moreover, numerous studies have shown that aging popu-lations are associated with greater health care expenditure [27–29,32,71]. All of these studies indicate escalating costs due not only to an aging population, but also due to a large old-old cohort who suffer from dementia and disability limitations, which will be of great concern to policymakers.
that tap into the larger active young-old group (60–79 years old) to care for the population of elderly with functional disability could potentially alleviate the high demand for caregiving. In countries like the United States, programs have been implemented where active elderly people volunteer to help their elderly neighbors with daily activities like shopping and doing house-work as well as regularly check in with them and refer them to professional services when nec-essary [75]. Private companies have also hired seniors to act as caregivers for other seniors in need [76]. These creative programs benefit the active elderly by providing them with some in-come and may be a source of meaningful engagement for them. At the same time, such pro-grams enable informal caregivers who might have left their jobs to care for elderly with functional disability to continue working. As demands for caregiving increase, such programs will become even more important in reducing the care burden of employed caregivers.
Another point worth considering is making provisions for the larger pool of healthy active young-old to continue working in order to increase elderly participation in the labor market. In Singapore, there has been ongoing discussion about extending the statutory retirement age, currently 62, to 65, or even to 70, in order to cope with a local labor shortage [77]. While some might argue that such a move would be politically unpopular, a 2003 study examining the atti-tudes of older workers towards work and retirement in Singapore suggested that work was a significant part of elderly Singaporeans’lives and that they would prefer to remain partially employed even after reaching the official retirement age [78]. One caveat is the gap between people’s expressed intentions and ultimate actions. Regardless, the active elderly population is a potential resource the Singaporean government can tap into. Currently, the Singaporean gov-ernment adopts policies such as allowing employers to re-evaluate the seniority-based wage system for employees above the age of 62 in order to make it cost-effective to hire older workers [79]. At the same time, the government supports elderly workers through job re-training and upgrading and workplace redesign. Continuing to create incentives for elderly people to work while negotiating with and encouraging employers to provide good working terms for their el-derly employees will help to ease the long-run labor shortage.
The dynamic multi-state population models presented have three limitations. First, the num-ber of elderly with functional disability relies largely on the projected population trend in Singa-pore. Any changes observed in the population trend, especially due to immigration policies, are likely to change the numerical values observed in the simulation. Second, the broad aggregation of education into low and high educational levels due to an inadequate survey sample in estimat-ing the transition probabilities is likely to lessen the full impact of education on functional dis-ability. This may lead to an over or under estimation of the number of elderly with functional disability. Third, given the relatively short interval between the two waves of the survey, there were a limited number of transitions that occurred during that time period; hence, our sample size was too small to disaggregate functional disability into further sub-categories.
Conclusion
education and needs related to functional disability. Policymakers would also benefit from a proactive approach that considers the effect of education on future disability and demographic changes when planning healthcare services and designing labor market polices.
Supporting Information
S1 Fig. Probabilistic Sensitivity Analysis Result from Bootstrap for Young-old with Func-tional Disability.(A) Accounting for educational composition. (B) Not accounting for educa-tional composition.
(TIF)
S2 Fig. Probabilistic Sensitivity Analysis Result from Bootstrap for Old-old with Function-al Disability.(A) Accounting for educational composition. (B) Not accounting for
educational composition. (TIF)
S3 Fig. Projected Total Elderly Population. (TIF)
S1 File. Abridged Life Tables of Singapore, 1990–2002. (XLS)
S2 File. Complete Life Tables of Singapore, 2003–2012. (XLS)
S3 File. Population Trends of Singapore, 2013. (XLS)
S4 File. Basic Demographic Characteristics of Singapore, 2000. (XLS)
S5 File. Population Education Profile of Singapore, 2000. (XLS)
Acknowledgments
The authors would like to acknowledge Mary Ann Bautista, who assisted with the project and Yasuhiko Saito for reading the manuscript and contributing valuable comments.
Author Contributions
Conceived and designed the experiments: JA DM. Performed the experiments: JA. Analyzed the data: JA CC. Contributed reagents/materials/analysis tools: JA RM NL CC AC SB DM. Wrote the paper: JA RM NL. Other resesarch: NL.
References
1. United Nations. World Population Prospects: The 2012 Revision, Highlights and Advance Tables. De-partment of Economic and Social Affairs PD; 2013 Contract No.: Working Paper No. ESA/P/WP.228.
2. Saw S- H. A decade of fertility below replacement level in Singapore. Journal of Biosocial Science. 1986; 18(04):395–401. PMID:3782191
3. Wen WK. Futures of Ageing in Singapore. Journal of Futures Studies. 2013; 17(3):81–102.
4. Lee WKM. Economic and Social Implications of Aging in Singapore. Journal of Aging & Social Policy. 1999 1999/10/29; 10(4):73–92.
6. Crimmins EM, Saito Y. Getting Better and Getting Worse: Transitions in Functional Status among Older Americans. Journal of Aging and Health. 1993; 5(1):3–36.
7. Lau RS, Johnson S, Kamalanabhan TJ. Healthy life expectancy in the context of population health and ageing in India. Asia-Pacific journal of public health / Asia-Pacific Academic Consortium for Public Health. 2012 Jan; 24(1):195–207. doi:10.1177/1010539510376663PMID:20685664
8. Vaupel JW. Biodemography of human ageing. Nature. 2010 Mar 25; 464(7288):536–42. doi:10.1038/ nature08984PMID:20336136
9. Lynch SM, Brown JS, Taylor MG. Demography of Disability. In: Uhlenberg P, editor. International Hand-book of Population Aging. Dordrecht, London: Springer; 2009.
10. Sakari R. Mobility and its decline in old age: determinants and associated factors: University of Jyväs-kylä; 2013.
11. Vermeulen J, Neyens JC, van Rossum E, Spreeuwenberg MD, de Witte LP. Predicting ADL disability in community-dwelling elderly people using physical frailty indicators: a systematic review. BMC geriat-rics. 2011; 11:33. doi:10.1186/1471-2318-11-33PMID:21722355
12. Soldo BJ, Manton KG. Changes in the Health Status and Service Needs of the Oldest Old: Current Pat-terns and Future Trends. The Milbank Memorial Fund Quarterly Health and Society. 1985; 63(2):286– 319. PMID:3889710
13. Manton KG, Soldo BJ. Dynamics of Health Changes in the Oldest Old: New Perspectives and Evi-dence. The Milbank Memorial Fund Quarterly Health and Society. 1985; 63(2):206–85. PMID:3889709
14. Field D, Minkler M. Continuity and Change in Social Support Between Young-old and Old-old or Very-old Age. Journal of Gerontology. 1988 July 1, 1988; 43(4):P100–P6. PMID:3385147
15. Mullins LC, Lopez MA. Death anxiety among nursing home residents: A comparison of the young-old and the old-old. Death Education. 1982 1982/03/01; 6(1):75–86. PMID:10254759
16. Metti AL, Yaffe K, Boudreau RM, Ganguli M, Lopez OL, Stone KL, et al. Change in Inflammatory Mark-ers and Cognitive Status in the Oldest-Old Women from the Study of Osteoporotic Fractures. Journal of the American Geriatrics Society. 2014; 62(4):662–6. doi:10.1111/jgs.12739PMID:24697580
17. Yaffe K, Middleton LE, Lui LY, Spira AP, Stone K, Racine C, et al. MIld cognitive impairment, dementia, and their subtypes in oldest old women. Archives of Neurology. 2011; 68(5):631–6. doi:10.1001/ archneurol.2011.82PMID:21555638
18. Vogelsang EM. Self-Rated Health Changes and Oldest-Old Mortality. The Journals of Gerontology Se-ries B: Psychological Sciences and Social Sciences. 2014 March 3, 2014.
19. Galenkamp H, Deeg DJH, Huisman M, Hervonen A, Braam AW, Jylhä M. Is Self-Rated Health Still Sen-sitive for Changes in Disease and Functioning Among Nonagenarians? The Journals of Gerontology Series B: Psychological Sciences and Social Sciences. 2013 August 6, 2013.
20. Jacobs JM, Maaravi Y, Cohen A, Bursztyn M, Ein-Mor E, Stessman J. Changing profile of health and function from age 70 to 85 years. Gerontology. 2012 2012; 58(4):313–21. doi:10.1159/000335238 PMID:22286330
21. Boscoe FP. Subdividing the Age Group of 85 Years and Older to Improve US Disease Reporting. Amer-ican Journal of Public Health. 2008; 98(7):1167. doi:10.2105/AJPH.2008.133900PMID:18511712
22. Chou K-L, Chi I. Prevalence and correlates of depression in Chinese oldest-old. International Journal of Geriatric Psychiatry. 2005; 20(1):41–50. PMID:15578666
23. Jorm AF, Jolley D. The incidence of dementia: a meta-analysis. Neurology. 1998; 51(3):728. PMID: 9748017
24. Berlau DJ, Corrada MM, Kawas C. The prevalence of disability in the oldest-old is high and continues to increase with age: findings from The 90+ Study. International Journal of Geriatric Psychiatry. 2009; 24(11):1217–25. doi:10.1002/gps.2248PMID:19259982
25. Corrada MM, Brookmeyer R, Paganini-Hill A, Berlau D, Kawas CH. Dementia incidence continues to in-crease with age in the oldest old: The 90+ study. Annals of Neurology. 2010; 67(1):114–21. doi:10. 1002/ana.21915PMID:20186856
26. Nie JX, Wang L, Tracy CS, Moineddin R, Upshur RE. Health care service utilization among the elderly: findings from the Study to Understand the Chronic Condition Experience of the Elderly and the Disabled (SUCCEED project). Journal of evaluation in clinical practice. 2008; 14(6):1044–9. doi: 10.1111/j.1365-2753.2008.00952.xPMID:19019098
28. Yang Z, Norton EC, Stearns SC. Longevity and health care expenditures: the real reasons older people spend more. The journals of gerontologySeries B, Psychological sciences and social sciences. 2003; 58(1):S2–S10.
29. Gerdtham UG. The impact of aging on health care expenditure in Sweden. Health policy (Amsterdam, Netherlands). 1993; 24(1):1–8. PMID:10125808
30. Nie JX, Wang L, Tracy CS, Moineddin R, Upshur REG. A population-based cohort study of ambulatory care service utilization among older adults. Journal of Evaluation in Clinical Practice. 2010; 16(4):825– 31. doi:10.1111/j.1365-2753.2009.01218.xPMID:20557407
31. Vilpert S, Ruedin HJ, Trueb L, Monod-Zorzi S, Yersin B, Bula C. Emergency department use by oldest-old patients from 2005 to 2010 in a Swiss university hospital. BMC Health Services Research. 2013 2013 Sep 8; 13:344. doi:10.1186/1472-6963-13-344PMID:24011089
32. Lubitz J, Greenberg LG, Gorina Y, Wartzman L, Gibson D. Three Decades Of Health Care Use By The Elderly, 1965–1998. Health affairs. 2001; 20(2):19–32. PMID:11260943
33. Finlayson M. Changes Predicting Long-Term Care Use Among the Oldest-Old. The Gerontologist. 2002 August 1, 2002; 42(4):443–53. PMID:12145372
34. Liu K, Manton KG, Aragon C. Changes in home care use by disabled elderly persons: 1982–1994. Journals of Gerontology, Series B, Psychological Sciences and Social Sciences [HWWilson—SSA]. 2000; 55B(4):S245.
35. Spillman BC, Pezzin LE. Potential and Active Family Caregivers: Changing Networks and the "Sand-wich Generation". The Milbank Quarterly. 2000; 78(3):347–74. PMID:11028188
36. Wu C-Y, Hu H-Y, Li C-P, Fang Y-T, Huang N, Chou Y-J. The association between functional disability and acute care utilization among the elderly in Taiwan. Archives of Gerontology and Geriatrics. 2013; 57(2):177–83. doi:10.1016/j.archger.2013.04.011PMID:23684243
37. Spillman BC. Changes in elderly disability rates and the implications for health care utilization and cost. The Milbank Quarterly. 2004; 82(1):157–94. PMID:15016247
38. Cummins RA. The subjective well-being of people caring for a family member with a severe disability at home: a review. Journal of Intellectual & Developmental Disability. 2001; 26(1):83–100.
39. Arksey H, Glendinning C. Combining Work and Care: Carers’Decision‐making in the Context of Com-peting Policy Pressures. Social Policy & Administration. 2008; 42(1):1–18.
40. Pan C-W, Wong TY, Lavanya R, Wu R-Y, Zheng Y-F, Lin X-Y, et al. Prevalence and Risk Factors for Refractive Errors in Indians: The Singapore Indian Eye Study (SINDI). Investigative Ophthalmology & Visual Science. 2011; 52(6):3166–73.
41. Lavanya R, Jeganathan SE, Zheng Y, Raju P, Cheung N, Tai ES, et al. Methodology of the Singapore Indian Chinese Cohort (SICC) Eye Study: Quantifying ethnic variations in the epidemiology of eye dis-eases in Asians. Ophthalmic Epidemiology. 2009; 16(6):325–36. doi:10.3109/09286580903144738 PMID:19995197
42. Winkleby MA, Jatulis DE, Frank E, Fortmann SP. Socioeconomic status and health: how education, in-come, and occupation contribute to risk factors for cardiovascular disease. Am J Public Health. 1992 Jun; 82(6):816–20. PMID:1585961
43. Samir K, Lentzner H. The effect of education on adult mortality and disability: a global perspective. Vi-enna Yearbook of Population Research. 2010; 8:201–35.
44. Freedman VA, Martin LG, Schoeni RF. Recent trends in disability and functioning among older adults in the united states: A systematic review. JAMA. 2002; 288(24):3137–46. PMID:12495394
45. Freedman VA, Martin LG. The role of education in explaining and forecasting trends in functional limita-tions among older Americans. Demography. 1999 Nov; 36(4):461–73. PMID:10604075
46. Sulander T, Martelin T, Sainio P, Rahkonen O, Nissinen A, Uutela A. Trends and educational disparities in functional capacity among people aged 65–84 years. International Journal of Epidemiology. 2006 October 1, 2006; 35(5):1255–61. PMID:16931522
47. Yong V, Saito Y. Are there education differentials in disability and mortality transitions and active life ex-pectancy among Japanese older adults? Findings from a 10-year prospective cohort study. The jour-nals of gerontology Series B, Psychological sciences and social sciences. 2012 May; 67(3):343–53. doi:10.1093/geronb/gbs029PMID:22421807
48. Melzer D, Izmirlian G, Leveille SG, Guralnik JM. Educational differences in the prevalence of mobility disability in old age: the dynamics of incidence, mortality, and recovery. The journals of gerontology Se-ries B, Psychological sciences and social sciences. 2001 Sep; 56(5):S294–301. PMID:11522811
50. Zimmer Z, House JS. Education, income, and functional limitation transitions among American adults: contrasting onset and progression. International journal of epidemiology. 2003; 32(6):1089–97. PMID: 14681281
51. Taylor MG. Capturing Transitions and Trajectories: The Role of Socioeconomic Status in Later Life Dis-ability. Journals of Gerontology Series B: Psychological Sciences and Social Sciences. 2010; 65B (6):733–43.
52. Jagger C, Matthews R, Melzer D, Matthews F, Brayne C, CFAS M. Educational differences in the dy-namics of disability incidence, recovery and mortality: Findings from the MRC Cognitive Function and Ageing Study (MRC CFAS). International Journal of Epidemiology. 2007 April 1, 2007; 36(2):358–65. PMID:17255347
53. Zimmer Z, Liu X, Hermalin A, Chuang Y-L. Educational attainment and transitions in functional status among older Taiwanese. Demography. 1998 1998/08/01; 35(3):361–75. PMID:9749327
54. Hidajat M, Hayward M, Saito Y. Indonesia’s social capacity for population health: the educational gap in active life expectancy. Popul Res Policy Rev. 2007 2007/04/01; 26(2):219–34.
55. Kaneda T, Zimmer Z. Education, Gender, and Functional Transitions Among Indonesian Elderly. J Cross Cult Gerontol. 2007 2007/09/01; 22(3):303–22. PMID:17629720
56. Kunkel SR, Applebaum RA. Estimating the Prevalence of Long-Term Disability for an Aging Society. Journal of Gerontology. 1992 September 1, 1992; 47(5):S253–S60. PMID:1387411
57. Rickayzen BD, Walsh DEP. A Multi-State Model of Disability for the United Kingdom: Implications for Future Need for Long-Term Care for the Elderly. British Actuarial Journal. 2002; 8(02):341–93.
58. Giles LC, Cameron ID, Crotty M. Disability in older Australians: projections for 2006–2031. The Medical Journal of Australia. 2003; 179:130–3. PMID:12885280
59. Nuttall SR, Blackwood RJL, Bussell BMH, Cliff JP, Cornall MJ, Cowley A, et al. Financing Long-term Care in Great Britain. Journal of the Institute of Actuaries (1886–1994). 1994; 121(1):1–68.
60. Wittenberg R, Pickard L, Comas-Herrera A, Davies B, Darton R. Demand for long-term care: projec-tions of long-term care finance for elderly people. 1998.
61. Malhotra R, Chan A, Malhotra C,Østbye T. Prevalence, awareness, treatment and control of hyperten-sion in the elderly population of Singapore. Hypertenhyperten-sion Research. 2010; 33(12):1223–31. doi:10. 1038/hr.2010.177PMID:20882026
62. Department of Statistics Singapore. Statistics. Latest Data. [online] Available at:<http://www.singstat. gov.sg/statistics/latest_data.html#13>[Accessed 16 September 2013].
63. Thompson JP, Riley CM, Eberlein R. Modelling for Insight: The Case of Dementia in Singapore. Sys-tems Research & Behavioral Science. 2013; 31(2):227–35.
64. Ministry of Education Singapore. Our Education System. [cited 2015]; Available from:http://www.moe. gov.sg/education/.
65. Lutz W, Butz WP, KC S. World Population and Human Capital in the Twenty-First Century: OUP Ox-ford; 2014.
66. R Development Core Team. R: A language and environment for statistical computing. 3.0.2 ed. Vi-enna, Austrai: R Foundation for Statistical Computing; 2013.
67. Paganini-Hill A. Aging in Place in a Retirement Community: 90+ Year Olds. Journal of Housing For the Elderly. 2013 2013/01/01; 27(1–2):191–205. PMID:23729951
68. Anderson WL, Wiener JM, Finkelstein EA, Armour BS. Estimates of National Health Care Expenditures Associated With Disability. Journal of Disability Policy Studies. 2011; 21(4):230–40.
69. Fried TR, Bradley EH, Williams CS, Tinetti ME. Functional disability and health care expenditures for older persons. Archives of Internal Medicine. 2001; 161(21):2602–7. PMID:11718592
70. Bharmal MF, Dedhiya S, Craig BA, Weiner M, Rosenman M, Sands LP, et al. Incremental dementia-re-lated expenditures in a medicaid population. The American Journal of Geriatric Psychiatry: Official Journal of the American Association for Geriatric Psychiatry. 2012; 20(1):73–83. doi:10.1097/JGP. 0b013e318209dce4PMID:22183012
71. González-González C, Sánchez-García S, Juárez-Cedillo T, Rosas-Carrasco O, Gutiérrez-Robledo LM, García-Peña C. Health care utilization in the elderly Mexican population: expenditures and determi-nants. BMC public health. 2011; 11(1):192–.
72. Bolin K, Lindgren B, Lundborg P. Your next of kin or your own career?: Caring and working among the 50+ of Europe. Journal of health economics. 2008; 27(3):718–38. doi:10.1016/j.jhealeco.2007.10.004 PMID:18207265
74. Pinquart M, Sörensen S. Differences between caregivers and noncaregivers in psychological health and physical health: a meta-analysis. Psychology and aging. 2003; 18(2):250–67. PMID:12825775
75. Morrow-Howell N, Ozawa MN. Helping network: seniors to seniors. The Gerontologist. 1987; 27(1):17– 20. PMID:3557141
76. NPTD, Singstat, MHA, ICA. Population in Brief 2013. 2013.
77. Lim YH. Raise retirement age to 70: Lim Boon Heng. MyPaper. 2014 17 January 2014.
78. Lim VKG. An empirical study of older workers’attitudes towards the retirement experience. Employee Relations. 2003; 25(4):330–46.