www.nat-hazards-earth-syst-sci.net/11/549/2011/ doi:10.5194/nhess-11-549-2011
© Author(s) 2011. CC Attribution 3.0 License.
and Earth
System Sciences
First level seismic microzonation map of Chennai city –
a GIS approach
G. P. Ganapathy
Centre for Disaster Mitigation and Management, VIT University, Vellore 632 014, Tamil Nadu, India
Received: 21 October 2009 – Revised: 30 July 2010 – Accepted: 15 September 2010 – Published: 21 February 2011
Abstract. Chennai city is the fourth largest metropolis in India, is the focus of economic, social and cultural develop-ment and it is the capital of the State of Tamil Nadu. The city has a multi-dimensional growth in development of its infrastructures and population. The area of Chennai has ex-perienced moderate earthquakes in the historical past. Also the Bureau of Indian Standard upgraded the seismic status of Chennai from Low Seismic Hazard (Zone II) to Moder-ate Seismic Hazard (Zone III)–(BIS: 1893 (2001)). In this connection, a first level seismic microzonation map of Chen-nai city has been produced with a GIS platform using the themes, viz, Peak Ground Acceleration (PGA), Shear wave velocity at 3 m, Geology, Ground water fluctuation and bed rock depth. The near potential seismic sources were identi-fied from the remote-sensing study and seismo-tectonic de-tails from published literatures. The peak ground accelera-tion for these seismic sources were estimated based on the attenuation relationship and the maximum PGA for Chen-nai is 0.176 g. The groundwater fluctuation of the city varies from 0–4 m below ground level. The depth to bedrock con-figuration shows trough and ridges in the bedrock topogra-phy all over the city. The seismic microzonation analysis involved grid datasets (the discrete datasets from different themes were converted to grids) to compute the final seis-mic hazard grid through integration and weightage analysis of the source themes. The Chennai city has been classified into three broad zones, viz, High, Moderate and Low Seis-mic Hazard. The High seisSeis-mic Hazard concentrated in a few places in the western central part of the city. The moderate hazard areas are oriented in NW-SE direction in the Western part. The southern and eastern part will have low seismic hazard. The result of the study may be used as first-hand
Correspondence to: G. P. Ganapathy ([email protected])
information in selecting the appropriate earthquake resistant features in designing the forthcoming new buildings against seismic ground motion of the city.
1 Introduction
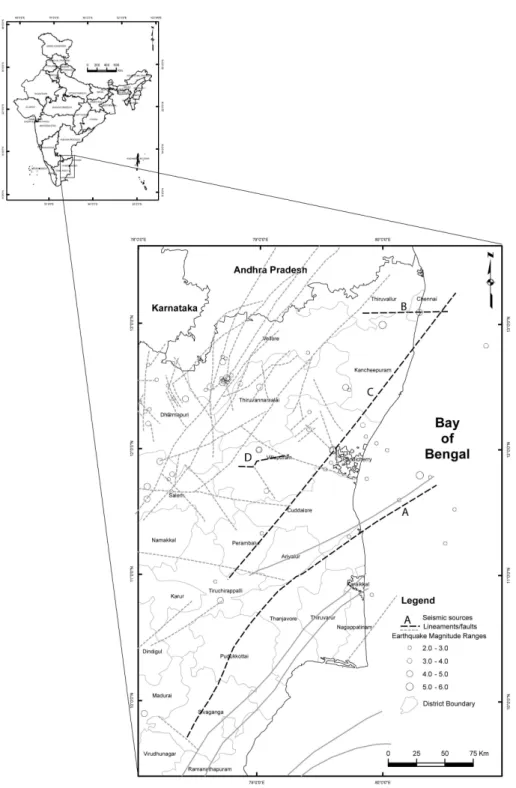
Earthquake hazard zonation for urban areas, mostly referred as seismic microzonation, is the first and most important step towards a seismic risk analysis and mitigation strategy in densely populated regions (Slob et al., 2002). As it has been observed from many earthquake scenarios, the major damage to buildings and man-made structures is mostly found in the area of soft sediments (Parvez, 2003). As a result, even rela-tively minor events can be the source of huge socio-economic disasters. The earthquake of 12 October 1992 with a magni-tude of 5.4 in Egypt, where the buildings were not earthquake resistant, resulted in 554 deaths, 20 000 people injured with a reported loss of one million US$ (El-Sayed et al., 2001). It is to be recalled that the present study area (Fig. 1) Chennai city has experienced three earthquakes of magnitudes greater than or equal to 5.0 in 1807, 1816 and 1823. Also the popu-lation of the city was 4.343 million in 2001 and projected to 5.343 million in 2011 Census of India (Census, 20011).
Chennai displays various building types of wall mate-rials and their percentage, viz, the earthen walls (9.59%) (mud, unbrick, brick), stone walls (3.1%), burned brick walls (80.79%), concrete walls (Nil), wood and Ekra walls (0.23%), GI and other metal sheets (0.21%), bamboo thatch, leaves, etc., (6.1%) (Gupta, 2000). The earthen and stone houses account for 12.59% and other brittle burned brick are 80.79%, i.e., a total of 93.38% are vulnerable if shaken by an earthquake of moderate to severe intensity.
Fig. 1. Seismicity and seismic sources for Chennai city.
A number of water bodies (lakes and ponds), which ex-isted in Chennai in the early period of this century, have been filled up with garbage and transport sand and clay (CGWB Report, 1993). The sand dunes and beach ridges in the coastal belt of Chennai have also been converted into residen-tial areas and as a result, the true landform has been altered. The marshy land existing north of Adyar river has been trans-formed into a residential area. Buildings constructed in these areas would be highly vulnerable to earthquakes. The water
2 Data used
The geological, ground motion, seismotectonic features and ground water conditions are the input to assess the seismic hazard for Chennai. The involved baseline data are discussed in the following headings.
2.1 Peak Ground Acceleration (PGA)
A seismicity study is of great importance to understand the dynamic behaviour of the earth and is useful to determine the earthquake hazard in a specific region. In order to understand the seismicity of Chennai and its vicinity, data regarding spa-tial locations of earthquakes and their magnitudes have been collected for a period of around 200 years (1807–2006) from various sources and have been used for the present study. For the historical earthquakes general locations are used for which “generalized” epicentral co-ordinates are avail-able. The total number of earthquakes identified from these sources for the present study is 103. Out of the total 103 earthquakes/earth tremors 48, 23, 21, 10 and 1 incidences have been in the magnitude range of 2.0–2.9, 3.0–3.9, 4.0– 4.9, 5.0–5.9 and≥6.0, respectively. 52 earthquakes (51% of overall) are ofM≥3 in the past 200 years of seismic history (Ganapathy, 2005).
Analysis of tectonic lineaments and faults helps in under-standing the regional seismotectonic activity of the area. For the present study, seismotectonic details are collected from the report published by Central Ground Water Board, Chen-nai. The NE-SW trending Archaean boundary fault is lo-cated in Chennai and separates two basins. The southern one is shallow without Gondwana sediments. The northern basin has extensive Gondwana sediments beneath the allu-vium. The presence of bedding joints, shears and micro-folding in core samples are indicative of the extensive tec-tonic disturbance in the post-Gondwana period. The Adyar fault is shown in Fig. 1 and this weak zone is followed by the flow of the Adyar river.
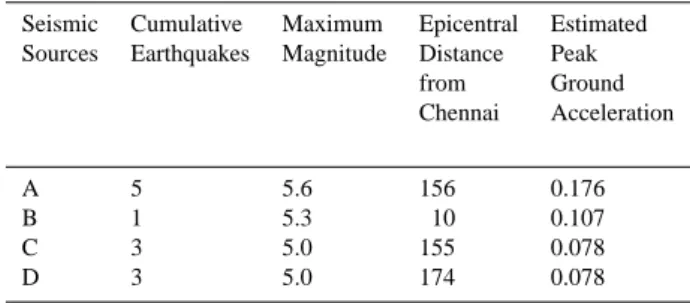
The potential seismic sources delineated based on the geo-physical and geological characteristics of the seismic sources along with the prevailing fault systems in the region. The as-sociation of the cumulative number of epicentres of earth-quakes or higher magnitude earthearth-quakes on the respective active lineaments/faults has also been considered. Based on the seismicity and seismogenic systems, 4 sources have been delineated as potential sources for Chennai city and its vicin-ity of a 200 km radius. These seismic potential sources are named based on its spatial locations. These sources gener-ated earthquakes in the range of 3.2 to 5.3 in the past earth-quake history of 200 years. In the present study, the largest well recorded earthquakes which occurred in the instrumen-tal time period are taken into consideration. The estimation of ground motion in terms of PGA at bedrock level can be de-termined using attenuation relationships. A variation of this approach uses the reference and site recordings as for their
Table 1. Estimated Peak Ground Acceleration (PGA) values Chen-nai city by the closest potential seismic sources.
Seismic Cumulative Maximum Epicentral Estimated
Sources Earthquakes Magnitude Distance Peak
from Ground
Chennai Acceleration
A 5 5.6 156 0.176
B 1 5.3 10 0.107
C 3 5.0 155 0.078
D 3 5.0 174 0.078
different site-source distances. This was done using ratios of hypocentral distance by Borcherdt and Glassmoyer (1994). Distance corrections incorporating frequency-dependent at-tenuation have been implemented by Borcherdt (2001).
For the regions where strong motion data are not available for such analysis, the attenuation relationships developed for other regions can be used based on the resemblance of the seismotectonic characteristics of both the regions. Abraham-son and Litehiser (1989) have proposed an attenuation model for Peak Ground Acceleration (PGA) based on 585 strong ground motion records from 76 worldwide earthquakes. A suitable attenuation relationship developed by Iyengar and Raghukanth (2004) for Peninsular India applicable to Chen-nai is used for the present study. The attenuation relation used to calculate PGA is given below:
lny=c1+c2(M−6)+c3(M−6)2−lnR−c4R+lnЄ (1) Wherey refers to PGA in g,M refer to magnitude andR refer to hypocentral distance. Since PGA is known to be at-tributed nearly as a lognormal random variable lny would normally distributed with the average of (lnЄ) being almost zero. Hence, withe=I, coefficients for the southern region are (Iyengar and Raghukanth, 2004):
c1=1.7816;c2=0.9205;c3= −0.0673;c4=0.0035;
(lnЄ)=0.3136 (taken as zero)
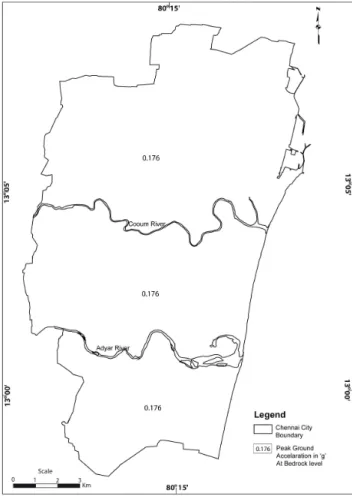
The determined PGA for the four identified potential seis-mic sources for the city of Chennai is in the range of 0.176 g to 0.078 (Table 1). The maximum PGA of 0.176 would be caused by the east-west trending in the southern part of Chen-nai (Fig. 2). This fault has been associated with 4 earthquake incidences in the past 200-year earthquake history and the maximum magnitude (Mmax) so far generated is 5.3.
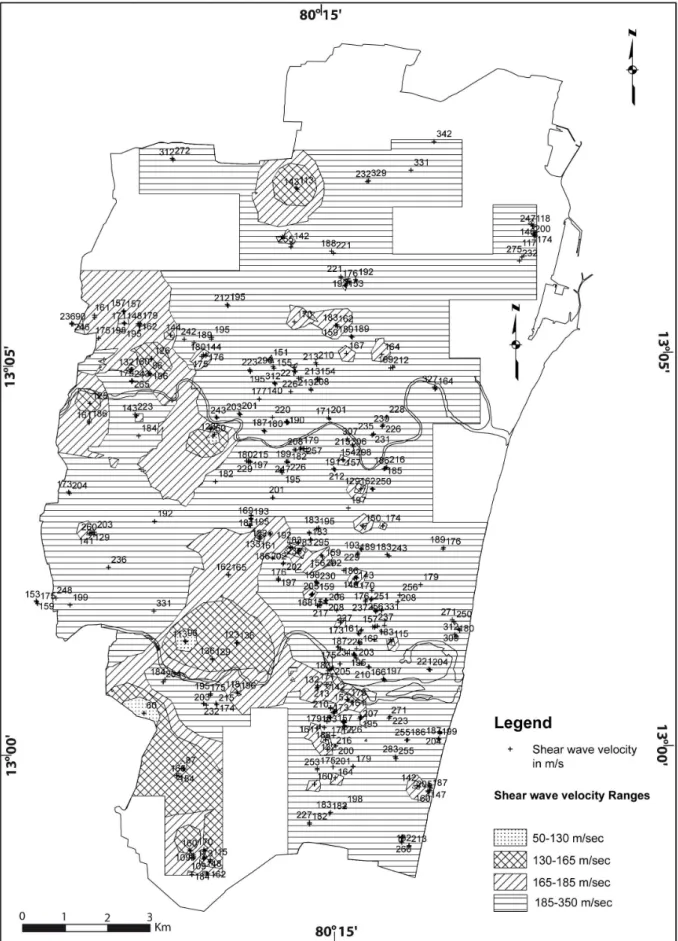
2.2 Shear wave velocity from geotechnical data
Fig. 2. Estimated peak ground acceleration for Chennai city.
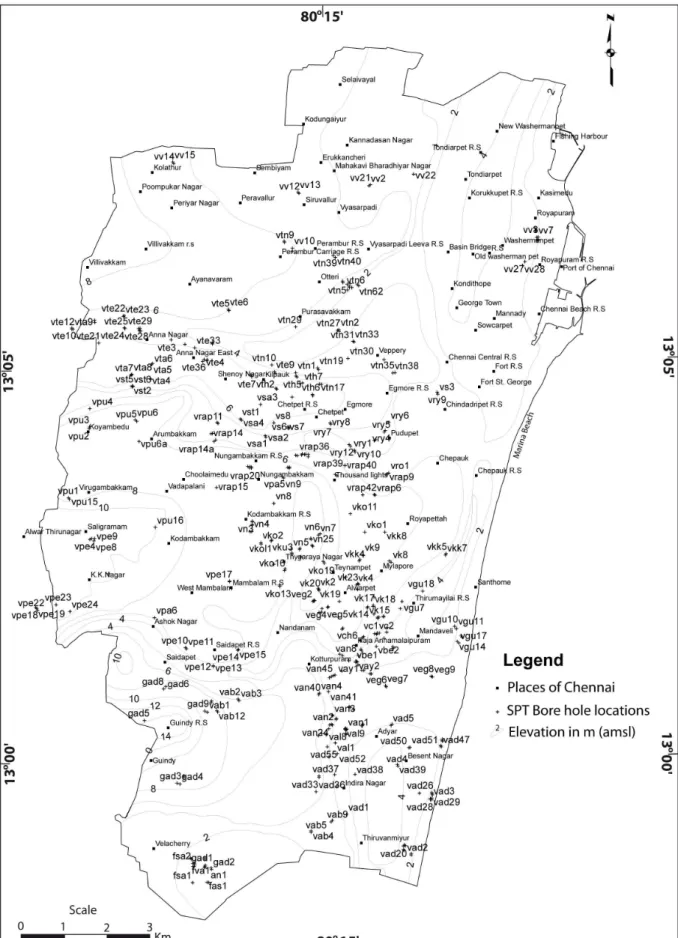
including SPT-N values, and various characteristics of soils in depths. The borehole locations are given in Fig. 3. The depth of the boreholes is in the range of 2.0 to 32 m. Only 43 boreholes are penetrated down to basement. The “N” val-ues observed in the field, using the standard penetration test equipment, and the standard test procedure were corrected for (a) overburden stress, (b) hammer energy, (c) borehole diameter, (d) rod length, and (e) presence or absence of liner. Based upon the distribution of “N” values in different depths, the average SPT-N value contour maps were pre-pared for a 3 m depth. The relative density of sand and clay is categorized based on the SPT-N values (Terzaghi and Peck, 1967) details are related with shear wave velocity and it is given in Table 2.
The shear wave velocity is an important parameter to as-sess the strength of the soil. Soil profiles are characterised by shear wave velocity because it is a key indicator of soil susceptibility. Shear wave velocity can be estimated from correlations with the Standard Penetration Test (SPT), water content and soil type. Researchers developing empirical at-tenuation relations have attempted to use site classification based on average shear wave velocity to account for the dif-ferences in site response (Boore and Joyner, 1982). The
re-Table 2. “N” valueVSshear wave velocity.
“N” Value “N” Value Shear Relative Relative Wave Density Density Velocity of Sand of Clay
<4 <2 <50
4–10 2–8 50–130
10–30 8–15 130–165
30–50 15–30 165–185
>50 >30 185–350
sult of average shear wave velocity have been obtained for Chennai for the depth of 0–3 m by using the empirical rela-tionships proposed by Imai and Yoshimura (1970) – Eq. (2), Ohba and Goto (1978) – Eq. (2).
VS=76N0.33 (2)
VS=84N0.31 (3)
Where VS= average shear wave velocity in m s−1 and
N= average SPT “N” value. The contours of average shear wave velocity at a 3 m depth is prepared by using Arc-GIS – Spatial Analyst software by Interpolating Raster by Inverse distance weighted method and presented in Fig. 4.
2.3 Geology
The Archaean crystalline rocks, Gondwana and Tertiary sed-iments and Recent alluvium are the three group of geolog-ical formations found in Chennai. Most of the geologgeolog-ical formations are concealed since they are overlain by the allu-vial materials except for a few exposures of crystalline rocks of charnockites (Fig. 5) in the southwestern part of Chennai (CGWB Report, 1993).
The Archaean crystalline rocks of the city comprise chiefly of charnockites, gneisses and the associated basic and ultra-basic intrusives. The charnockites represent the major rock type in the area of Saidapet. The crystalline rocks are weath-ered and jointed/fractured. The degree and depth of weather-ing varies from place to place and the thickness of the weath-ered mantle varies from less than 1 m to about 12 m in the city.
The Gondwana shale is exposed in Adyar river near Ramavaram (southern part of Chennai). The Gondwana-Archaean contact is a fault concealed by alluvium. The Gondwana shale is black to dark grey in colour and highly jointed/fractured. The shale is encountered in a number of boreholes and its thickness varies from 24 m in Kilpauk, area through 20 m in Ashok Nagar area to more than 139 m in Koyambedu area.
Fig. 6. Map showing the depth to basement of rock at Chennai city.
However, the sandstones encountered in some of the bore-holes below alluvium in Perambur, Alwarpet, Anna Nagar and Royapuram areas are different from the compact dark coloured shale of Gondwana Group and they may belong to the Tertiary. Probably Tertiary rocks are deposited on the eroded Gondwana System and are overlain by river al-luvium.
The alluvium covers the major part of Chennai. It consists of sand, silts and clays. The thickness of alluvium varies from place to place and a maximum of 28 m is encountered in drilled boreholes of north Chennai near Perambur. 2.4 Depth to bedrock
Borehole data are the only reliable data to estimate the depth to bedrock, which is an important key parameter in assessing the soil column thickness over it. The bedrock configura-tion of a site will give an idea about the basement topogra-phy. The basement topography will help in the study of fre-quencies and amplitudes of ground motions. This will help to identify high (as well as low) seismic risk areas from the point-of-view of wave propagation influence.
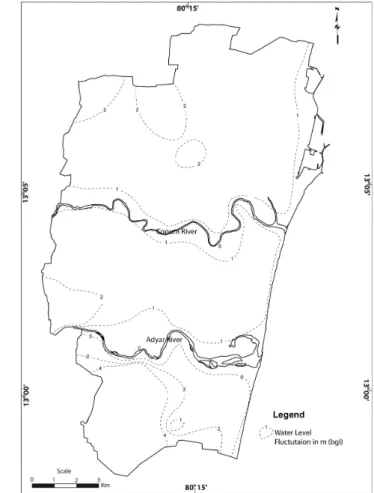
Fig. 7. Map showing the water level fluctuation at Chennai city.
The basement is somewhat shallow in the southern side of crystalline basement near Saidapet and Guindy Park (0– 5 m). The basement is relatively high in the northern part of the city (20–40 m). The western Central part of the city had a very high basement depth of 40–80 m. The generalised base-ment contour map needs to be refined with the forthcoming of more and more data. The sub-surface geology and base-ment configuration is presented in Fig. 6.
2.5 Depth to water table and water level fluctuation
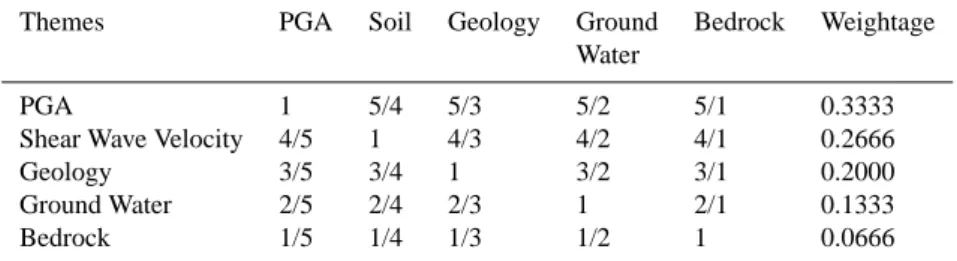
Table 3. Assigned weights for the thematic maps for GIS integration.
Themes PGA Soil Geology Ground Bedrock Weightage
Water
PGA 1 5/4 5/3 5/2 5/1 0.3333
Shear Wave Velocity 4/5 1 4/3 4/2 4/1 0.2666
Geology 3/5 3/4 1 3/2 3/1 0.2000
Ground Water 2/5 2/4 2/3 1 2/1 0.1333
Bedrock 1/5 1/4 1/3 1/2 1 0.0666
Table 4. Normalised ratings of the thematic layers.
Themes Weightage Normalised Values
4 3 2 1
PGA (in g) 0.3333 – 0.176 – –
Shear Wave Velocity (m s−1) 0.2666 50–130 130–165 165–185 185–350
Geology 0.2000 – Alluvium Beach Sand Rock
Ground Water Fluctuation (m) 0.1333 0–2 2–4 – –
Bedrock (m) 0.0666 >40 20–40 10–20 0–5
3 Approach
There are a variety of subjective decision rules and the most commonly used one being the analytic hierarchy pro-cess (AHP) of Saaty (1980) and weighted linear combina-tion (WLC) (Barredo et al., 2000; Ayalew and Yamagishi, 2004; Ayalew et al., 2004). The analysis has been carried out following Saaty’s Analytical Hierarchy Process (AHP). Analytic Hierarchy Process (AHP) is one of a Multi-Criteria decision making method that was originally developed by Thomas L. Saaty. In short, it is a method to derive ratio scales from paired comparisons. It uses hierarchical structures to quantify relative priorities for a given set of elements on a ra-tio scale, which is based on the discernment of the user. From the judgments between two particular elements, a pair wise comparison matrix is constructed on a scale of 1–5, 1 indicat-ing that the two elements are equally important, and 5 imply-ing that one element is more important than the other. If an element is less significant than the other then it is indicated by reciprocals of 1–5 values (i.e., 1/1 to 1/5). The pair wise comparison matrix prepared is used to derive the individual normalized weights of each element. The weights of each criterion are calculated by averaging the values of each row of the matrix. The Consistency Ratio, which is a comparison between Consistency Index and Random Consistency Index, obtained using AHP method is 8.3%. These weights also add up to 1 and can be used in deriving the weighted sums of rating for each region of polygons of the mapped layers. This approach has also been successfully used by Mohanty et al. (2007) for the similar type of microzonation studies.
The features of each thematic map are also normalized be-tween 0 and 1 (Nath, 2004) to ensure that no layer exerts an influence beyond its determined weight. The weightage fac-tor of each layer calculated is based on expert choice. For the study, the paired comparison matrix is prepared for the five themes (PGA contour, soil, geology, groundwater fluctuation and bedrock depth) as shown in Table 3. Following the AHP, the thematic maps are assigned weights on a scale of 1–5 de-pending on their contribution to seismic hazard. The higher weight is assigned to the theme that contributes more to the hazard and in this case the highest weight is given to the PGA contour theme. The weights obtained for each theme are: PGA (0.333), Shear wave Velocity (0.266), geology (0.20), groundwater (0.133) and bedrock depth (0.066). The nor-malized ratings for thematic layers are given in Table 4. The feature of each themes normalised between 0 and 1.
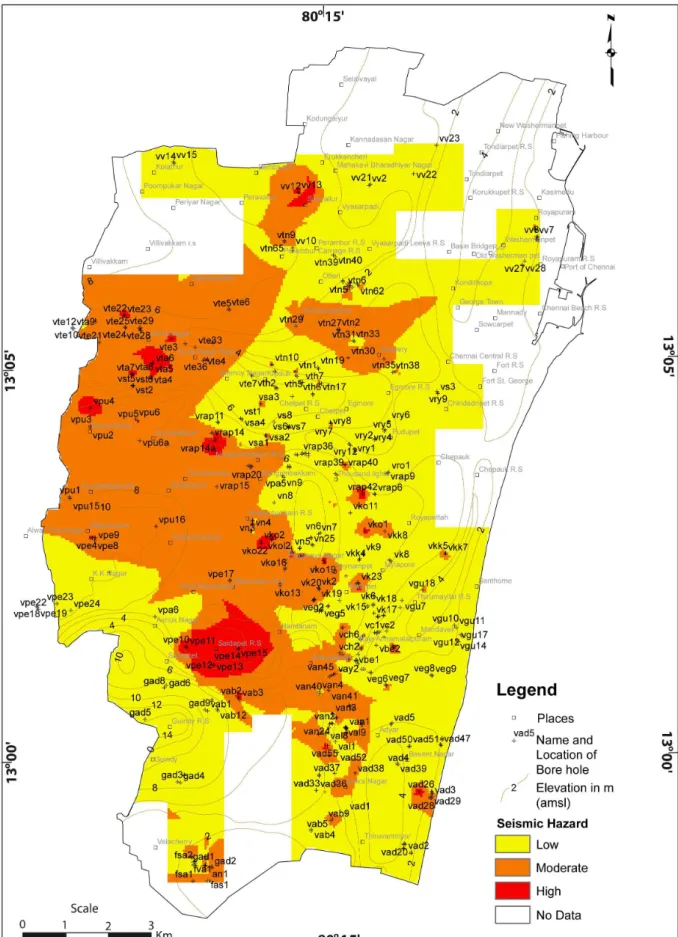
The obtained values are then incorporated in a GIS plat-form for the integration of all the thematic maps to obtain the seismic microzonation map of Chennai city. The integra-tion of five thematic layers is integrated by the UNION and overlay operation in GIS.
4 Discussions and conclusion
in patches around Adyar River and few patches distributed below Cooum River in the south western part of the city. The areas in the southern part of Chennai represent lacustrine de-posits is underlined by marine black clay as evident in Tara-mani areas. The maximum depth to basement is 14 m. The central part of the city has mainly fluvial origin of flood plain deposits as evidence from the flowing Adyar and Cooum rivers. The upstream portion of Adyar and Cooum rivers have a moderate slope and in the down stream, the rivers are very gentle to flat in coastal areas. These areas in the northern part of the city represent black clay and alluvium of marine origin with maximum depth to basement of 30 m and patches of these areas show high hazard. The western and northwest-ern part of Chennai falls under moderate hazard. These areas represent the shale and clay of the Gondwana age and are also correlated with lake fill deposits. The remaining areas are prone to low seismic hazard. It can be concluded that the half of the Chennai city is prone to moderate to high haz-ard. The resultant map provides regional pictures on seismic hazard of Chennai city and is useful information in construc-tion planning of forthcoming buildings in the city. Also it is helpful as a base material to identify seismic risk of Chennai city.
Acknowledgements. The author is grateful to the Central Ground Water Board, Chennai and Geological Survey of India, Chennai for providing the data and necessary information without which this work would not have been possible. I acknowledge all the facilities provided by G. Viswanathan, Chancellor, VIT University, Vellore to carryout second part of the present study. The constant encour-agement by R. K. Bhandari, Former Chairman, and S. K. Sekar, Director, CDMM, VIT University, Vellore and S. Rajarathnam, Professor, Centre for Disaster Mitigation and Management, Anna University, Chennai are gratefully acknowledged.
Edited by: M. E. Contadakis
Reviewed by: R. Carbonell, J. Papoulia, and D. Papanastasiou
References
Abrahamson, N. A. and Litehiser, J. J.: Attenuation of Vertical Peak Acceleration, B. Seismol. Soc. Am., 79, 549–580, 1989. Ayalew, L. and Yamagishi, H.: Slope movements in the Blue Nile
basin, as seen from landscape evolution perspective, Geomor-phology, 57(1–2), 95–116, 2004.
Ayalew, L., Yamagishi, H., and Ugawa, N.: Landslide susceptibil-ity mapping using GIS-based weighted linear combination, the case in Tsugawa area of Agano River, Niigata Prefecture, Japan, Landslides, 1(1), 73–81, 2004.
Barredo, J. I., Benavidesz, A., Herhl, J., and van Westen, C. J.: Comparing heuristic landslide hazard assessment techniques us-ing GIS in the Tirajana basin, Gran Canaria Island, Spain, Int. J. Appl. Earth Obs., 2(1), 9–23, 2000.
BIS: 1893: Indian Standard, Criteria for Earthquake Resistant De-sign of Structures, Bureau of Indian Standards, New Delhi, 2001. Boore, D. M. and Joyner, W. B.: The empirical prediction of ground
motion, B. Seismol. Soc. Am., 72, S43–S60, 1982.
Borcherdt, R. D: Empirical Evidence for Acceleration-Dependent Amplification Factors, B. Seismol. Soc. Am., 92, 761–782, 2001. Borcherdt, R. D. and Glassmoyer, G.: Influences of Local Geol-ogy on Strong and Weak Ground Motions Recorded in the San Francisco Bay Region and their Implications for Site-Specific Building-Code Provisions, The Loma Prieta, California Earth-quake of October 17, 1989 – Strong Ground Motion, US Geol. Surv. Prof. Paper, 1551-A, A77–A108, 1994.
CGWB Report: Groundwater Resources and Development Prospects in Madras District, Tamil Nadu, Central Ground Water Board, Southern Region, Hyderabad, 1993.
El-Sayed, A., Vaccari, F., and Panz, G. F.: Deterministic seismic hazard in Egypt, Geophys. J. Int., 144, 555–567, 2001.
Ganapathy, G. P.: Seismic Hazard Assessment for Tamil Nadu State and A Specific Study on Local Ground Motion Response for Part of Chennai City, Anna University, Ph.D. thesis, unpublished, 2005.
Gupta, T. N.: Guidelines – Improving Earthquake Resistance of Housing, published by: Building Materials and Technology Pro-motion Council, New Delhi, 2000.
Imai, T. and Yoshimura, Y.: Elastic Wave Velocity and Soil Proper-ties in Soft Soil Tsuchi-to-Kiso, 18(1), 17–22, 1970.
Iyengar, R. N. and Ragukanth, S. T. G.: Attenuation strong ground Motion in Peninsular India, Seismol. Res. Lett., 75(4), 530–540, 2004.
Mohanty, W. K., Walling, M. Y., Nath, S. K., and Pal, I.: First Order Seismic Microzonation of Delhi, India Using Geographic Information System (GIS), Nat. Hazards, 40, 245–260, 2007. Nath, S. K.: Seismic Hazard Mapping in Sikkim Himalaya through
GIS Integration of Site Effects and Strong Ground Motion At-tributes, Nat. Hazards, 31(2), 319–342, 2004.
Ohba, Y. and Goto, N.: Empirical shear wave velocity equations in terms of characteristics soil indexes, Earthq. Eng. Struct. D., 6, 167–187, 1978.
Parvez, I. A.: Seismic Microzonation: Methodology and Approach, CSIR Centre for Mathematical Modelling and computer Simula-tion, Bangalore, Research Report, 14 pp., 2003.
Saaty, T. L.: The Analytical Hierarchy Process, McGraw Hill, New York, 350 pp., 1980.
Slob, S., Hack, R., Scarpas, T., van Bemmelen, B., Duque, A.: A Methodology for Seismic Microzonation Using GIS and Shake, A Case Study from Armenia, Colombia, Engineering Geology for Developing Countries – Proceedings of 9th Congress of the International Association for Engineering Geology and Environ-ment Durban, South Africa, 16–20 September 2002, edited by: van Rooy, J. L. and Jermy, C. A., 2843–2852, 2002.