No 613 ISSN 0104-8910
On the Economic and Fiscal Effects of
Infrastructure Investment in Brazil
Os artigos publicados são de inteira responsabilidade de seus autores. As opiniões
neles emitidas não exprimem, necessariamente, o ponto de vista da Fundação
On the Economic and Fiscal E¤ects of
Infrastructure Investment in Brazil
Pedro Cavalcanti Ferreira
Graduate School of Economics - EPGE Fundação Getulio Vargas
Carlos Hamilton Vasconcelos Araújo Fundação Getulio Vargas
Abstract
This article studies the productive impact of infrastructure invest-ment in Brazil. Public-capital expenditures in the country have de-creased continuously over the last two decades, and this paper shows the signi…cant impact this has had on infrastructure stocks. Cointe-gration analysis is used to investigate the long-run association between output and infrastructure, the results being then used to study the short-run dynamic of these variables. Whether in the short or long run, the productive impact of infrastructure was found to be relevant. Other group of simulations studies the impact of expanding capital expenditures through debt …nance on debt to GDP ratio as well as on public cash ‡ow and net worth.
1
Introduction
Public investment in Brazil, as a share of gross domestic product (GDP), has been falling for the last twenty …ve years. While in the 1969-1984 period, gross capital formation of the central government alone averaged 4.03%, in the following sixteen years it was only 1.85%. In the last few years it has remained at around 0.9% of the GDP, while the gross investment of total government is only 2.2% of output. Moreover, although timing vary, the cuts in infrastructure expenditure a¤ected virtually all sectors. For instance, direct investment in roads from 1990 to 1995 was only, in real terms, one …fth of those made in the 1970-1975 period (Ferreira and Maliagros (1998)), while total public investment in the transportation sector today is less than 0.1% of GDP, an insigni…cant …gure when compared to almost 1.8% in the peak year of 1979. Similar …gures, if somewhat less dramatic, apply to the energy sector, ports, etc.
As a consequence, there is a general decrease in the quality of infrastruc-ture services and a relative scarcity of quantities supplied. With respect to the former, although not many numbers are available, casual evidence is abundant. The blackouts and rationing of energy two years ago are believed to have been caused by the reduction in investment in the energy sector. Generating capacity, which grew at an average rate of 10% from 1960 to 1980, increased on average only 3% per year in the following twenty years. World Bank …gures show that the total length of paved roads in the coun-try has stagnated, if not decreased, during the last decade. At the same time, Velloso (2004) shows that in 2003 only 17% of roads in the country were considered in good or very good condition, while 42% were in poor or extremely poor condition.
The reduction of capital expenditures is a general phenomenon in Latin America (Calderon, Easterly and Serven (2002)) and is associated with the numerous economic crises the region experienced since Mexico’s default in 1982. These were particularly acute in Brazil, as re‡ected, for instance, by hyperin‡ation, …scal crisis, the suspension of external debt payments, insolvent state and local governments, increasing poverty, etc. As stated by many (e.g., Roubini and Sachs(1989), Calderon, Easterly and Serven (2002) and Mintz and Smart(2004)), in times of …scal restrictions, public investments tend to be overly reduced and the burden of …scal adjustment is felt …rst and with more intensity in infrastructure sectors.
little incentive to consider the future gains of infrastructure expenditures. This is so because, while most of the expenses are incurred under their own term, most of the bene…ts will be enjoyed after they leave o¢ce. Even if the net present value of the project is positive, its initial cash ‡ow is always negative and this is critical for any political decision. In an environment with high political instability such as Latin America, this problem tends to be ampli…ed.
In the Brazilian case, aside from …scal problems and widespread economic crisis, public budget has become increasingly rigid in the recent past, with mandatory expenditures in education and health, for instance, and mounting expenses in payroll, social security, various social programs and interest1. Moreover, current agreement with the IMF assumes …scal targets - a 4.25% primary surplus in the current year - which, as usual, make no di¤erentiation between current and capital expenditures. When adding up these factors, one should not be surprised by the reduction of public investment in general, and infrastructure-capital expenditures in particular, observed in Brazil.
This article analyzes the economic impact of the recent evolution of infrastructure investment in this country. It is divided in six sections in addition to this introduction. The next two sections present the relevant stylized facts and estimate the relationship between investment ‡ows and the variation of infrastructure stocks. As far as we know, this is the …rst time that this has been done in Brazil, since people generally assume a one-to-one relationship between investment and capital growth.
The fourth section estimates the growth impact of public capital and of di¤erent measures of infrastructure stock. This was found to be relevant by a large number of studies ((e.g. Aschauer (1989), Ai and Cassou (1995), Canning and Bennathan (2002), and Easterly and Rebelo (1993)) that used di¤erent types of data and econometric methodology. We initially employ cointegration analysis to investigate the long-run association between out-put and infrastructure, extending in many directions the analysis presented in Ferreira and Maliagros (1998). These results are then used to study the short-run dynamic of GDP and per capita GDP after shocks to public capital and infrastructure. Both in the short or long run, the productive impact of the di¤erent measures of infrastructure were found to be relevant although not too large. Section Six presents a very simple simulation of tax collection, debt service and public solvency after an increase in public capital stock entirely …nanced by debt issue. Finally, Section Seven presents
1See Afonso (2004) for a detailed exposition of the recent evolution of the Brazilian
some concluding remarks.
2
Some Basic Stylized Facts
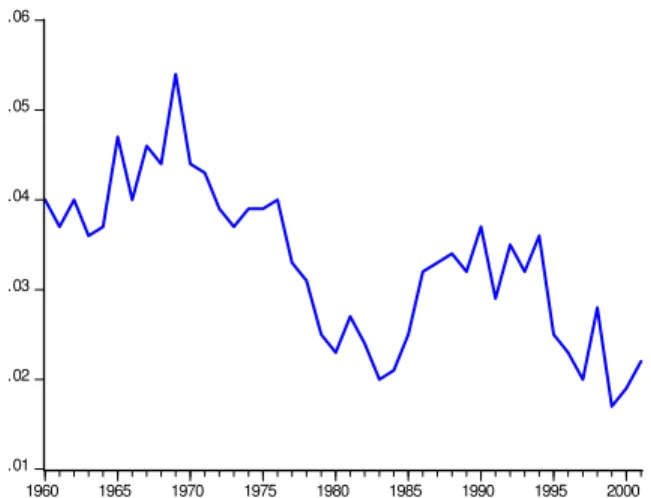
After reaching a peak of 5.3% of GDP in 1969, public investment today is only 2.2% of GDP. It experienced a timid recovery from 1987 to 1994, with an average ratio around 3%, but from that date on, …gures have remained quite small. Out of the total investment today, a large fraction is due to mu-nicipalities (40%), which means parks, schools, street pavement, sidewalks and similar expenditures with little productive impact.
.01 .02 .03 .04 .05 .06
1960 1965 1970 1975 1980 1985 1990 1995 2000
Figure 1.1 Public Investiment do GDP Ratio
low-cost option to reduce public expenditure, or at least to compensate for increases in other dimensions2.
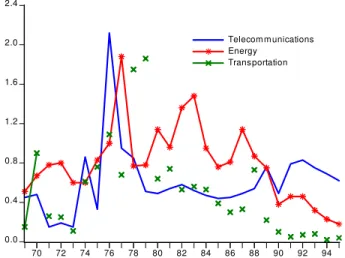
The …gure below shows gross investment as percentage of GDP by in-frastructure sectors. As it is apparent, the drop in inin-frastructure expenditure in Brazil is a general phenomenon, and in almost all cases started at least twenty years ago, when the …rst …scal crisis (e.g., 1982 after Mexico‘s de-fault) exploded. Given that almost all telecommunication businesses were privatized before 1999, the recent fall in (public) investment in this sector comes as no surprise. As for investments in energy, they reached a peak in 1976 and remained relatively high until the early-mid eighties. After this date there is a pronounced downward trend that has continued until today. The fall in transportation investment is even more pronounced. In particu-lar, it was only 0.05% of GDP in 1997. Although numbers in Velloso (2003) were never that small, in any case he does show that in 2003 the investments of the Ministry of Transportation were only 0.09% of GDP.
0.0 0.4 0.8 1.2 1.6 2.0 2.4
70 72 74 76 78 80 82 84 86 88 90 92 94 Telecom m unications Energy
Transportation
Figure 1.2 Public Investiment as Proportion of GDP
For our objectives here, it is more relevant to better understand the relationship between infrastructure investment and variations in infrastruc-ture stocks. In other words, there are good theoretical reasons (see Prichett
2Note that only a small part of the reduction in investment by the central government
(2000)), and anecdotal evidence in Brazil, to show that money invested or accounted as investment does not necessarily end up as actual variation in infrastructure stock3. Figure 1.3 presents total investment in roads (all
in-vestment …gures are from Ferreira and Maliagros(1999), FM from now on) and new paved roads, constructed from World Bank data (WB from now on). One can see that until 1978 both new construction and investment grew more or less together, but correlations are less pronounced after 1980. But, if anything, except for a steep fall in 1978 that looks like a data problem, the extension of new paved roads has fallen less than investments in the last two decades. When a trend line is adjusted to investment and new roads (using FM data), we could note that the downward slope of investment starts at 1976/77 and is never reverted, but in the case of new roads the trend was never negative after the break in the same period. The correlation …gures also point to some change of patterns. While between 1961 and 1980 the in-vestment and new roads correlation is 0.54, it is only 0.07 from 1980 to1995, and for the entire period it is 0.36.4.
-2000 -1500 -1000 -500 0 500 1000 1500
1960 1965 1970 1975 1980 1985 1990 1995 2000 Investm ent
New Paved Roads (FM)
3There may be losses in the process, ine¢ciencies or even corruption. In the …rst
two cases one could think of the billions spent on the Brazilian Nuclear Program, the Transamazônica highway and the Ferrovia do Aço railroad, huge projects that were either never …nished (sometimes …nished but never implemented) or ended up costing twice as much as initially forecasted.
4In most of the exercises here, we used 1995 as the end year of our sample, because
Figure 1.3 New Paved Roads and Investment
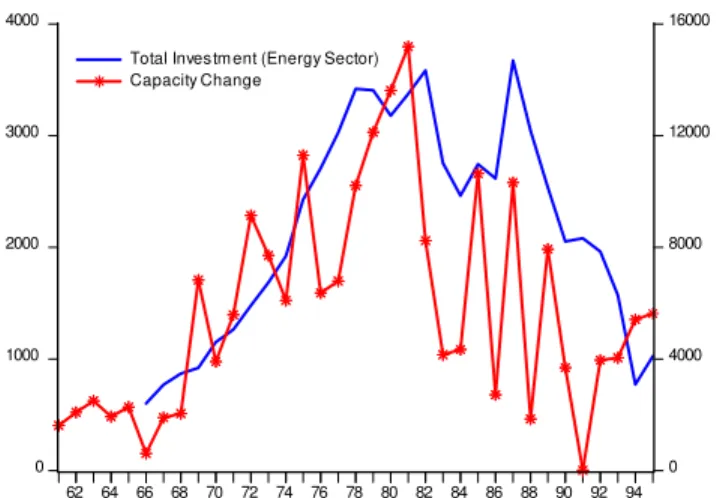
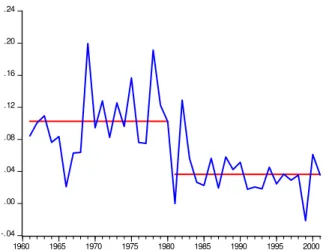
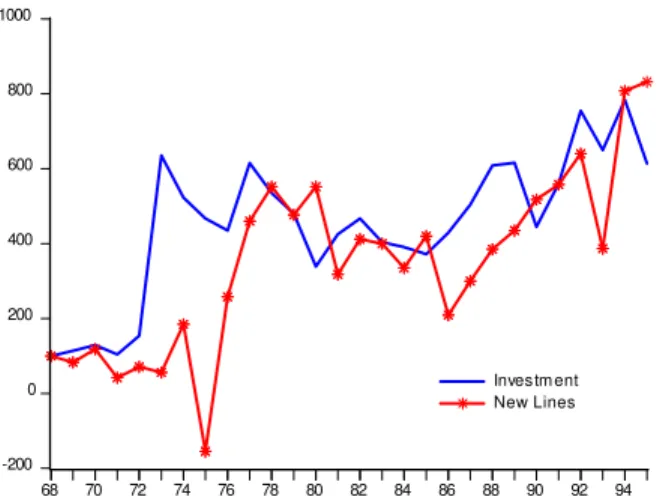
As said in the introduction, investment in electricity su¤ered a steep decrease from the eighties on. In fact, investment in power generating in 1995 was less than 30% of corresponding investment in the peak year of 1982, which is more or less the same picture for total investment. Figure 1.4 shows that investment fall had a strong e¤ect on the expansion of generating capacity, whose growth rate decreases erratically after 1981. Contrary to veri…ed for new roads, generating capacity has a relatively stable correlation with investment (close to 0.6). The slowdown of capacity of generating growth continued after 1995, as shown in Figure 1.5. This …gure also displays the mean growth before and after 1980: 10.3% and 3.6%, respectively.5
0 1000 2000 3000 4000
0 4000 8000 12000 16000
62 64 66 68 70 72 74 76 78 80 82 84 86 88 90 92 94 Total Investm ent (Energy Sector)
Capacity Change
Figure 1.4 Capacity Increase and Investment
5Not by accident, in 2001/2002 the country experienced energy rationing, most
-.04 .00 .04 .08 .12 .16 .20 .24
1960 1965 1970 1975 1980 1985 1990 1995 2000
Figure 1.5 Growth Rate of Generating Capacity
-200 0 200 400 600 800 1000
68 70 72 74 76 78 80 82 84 86 88 90 92 94 Investm ent New Lines
Figure 1.6 New Telephone Lines and Investment
3
Investment Flow and Capital Variation
To further explore the relationship between investment and stock variation, we perform some simple econometric analysis. In all cases the dependent variable is the annual change of one of the three physical measures of in-frastructure - paved roads, telephone lines installed and generating capacity. We used both the WB and FM series, but results are very close in most cases. The independent variables are the respective investment series. Regressions presented below were performed in logs. Although the accumulation iden-tity in fact links the change in the corresponding stock with the investment ‡ow, rather than their respective logs, by using the latter we can interpret coe¢cients as elasticities. Regressions without logs are presented in the ap-pendix, and with one exception which we comment on below, results are qualitatively very close6.
6There were no cointegration vectors between any pair of variables we tested, and so
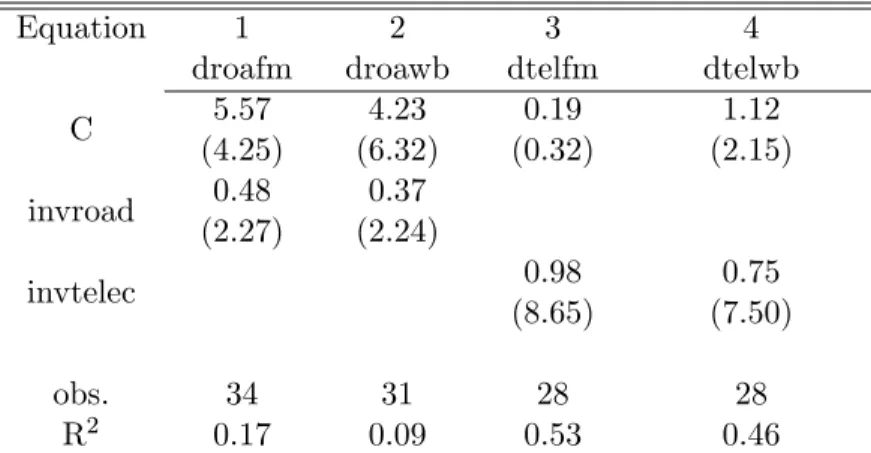
Table 3.1 Regressions of infrastructure stock variation
Equation 1 2 3 4
droafm droawb dtelfm dtelwb
C 5.57
(4:25)
4.23
(6:32)
0.19
(0:32)
1.12
(2:15)
invroad 0.48
(2:27)
0.37
(2:24)
invtelec 0.98
(8:65)
0.75
(7:50)
obs. 34 31 28 28
R2
0.17 0.09 0.53 0.46
note: White Heteroskedasticity correction used in all regressions
Table 3.1 presents results for the transportation and telecommunications sectors. The …rst two equations (columns) present the outcome of regressions of road investments (“invroads”) on new paved roads (“droad__”). In the …rst column FM data is used as dependent variable while in the second WB data is employed. In both cases the estimated coe¢cient has the expected sign and is signi…cant at the usual level. The estimated elasticities imply that an increase of 10% in the amount invested in roads generates an increase between 3.7% and 4.8% in the extensions of new paved roads7. Equations 3 and 4 present results for the telecommunications sector. The number of new telephone lines (“dtel__”) is highly sensitive to the amount invested in the sector (“invtelec ”) as estimated elasticity is close to one when FM data is used and 0.75 when WB data is used. In both cases R2 is relatively high and close to 0.5.
7Results of the regressions using variation in “Total Road Length” instead of variation
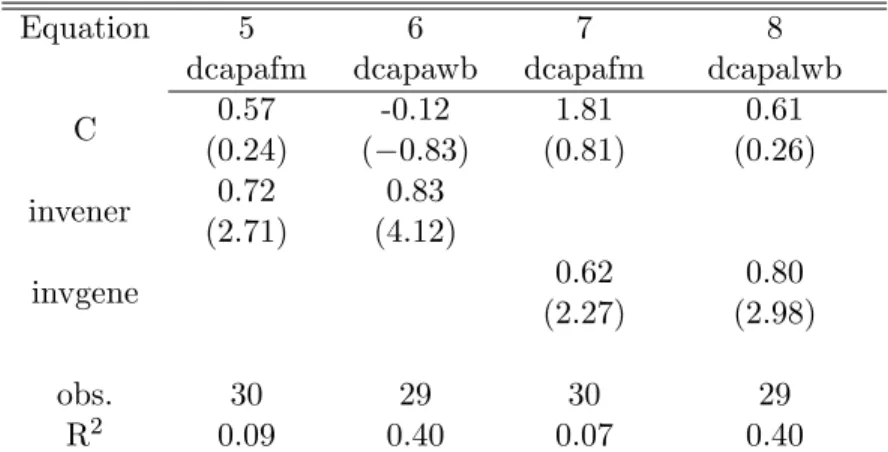
Table 3.2 Regressions of change of capital stock, energy
Equation 5 6 7 8
dcapafm dcapawb dcapafm dcapalwb
C 0.57
(0:24)
-0.12
( 0:83)
1.81
(0:81)
0.61
(0:26)
invener 0.72
(2:71)
0.83
(4:12)
invgene 0.62
(2:27)
0.80
(2:98)
obs. 30 29 30 29
R2
0.09 0.40 0.07 0.40 note: White Heteroskedasticity correction used in all regressions
Table 3.2 presents the results of the regressions for the energy sec-tor, using as dependent variable the variation of the generating capacity (“dcapa__”). In the …rst two models, the total investment in the energy sector (“invener ”) is the independent variable. Whether we use FM or WB data, the estimated coe¢cients are signi…cant and have the right sign. Moreover, the magnitude of the estimated elasticities is considerably large: a 10% increase in investments in the sector imply an 8% expansion in gen-erating capacity. The estimated elasticity of capacity change with respect to investment in generating capacity ( “invgene ”), presented in the last two columns, is similar in magnitude. We may interpret results here as in-dicating that generating capacity depends not only on direct investment in generating but also in transmission, distribution, etc.
As for regressions in levels whose estimations are presented in the ap-pendix, results are qualitatively similar in all cases but the road sector. In this case the estimated coe¢cient is not signi…cant when using FM data and only signi…cative at 10% when using WB data. This weaker relation-ship between stock variation and investment ‡ow is something that follows previous graphic analysis. It may suggest that investments in this case have uses other than the pure extension of road length, such as maintenance, im-provements, addition of extra lanes, etc., or that investment in the sector is less e¢cient than in others.
Overall, the estimated elasticities of infrastructure stock with respect to investment ‡ows are large and signi…cant8. This is a positive outcome
8This evidence, of course, does not imply that assets are being acquired at the "right"
because in a di¤erent regime, when infrastructure investment is allowed to increase, the corresponding expansion of generating capacity and paved roads, for instance, should be vigorous, even if there is some waste in the process.
In this section we did not study the empirical link between private stocks and private investment. This of course does not mean that the latter did not result in asset accumulation. The problem is not lack of data, but the fact that the private capital series available were constructed from investment series using the perpetual inventory method. Hence, by construction pri-vate investment resulted in capital accumulation. As opposed to the public infrastructure sector, in which we used physical measures to test the link be-tween capital accumulation and investment, we have no independent series for both in the case of the private sector. Hence, testing their relationship would be a tautology, as the variation of private capital is by construction equal to private investment minus depreciation.
4
The Growth Impact of Infrastructure
Having established a …rm relationship between investment ‡ows and capital variation, the next step is to identify relationships between public capital and GDP (and per capita GDP). After that, we verify the short- and long-run impact of public capital shocks on output.
The …gure below presents the evolution of GDP and Public Administra-tion Net Stock of Capital (Ipeadata series) from 1960 to the present9. The latter is divided between structures and machine and equipment capital.
of waste are proportional to the true cost of the capital goods, we would still …nd a close relation between investment expenditure and asset accumulation.
9The public capital stock series in the IPEADATA were constructed from past public
2 3 4 5 6 7 8
1960 1965 1970 1975 1980 1985 1990 1995 2000 GDP Equipm ent Cons truction
Figure 4.1: GDP, public structures and public equipment
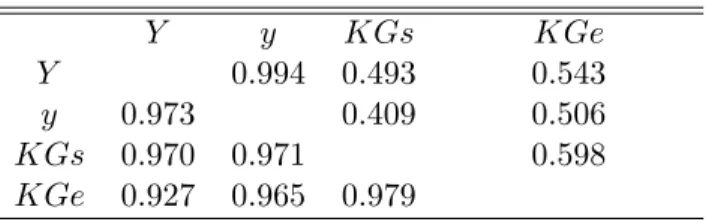
As one could expect, given the likelihood that public capital measures and GDP contain a common trend, these series move very closely. The same can be said of physical measures of infrastructure capital and GDP, as shown in Figure A1 in the appendix. Another exploratory analysis of this relationship is presented in the correlation table below, where variables are in level under main diagonal and in …rst di¤erence above it. In the table belowY stands for GDP andy for per capita GDP:
Table 4.1 Correlation Matrix
Y y KGs KGe
Y 0.994 0.493 0.543
y 0.973 0.409 0.506
KGs 0.970 0.971 0.598
KGe 0.927 0.965 0.979
*Variables are in level under main diagonal and in
…rst di¤erence above it.
levels are all very large and close to one. However, the correlations in …rst di¤erences are all positive and not small either. A similar pattern can be found in the correlations between physical measures of infrastructure and GDP, as shown in Table 4.2.
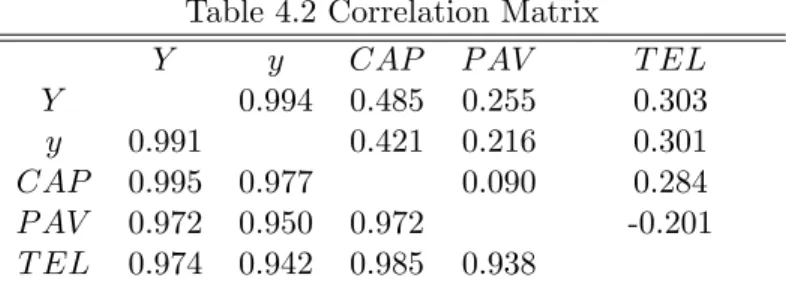
Table 4.2 Correlation Matrix
Y y CAP P AV T EL
Y 0.994 0.485 0.255 0.303
y 0.991 0.421 0.216 0.301
CAP 0.995 0.977 0.090 0.284
P AV 0.972 0.950 0.972 -0.201
T EL 0.974 0.942 0.985 0.938
*Variables are in level under main diagonal and in …rst .
di¤erence above it
Again, correlations between GDP (and also per capita GDP, y) and infrastructure are close to one. The …rst di¤erence correlations are, as ex-pected, smaller, but of larger magnitude in the case of power-generating capacity (CAP). The correlations with the variation of paved roads (P AV)
were found to be the weakest among all pairs, with that of telephone main lines (T EL) displaying intermediate values. As a …rst indication, there seems to exist a positive link between output and public capital and infrastructure10.
We now use time-series econometric techniques, particularly VAR mod-els, to study the relationship between output and public capital and in-frastructure. We want to estimate long-run relationships in order to estab-lish a dynamic model to be used in impulse-response exercises. In essence, we will estimate the impact on output of variations in infrastructure capital. The …rst step is to test variables for unit roots. We used Augmented Dickey-Fuller (ADF), Phillips-Perron (PP) and Kwiatkowski-Phillips-Schmidt-Shin (KPSS) tests, and in all three cases and for all variables we could not reject the hypothesis of the variables being integrated of order one.
Table 4.3 below present the result of the cointegration estimation of output per worker on public and private capital per capital and human capital. We used the KGsseries for public infrastructure, the IPEADATA series of private stock of machines and equipment,KP e; for private capital
1 0The physical measures includes private and public infrastructure, as opposed to the
and secondary attainment, from the Barro-Lee (2000) database, for human capital,KH:
Ferreira, Issler and Pessôa(2004) test di¤erent production functions used in growth studies and their results favor the Mincerian speci…cation of hu-man capital against more traditional speci…cations such as that used by Mankiw, Romer and Weil (1992). In practical terms, once we apply log-arithms, the only di¤erence between functional forms is if human capital enters in logs or levels. In Tables 4.3 we included both. Although we are not estimating production functions, results are sensible to the way we in-troduce human capital in the regression. We found one cointegration vector and the constant term is omitted.
Table 4.3 Cointegration Equations
sample y KGs KP e KH KH
60-00 1.00 -0.04
(0:08)
-0.59
(0:06)
-0.94
(0:11)
60-96 1.00 -0.16
(0:11)
-0.53
(0:07)
-0.75
(0:17)
60-00 1.00 -0.06
(0:09)
-0.59
(0:06)
-0.25
(0:03)
60-96 1.00 -0.22
(0:12)
-0.51
(0:08)
-0.19
(0:04)
ADF/PP/KPSS tests support the hypothesis of …rst-order
integration of all variables. Variables in logs, exceptKH :
long-run elasticities above one, as the latter most probably were capturing the e¤ect of omitted variables.
Estimations are more precise when we normalize variables by popula-tion instead of labor force. Of course, the latter makes more sense from an economic perspective. However, while the population series is an o¢-cial statistic from the IBGE, the Brazilian statistic bureau, the former is constructed interpolating census data, so that there is always some arbi-trary. Most probably it is not too relevant, but as a double check results are presented below:
Table 4.4 Cointegration Equations, variables per capita sample y KGs KP e KH KH
60-00 1:00 0:21 0:38 0:79 (0:20) (0:13) (0:32)
60-96 1:00 0:25 0:50 0:84 (0:14) (0:08) (0:25)
60-00 1:00 0:09 0:59 0:30 (0:10) (0:06) (0:04)
60-96 1:00 0:33 0:46 0:19 (0:15) (0:09) (0:07)
ADF/PP/KPSS tests support the hypothesis of …rst-order
integration of all variables. Variables in logs, exceptKH
Similarly to the per worker estimations, regression with the full sample are less precise although in all cases the coe¢cient ofKGshas the right sign and magnitudes are in line with the literature. Once again, the best …t was obtained when using human capital in levels and the shorter sample. In this case the estimated coe¢cient was larger than before, implying that a 10% increase of the stock of public infrastructure would raise long-run output per capita by 3.3%.
As it is well known, for a set of integrated variables, the Granger The-orem of Representation establishes the equivalence between cointegration and Vector Error Correction Model (VECM). Hence, we estimated the cor-responding VECM for the fourth model of Table 4.3 (that uses the smaller sample), from which we obtained a dynamic system of equations fory; KGs; KP eandKH, the last variable in levels. We used this VAR system to sim-ulate the response of economic variables to infrastructure shocks11. The
1 1Alternative ordering of the impulse-response exercises did not change signi…cantly
…gure below presents the response of per capita output and private capital to a shock toKGscorresponding to 1% of GDP:
90 95 100 105 110 115 120 125
2004 2006 2008 2010 2012 2014 2016 2018 2020 2022 2024 2026 2028 2030 2032 2034 2036 2038 2040 2042 2044 2046 2048 2050 2052 2054 2056 2058 2060
output private capital
Figure 4.2: response of per capita GDP and KPe to one unit shock to KGs
The accumulated impact of changes in public capital on private capital and output per capita is relatively sizeable, especially if we consider the long-run response. Per capita output increase by10% in the long run andKP e
by almost20%:It is important to stress the auto-regressive character of the growth rate of output, with signi…cant feedback impact in all equations and in the propagation of the initial shock. In this sense, after its initial shock of 1%, public infrastructure increases in the long run by almost 8%, and its convergence rate is faster than those of other variables (and no decrease in the …rst periods happens). In any case, the accumulated responses are too high and well above similar exercises that use U.S. and other OECD countries data (see for instance Perotti(2004)). These results seems robust, however, as they did not change signi…cantly when we used the full sample or change the form human capital enters in the regression. In contrast, when we employ per capita variables the accumulated impact on (per capita) output and private capital was found to be much smaller,3% and6% respectively.
5
An Experiment on Cash Flow and Solvency
and public solvency. The experiment is rather simple, but it can be useful as a …rst approximation, and can give us an idea of the magnitudes and constraints of this type of policy. We investigate the impact of one single “project” - public investment increases by 1% of GDP in one year - in the government future cash ‡ow and net worth. We basically want to study whether public investment in infrastructure pays for itself, especially in the form of increased tax collection.
We use the impulse-response system of Section 4 to simulate in the …rst place the paths of GDP and KGs after a shock to the latter at time zero (2004), and the initial increase in KGs is …nanced entirely by debt. From the simulated path of output we then calculate the variation of tax revenues, assuming that the tax ratio remains forever in the current level, 35%. This is trivially given by dT axt = 0:35 dYt;and the trajectory of taxes follows that of GDP.
Moreover, from the path of KGs we have to calculate the increase in gross investment, which is a cost. This is done by the following formula12:
It=KGst+1 KGst+ (KGst KGs0)
Some additional assumptions were necessary to run this experiment. First, we set real interest rate constant at 8% for the entire period. This is not far from its recent past value, and at the moment interest rates on central government bonds are close to 12% in real terms, although this is clearly not its equilibrium value. When considering longer periods (say, the last 20 to 30 years) this rate is may be bit below 8%, but discount rates used in the privatization of public infrastructure in general were above this rate. This rate is also close to the rate that the federal government …nances its investment projects. However, the assumption of a constant interest rate, although necessary for the simulations in this sub-section, is problematic. First of all, in the long-run public capital accumulation and the increase in government net worth will decrease the interest rate. In contrast, given current levels of debt to GDP ratio, short run growth in debt and reduction in net revenues will pressure this rate up. Given the simple partial equilib-rium methodology we use, it is impossible to verify which e¤ect dominates. We relax, albeit arbitrarily, this assumption in one simulation presented in Figure 5.113. Second, we abstract of any general equilibrium consequence of
1 2Note that we subtractedKGs
0 in order to eliminate from the formula the investment necessary to make up for the depreciation of the previous capital stock.
1 3One option we tried to pursue without success was to endogeneize the interest rate so
public capital on private capital, which can be positive or negative, depend-ing on many factors, and certainly impacts tax collection. Finally, results are somewhat in‡uenced by depreciation rate, as it a¤ects gross investment and costs. We used as a benchmark 5%, but also 3.5% and 10%, as a ro-bustness check. The chosen value may seem low but we consider it adequate for public capital structures.
A common form of analyzing the impact of a given project on …scal sustainability is to study its in‡uence in the government net worth:
N W =
T
X
t=0
(T axt It Ct)
(1 +r)t D0 (1)
As it is standard, the net worth is the present value of government pri-mary surplus, (T axt It Ct) minus the initial value of debt. This is a straightforward calculation, given the simulated values of tax collection and investment above and the hypothesis that public consumption, C;does not change with new capital projects. Note that in the formula above we are not considering user fees nor are we taking into into account the increase in the value of public assets, i.e., the variation ofKGs.
We performed this exercise for di¤erent models (i.e., human capital in level or in logs) and time periods (full sample or the 1960-96 sample). Results are somewhat in‡uenced whether we use per capita or per labor values, so we will report both. Following Perotti (2004) we report in Table 5.1 below results assuming the …nal date T to be 5, 10 or 20 years, and the order of the models follows data of Table 4.3:
Table 5.1: Net Worth as proportion of GDP sample 5 years 10 years 20years 60-00 (KH) -0.3 -1.6 3.1 60-96 (KH) -2.3 0.4 7.0 60-00 (KH ) -2.6 -0.6 3.9 60-96 (KH ) -2.1 0.9 7.1 obs: models correspond to those in Table 4.3 that used per labor variables.
Net worth values are presented as a proportion of 2004 GDP and corre-spond to the models in per labor terms. Given the large response of GDP
to public capital shocks observed in the exercises of the previous section, the net worth of a project which is equivalent to increase by 1% of GDP public capital stock is positive in the very long run (after 20 years) as one could expect. Hence, public investment does pay for itself, in the sense that the increase in tax collection is more than enough to o¤set the debt increase and the necessary investment implied by the increase in public capital af-ter the initial shock. This contrast to results in Perotti(2004) which rejects the hypothesis, for 6 OECD countries, that shocks to public investment are self-amortazing.
Note, however, that in all cases the transition involves negative net worth values for a long period. In all models net worth is negative after …ve years and in two of them it is still negative after ten years. This is so because the response of public capital is initially faster than that of GDP and taxes, which is a …xed proportion of the former. Estimations using the full sample reached more modest outcomes in the long run (around half the value of results obtained with the smaller sample). In the benchmark model (line four, human capital in levels and shorter sample) net worth is positive but close to zero ten years later. This could mean that, if the government decides to implement a sequence of projects in a annual base using debt …nance, the costs along the transition could be too high and not sustainable, even if in the long run solvency is guaranteed14.
Results, of course, depend on the value of the interest rate and on the depreciation rate used in the investment equation. If we use higher depre-ciation rates, so that investment will be higher in the future, the net worth falls as it also does if we discount heavily the future. For instance, with
r = 12% and = 10% the net worth as a proportion of current GDP is exactly zero when considering the full sample model. However, the bench-mark model delivers positive net worth of this investment project for any reasonable combination of parameters.
There is one variation of equation (1) that is worth studying, which is to take into account the increase in the value of public assets, i.e., to add the variation of KGs to the government net worth. In doing so we have to decide what fraction of new public structures are liquid or what is the relationship between the estimated variation in real terms of KGs and its market value. A one-to-one hypothesis is for sure extreme, as a large part of infrastructure in this country (e.g. most roads and sewage system in poor
1 4Estimations using per capita cariables in two cases reached very di¤erent outcomes.
regions) cannot be sold to private agents at positive price as demand is low or at least low enough not to pay for the investment. Just as a benchmark, for lack of a better number, let´s say that half the increase in public capital could be sold at its estimated value.
Another necessary decision is the date these assets would be "sold". If we set it at a date too far in the future, the variation ofKgsin present value tend to zero, of course. We will estimate this modi…ed net worth (equation (1)
plus the present value of the variation of public capital) following the dates of Table 5.1. As one could expect, solvency improves. In the benchmark case, the net worth of a project corresponding to an initial increase ofKGs
of1% of GDP, is now only 1:2% after 5 years and2:1%when considering 10 years, as opposed to 2:1%and 0:9%;respectively, observed in Table 4.5. In the case of the full-sample model (human capital in levels) net worth after 10 years is now positive.
Although results in general are very favorable to the argument that in-vestment pays for itself and that one should not impose restrictions on debt …nance if capital expenditures, some caution is necessary. First, as said be-fore, not all types of public structures are highly liquidity or are sold without at a premium. Most probably, the majority is not, and the recent PPP law is an indication of that. Moreover, in the impulse-response exercise there is no loss or ine¢ciency in the sense that there are no "white elephants" and that every Real invested turns into public capital that, in its turn, clearly generates enough tax revenue or are potentially interesting to the private sector. It is highly unlike that all new public assets could be classi…ed as such. This does not imply that results here are invalid. It only quali…es them in the sense that, if in the one hand there are clear and robust indi-cations that debt …nance is worth pursuing as a mechanism to fund public infrastructure, in the other hand our methodology assumed that all public investment projects are (equally) "good projects", which is not the case. Moreover, as said before, estimated elasticities and the response of GDP to KGs shocks are bit large and well above those obtained in similar studies for other countries.
0.5100 0.5200 0.5300 0.5400 0.5500 0.5600 0.5700 0.5800 0.5900 0.6000 0.6100 0.6200
2004 2005 2006 2007 2008 2009 2010 2011 2012 2013 2014 2015
no shock capital shock capital and interest shock
Figure 5.1 Simulated Paths of the Debt to GDP Ratio
The horizontal line assumes that primary surplus would stay at a level high enough to hold constant the debt ratio in the absence of shocks. The line in the middle corresponds to the previous simulation (a temporary shock to KGs of 1% of GDP …nanced by debt emission), and shows that new public investment expenses may lead to short run problems to public …nances (as debt-ratio overshoots), although in the medium to long run the debt ratio falls. However, after ten years the debt ratio is still marginally above its “before shock level”and it will take some years for it to fall bellow it15.
If agents respond to the negative …scal shock by demanding higher in-terest rate to re…nance old public debt and to …nance the new project, the short run problems should exacerbate - see upper line. In this simulation interest rate increased by 0.5% in 2005 and decreased subsequently by 0.1% a year, until it was back to 8%, its original level. In this case, ten years after the shock debt ratio is still six points above 55% and it stays above it for decades.
1 5This result is sensitive to time period and speci…cation. In general, debt ratio falls
6
Conclusion
In this paper we have shown, using di¤erent data sets and methodologies, that the productive impact of infrastructure in Brazil is relevant. Impulse-response exercises indicated that the observed decrease in capital expendi-tures in the recent past might have hurt growth and brought about high output and social costs. In most exercises we showed that shocks to in-frastructure stock might generate sizeable variations in output..
There is now consensus in Brazil on the need to expand capital and maintenance expenditures in the infrastructure sector. However, …scal irre-sponsibility in the past led the public sector to one of the highest indebtness levels ever, which demanded tight …scal policies from the central and state governments in the recent years. Such policies are often perceived as the cause of the reduction of infrastructure expenditures, so that under current rules, it is not very reasonable to expect considerable increases in public investment. Moreover, simulations in this article showed that if entirely …-nanced by debt, the expansion of public capital expenditures might lead in the short and medium run to debt to GDP ratio above the current levels. Given that this ratio in Brazil is already extremely high, solvency of the public sector is an issue. Small increases in this ratio, even a short-run vari-ation backed by future tax collection or rents, may lead to increases in the interest rate of public bonds that may o¤set future revenue gains.
The discussion of new rules and regimes of …nancing public investment is beyond the scope of this article. However, given that the gap in infrastruc-ture investment has important productive impacts, this is a important ques-tion that should be immediately addressed by policy makers and academics. We showed in the net worth simulations that, most probably, public invest-ment does "pay for itself": the present value of tax revenues and of the capital gain associated to new investment projects is in the long-run above the costs involved. Although we made somewhat strong assumptions about the market value of public assets and e¢ciency of public investment, we be-lieve that this result is robust. This is an indication that debt …nance could be used, but that it should be restrictive and selective, and associated to projects that clearly generates enough revenue or are potentially interesting to the private sector.
References
[2] Ai, C. and S. Cassou (1995) “A Normative Analysis of Public Capital,” Applied Economics, 27, pp. 1201-1209.
[3] Aschauer, D. (1989) “Is Public Expenditure Productive?” Journal of Monetary Economics, 23, pp. 177-200.
[4] Calderón, C. and L. Servén (2003) “The Output Cost of Latin America’s Infrastructure Gap,” In W. Easterly and L. Servén (eds.) The Limits of Stabilization: Infrastructure, Public De…cits, and Growth in Latin America, Stanford University Press and the World Bank.
[5] Calderón, C., W. Easterly and L. Servén (2003) “Infrastructure Com-pression and Public Sector Solvency in Latin America,” in W. East-erly, W. and L. Servén (eds.): The Limits of Stabilization. Infrastruc-ture, Public De…cits, and Growth in Latin America, Stanford University Press.
[6] Canning D. and E. Bennathan (2002), “The Social Rate of Return on Infrastructure Investment”, World Bank Policy Research Discussion Paper 2390.
[7] Easterly, W and S. Rebelo (1993) “Fiscal Policy and Economic Growth: an Empirical Investigation” Journal of Monetary Economics, 32, pp. 417-458.
[8] Ferreira, P.C. and T. Maliagros (1998) “Impactos Produtivos da Infra-Estrutura no Brasil – 1950/95”, Pesquisa e Planejamento Econômico, v.28, n.2, pp.315-338.
[9] Ferreira, P. C., Issler, J. V. e Pessôa, S. A. (2003) “Testing Production Functions Used in Empirical Growth Studies,” Economic Letters, Vol. 83(1), April 2004.
[10] Mankiw, G., Romer, D. and D. Weil, (1992) "A Contribution to the Empirics of Economic Growth," Quarterly Journal of Economics, 107, 2, pp. 407-437
[11] Mintz, J. and M. Smart(2004) “Incentives for Public Investment under Fiscal Rules” Mimeo, University of Toronto.
[13] Pritchett, Lant. (2000). “The tyranny of concepts: CUDIE (cumulated, depreciated, investment e¤ort) is not capital.” Journal of Economic Growth, 5 (4), December, pp. 361-384.
[14] Roubini, Nouriel, and Je¤rey Sachs. 1989. “Government Spending and Budget De…cits in the Industrial Countries.” Economic Policy 8: 99– 132.
[15] Velloso, R. (2004), “Cortar gastos correntes é a solução?”, Estudos e Pesquisas do Inae # 78.
A
Regressions in Levels (not logs)
Table A.1.: Regressions of change of capital stock(level) droafm droawb dtelifm dtelwb
C 4907.2
(3:63)
2883.4
(3:98)
-2.09
( 0:03)
20.52
(0:54)
invroad -2.21
( 0:45)
3.05
(1:75)
invtelec 1.12
(6:06)
0.71
(5:84)
obs. 35 35 28 28
R2 0.02 0.05 0.43 0.43
obs:White Heteroskedasticity correction used in all regressions
Table A.2: Regressions of change of capital stock, energy dcapafm dcapawb dcapafm dcapalwb
C 0.57
(0:24)
524.4
(1:18)
1.81
(0:81)
564.9
(2:34)
invener 0.14
(4:14)
0.14
(2:31)
invgene 0.23
(4:05)
0.23
(2:34)
obs. 30 30 30 30
R2
0.32 0.23 0.32 0.25
B
Dynamic system of Section 4.1
The system below corresponds to benchmark model and was used in the simulations in Section $.
.
4
2
,
0
5
1
.
0
1
6
.
0
6
7
.
0
0
4
.
0
5
7
.
0
8
2
.
0
3 2 1 3 21 − − − − −
−
−
+
+
−
−
+
=
t T T t T T tK
K
P
U
K
P
U
Y
Y
C
Granger Tests
The …gure below presents the result of Granger causality tests between pub-lic and private capital and output and between pubpub-lic and private capital. In all cases the stock of public capita causes GDP or PCGDP, but in the case of public structures there is double causality. Note also that there is precedence of public capital stock with respect to private capital stock in all cases.
Granger Causality Test (5%) Variables in Level
GDP PCGDP KGs KGe
KGs
⇔ ⇔
KGe
⇒ ⇒
Private Ks
⇐ ⇐ ⇐ ⇐
Private Ke
⇔ ⇐
⇔ (Two directions causality)
⇒ (Column variable Granger causes row variable)
⇐ (Row variable Granger causes column variable)
(Both null hypothesis of causality are rejected)
D
Additional Figures and Tables
Table 4.5: Net Worth as proportion of GDP sample 5years 10 years 20 years 60-00 (KH) -3.1 -3.9 -2.9 60-96 (KH) -2.0 0.8 6.4 60-00 (KH ) -3.9 -5.2 -3.9 60-96 (KH ) -2.8 -1.8 2.2
4 6 8 10 12 14 16 18
60 62 64 66 68 70 72 74 76 78 80 82 84 86 88 90 92 94 GDP
Paved Roads Generation Capacity Phone Lines Instaled
Figure A1: GPD and Infrastructure
.00 .02 .04 .06 .08 .10 .12 .14
1960 1965 1970 1975 1980 1985
Structures
-.04 .00 .04 .08 .12 .16
1960 1965 1970 1975 1980 1985
Equipments
´
Ultimos Ensaios Econˆomicos da EPGE
[588] Maria Cristina Trindade Terra e Ana Lucia Vahia de Abreu. Purchasing Power
Parity: The Choice of Price Index. Ensaios Econˆomicos da EPGE 588, EPGE–
FGV, Abr 2005.
[589] Osmani Teixeira de Carvalho Guill´en, Jo˜ao Victor Issler, e George Athanasopou-los. Forecasting Accuracy and Estimation Uncertainty using VAR Models with
Short– and Long–Term Economic Restrictions: A Monte–Carlo Study. Ensaios
Econˆomicos da EPGE 589, EPGE–FGV, Abr 2005.
[590] Pedro Cavalcanti Gomes Ferreira e Samuel de Abreu Pessˆoa. The Effects of
Longevity and Distortions on Education and Retirement. Ensaios Econˆomicos
da EPGE 590, EPGE–FGV, Jun 2005.
[591] Fernando de Holanda Barbosa. The Contagion Effect of Public Debt on
Mo-netary Policy: The Brazilian Experience. Ensaios Econˆomicos da EPGE 591,
EPGE–FGV, Jun 2005.
[592] Rubens Penha Cysne. An Overview of Some Historical Brazilian
Macroeco-nomic Series and Some Open Questions. Ensaios Econˆomicos da EPGE 592,
EPGE–FGV, Jun 2005.
[593] Luiz Renato Regis de Oliveira Lima e Raquel Menezes Bezerra Sampaio. The
Asymmetric Behavior of the U.S. Public Debt.. Ensaios Econˆomicos da EPGE
593, EPGE–FGV, Jul 2005.
[594] Pedro Cavalcanti Gomes Ferreira, Roberto de G´oes Ellery Junior, e Victor Go-mes. Produtividade Agregada Brasileira (1970–2000): decl´ınio robusto e fraca
recuperac¸˜ao. Ensaios Econˆomicos da EPGE 594, EPGE–FGV, Jul 2005.
[595] Carlos Eugˆenio Ellery Lustosa da Costa e Lucas J´over Maestri. The
Interac-tion Between Unemployment Insurance and Human Capital Policies. Ensaios
Econˆomicos da EPGE 595, EPGE–FGV, Jul 2005.
[596] Carlos Eugˆenio Ellery Lustosa da Costa. Yet Another Reason to Tax Goods. Ensaios Econˆomicos da EPGE 596, EPGE–FGV, Jul 2005.
[597] Marco Antonio Cesar Bonomo e Maria Cristina Trindade Terra. Special Interests
and Political Business Cycles. Ensaios Econˆomicos da EPGE 597, EPGE–FGV,
Ago 2005.
[598] Renato Galv˜ao Flˆores Junior. Investimento Direto Estrangeiro no Mercosul:
[599] Aloisio Pessoa de Ara´ujo e Bruno Funchal. Past and Future of the Bankruptcy
Law in Brazil and Latin America. Ensaios Econˆomicos da EPGE 599, EPGE–
FGV, Ago 2005.
[600] Marco Antonio Cesar Bonomo e Carlos Carvalho. Imperfectly Credible
Disin-flation under Endogenous Time–Dependent Pricing. Ensaios Econˆomicos da
EPGE 600, EPGE–FGV, Ago 2005.
[601] Pedro Cavalcanti Gomes Ferreira. Sobre a Inexistente Relac¸˜ao entre Pol´ıtica
Industrial e Com´ercio Exterior. Ensaios Econˆomicos da EPGE 601, EPGE–
FGV, Set 2005.
[602] Luiz Renato Regis de Oliveira Lima, Raquel Sampaio, e Wagner Gaglianone.
Limite de Endividamento e Sustentabilidade Fiscal no Brasil: Uma abordagem via modelo Quant´ılico Auto–Regressivo (QAR). Ensaios Econˆomicos da EPGE
602, EPGE–FGV, Out 2005.
[603] Ricardo de Oliveira Cavalcanti e Ed Nosal. Some Benefits of Cyclical Monetary
Policy. Ensaios Econˆomicos da EPGE 603, EPGE–FGV, Out 2005.
[604] Pedro Cavalcanti Gomes Ferreira e Leandro Gonc¸alves do Nascimento. Welfare
and Growth Effects of Alternative Fiscal Rules for Infrastructure Investment in Brazil. Ensaios Econˆomicos da EPGE 604, EPGE–FGV, Nov 2005.
[605] Jo˜ao Victor Issler, Afonso Arinos de Mello Franco, e Osmani Teixeira de Carva-lho Guill´en. The Welfare Cost of Macroeconomic Uncertainty in the Post–War
Period. Ensaios Econˆomicos da EPGE 605, EPGE–FGV, Dez 2005.
[606] Marcelo Cˆortes Neri, Luisa Carvalhaes, e Alessandra Pieroni. Inclus˜ao Digital
e Redistribuic¸˜ao Privada. Ensaios Econˆomicos da EPGE 606, EPGE–FGV, Dez
2005.
[607] Marcelo Cˆortes Neri e Rodrigo Leandro de Moura. La institucionalidad del
salario m´ınimo en Brasil. Ensaios Econˆomicos da EPGE 607, EPGE–FGV, Dez
2005.
[608] Marcelo Cˆortes Neri e Andr´e Luiz Medrado. Experimentando Microcr´edito:
Uma An´alise do Impacto do CrediAMIGO sobre Acesso a Cr´edito. Ensaios
Econˆomicos da EPGE 608, EPGE–FGV, Dez 2005.
[609] Samuel de Abreu Pessˆoa. Perspectivas de Crescimento no Longo Prazo para o
Brasil: Quest˜oes em Aberto. Ensaios Econˆomicos da EPGE 609, EPGE–FGV,
Jan 2006.
[610] Renato Galv˜ao Flˆores Junior e Masakazu Watanuki. Integration Options for
Mercosul – An Investigation Using the AMIDA Model. Ensaios Econˆomicos da
EPGE 610, EPGE–FGV, Jan 2006.
[611] Rubens Penha Cysne. Income Inequality in a Job–Search Model With
[612] Rubens Penha Cysne. An Intra–Household Approach to the Welfare Costs of
Inflation (Revised Version, Forthcoming 2006, Estudos Econˆomicos). Ensaios