FEKADU GEBRETENSAY MENGISTU
CROSS-SPECIES AMPLIFICATION OF MICROSATELLITE MARKERS AND GENETIC DIVERSITY IN THE MACAW PALM (Acrocomia aculeata)
VIÇOSA
MINAS GERAIS – BRAZIL 2015
Ficha catalográfica preparada pela Biblioteca Central da Universidade Federal de Viçosa - Câmpus Viçosa
T
Mengistu, Fekadu Gebretensay, 1978-M544c
2015
Cross-species amplification of microsatellite markers and genetic diversity in the macaw palm (Acrocomia aculeata) / Fekadu Gebretensay Mengistu. – Viçosa, MG, 2015.
xiv, 84f. : il. ; 29 cm.
Orientador: Sérgio Yoshimitsu Motoike.
Tese (doutorado) - Universidade Federal de Viçosa. Inclui bibliografia.
1. Acrocomia aculeata. 2. Macaúba - Melhoramento genético. 3. Marcadores moleculares. 4. Diversidade genética. 5. Germoplasma vegetal. 6. Biocombustível. I. Universidade Federal de Viçosa. Departamento de Fitotecnia. Programa de Pós-graduação em Fitotecnia. II. Título.
ii
Dedicated to my family especially my mother Mrs. Aregash Admassie; my wife Etsegenet Tsegaye and my children Hermella
iii ACKNOWLDEGEMENT
My first most special thanks go to the almighty God!
I would like to acknowledge the Postgraduate Program of Plant Sciences, Federal University of Viçosa, for accepting my application to study doctor science.
The professors of the Postgraduate Program of Plant Sciences and Genetics and Breeding are also acknowledged for the knowledge they shared with me and support for the last four years.
Special thanks also go to my beloved wife Etsegenet Tsegaye; my children Hermella and Amanuel Fekadu; my mother Aregash Admassie and the rest of family members for their unreserved support and endurance during this long period of my absence away from them.
I would like to thank Dr. Gustavo Fialho; Dr. Fabricio Sobreira; Prof. Cláudio Horst Bruckner and for their special reception and treatment from the first day of my arrival in Brazil. I am also grateful to my advisor Prof. Sérgio Yoshimitsu Motoike for his personal encouragement, research advisor-ship and professional guidance until this moment. My special thanks also go to colleagues of Biotechnology and Plant Breeding Laboratory, Department of Plant Sciences, including Dra. Telma, Dr. Éder Lanes, Prof. Carlos Nick, Renata Freitas, Dra. Kacilda Naomi Kuki and Fransico for their unreserved assistance during my laboratory and field activities.
Petróleo Brasileiro S.A (Petrobras); Conselho Nacional de Desenvolvimento Científico e Tecnológico (CNPq) and The Wold Academy of Sciences (TWAS) are highly acknowledged for their financial support.
iv BIOGRAPHY
v TABLE OF CONTENTS
LIST OF SYMBOLES AND ABBREVIATIONS ... vii
LIST OF FIGURES ... ix
LIST OF TABLES ... x
RESUMO ... xi
ABSTRACT ... xiii
GENERAL INTRODUCTION ... 1
REFERENCES ... 4
LITERATURE REVIEW ... 6
1. BOTANY AND TAXONOMICAL DESCRIPTION ... 6
2. GEOGRAPHICAL DISTRIBUTION AND ECOLOGY ... 8
3. AGRICULTURAL PRACTICES AND USES ... 9
4. GENETIC DIVERSITY IN PLANTS ... 11
5. MOLECULAR MARKERS ... 12
5.1 Microsatellite (SSR) markers ... 13
5.2 Development of microsatellite markers and transferability among species ... 14
7. REFERENCES ... 18
CHAPTER 1 ... 25
CROSS-SPECIES AMPLIFICATION AND CHARACTERIZATION OF NEW MICROSATELLITE MARKERS FOR THE MACAW PALM, Acrocomia aculeata (Arecaceae). ... 25
AMPLIFICAÇÃO CRUZADA E CARACTERIZAÇÃO DE NOVOS MARCADORES MICROSSATÉLITES PARA A MACAÚBA, Acrocomia aculeata (Arecaceae). ... 26
1. INTRODUCTION ... 27
2. MATERIALS AND METHODS ... 28
2.1 Plant material and DNA isolation ... 28
2.2 Condition of Polymerase Chain Reaction (PCR) and electrophoresis ... 31
2.3 Polyacrylamide gel staining ... 31
2.4 Data analyses ... 33
3. RESULTS ... 34
3.1 Cross-Amplification and Polymorphism ... 34
4. DISCUSSION ... 40
5. CONCLUSIONS ... 43
6. REFERENCES ... 45
vi GENETIC DIVERSITY IN THE MACAW PALM (Acrocomia aculeata) GERMPLASM
ACCESSIONS BASED ON MICROSATELLITE MARKERS. ... 50
DIVERSIDADE GENÉTICA EM ACESSOS DE GERMOPLASMA DE MACAÚBA (Acrocomia aculeata) COM BASE EM MARCADORES MICROSSATÉLITES. ... 52
1. INTRODUCTION ... 54
2. MATERIALS AND METHODS ... 55
2.1 Plant material and DNA isolation ... 55
2.2 Condition of Polymerase Chain Reaction (PCR) and Electrophoresis ... 59
2.3 Polyacrylamide gel staining ... 59
2.4 Data analyses ... 60
3. RESULTS AND DISCUSSION ... 62
3.1 Allelic polymorphism and heterozygosity ... 62
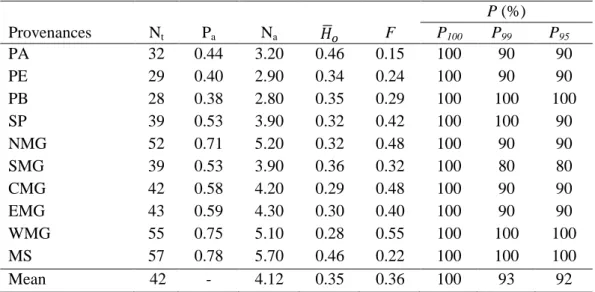
3.2 Genetic diversity ... 64
4. CONCLUSIONS ... 76
5. REFERENCES ... 78
vii LIST OF SYMBOLES AND ABBREVIATIONS
A Number of alleles per locus
F Inbreeding coefficient
HE Expected heterozygosity
HO Observed heterozygosity
Average observed heterozygosity
HWE Hardy-Weinberg Equilibrium
I Nei’s genetic identity
Na Average number of alleles per provenance
Ne Effective number of alleles per provenance
Nt Total number of alleles per pronenance
P Percentage of polymorphic loci
p Frequency of null alleles
Pa Proportion of alleles per provenance
Φ Phi-statistics
Variance among provenances
Variance among families
Variance within family
Total variance
AgNO3 Silver Nitrate
AMOVA Analysis of Molecular Variance
BAG Active Germplasm Bank of Macaúba
CTAB Cetyl Tri-methyl Amonium Bromide
dNTPs Deoxynucleotide triphosphates
viii
gDNA Genomic DNA
HCL Hydrochloric Acid
MgCl2 Magnesium Chloride
NaCl Sodium Chloride
Na2CO3 Sodium carbonate
PCoA Principal Coordinate Analysis
PCR Polymersase Chain Reaction
PIC Polymorphic Information Content
SDS Sodium Dodecyl Sulfate
SSRs Simple Squence Repeats
TBE Tris-Borate-EDTA
TE Tris-EDTA
ix LIST OF FIGURES
CHAPTER 1
Figure 1. Map of Brazil showing the six geographical States, where the original plant materials were collected. The States include Pará; Pernambuco; Paraiba; São Paulo; Minas Gerais and Mato Grosso do Sul. Araponga is a city in Minas Gerais State, where the germplasm bank is located in which the experimental plant materials were obtained. ... 29
Figure 2. Allelic profiles showing cross-species amplifications of seven SSR loci on Acrocomia aculeata accessions. Loci include Aac04 and Aac12 (Astrocarym aculeatum); sMo00020 and sMo00137 (Elaies oleifera); and Aacu38, Aacu45 and Aacu74 (Acrocomia aculeata). The amplification is on 48 selected A. aculeata accessions of twelve families. BGP99 (Pará); BGP82 (Pernambuco); BGP124 (Paraiba); BGP51, BGP34 and BGP47 (São Paulo); BGP20, BGP68, BGP18, BGP11 and BGP21 (Minas Gerais) and BGP102 (Mato Grosso do Sul). Allele amplicon size (bp) indicated for each locus. ... 37
CHAPTER 2
Figure 1. (A) Map shows the six provenances, in which the families were originally collected; (B) part of the experimental field in Araponga-Minas Gerais, where the germplasm bank (BAG-Macaúba) is located. ... 56
Figure 2. UPGMA dendogram of six Acrocomia aculeata provenances constructed from genetic distance (Nei, 1972) matrix. PA=Pará; PE=Pernambuco; PB=Paraiba; SP=São Paulo; MG (NMG=North Minas Gerais; SMG=south Minas Gerais; CMG=Central Minas Gerais; EMG=East Minas Gerais; WMG=West Minas Gerais); and MS=Mato Grosso do Sul. The first row (0-100) represents percentages of dissimilarity; and the second row (0-0.94) contains levels of fusion (average genetic distance) generated at each level of group formation. ... 66
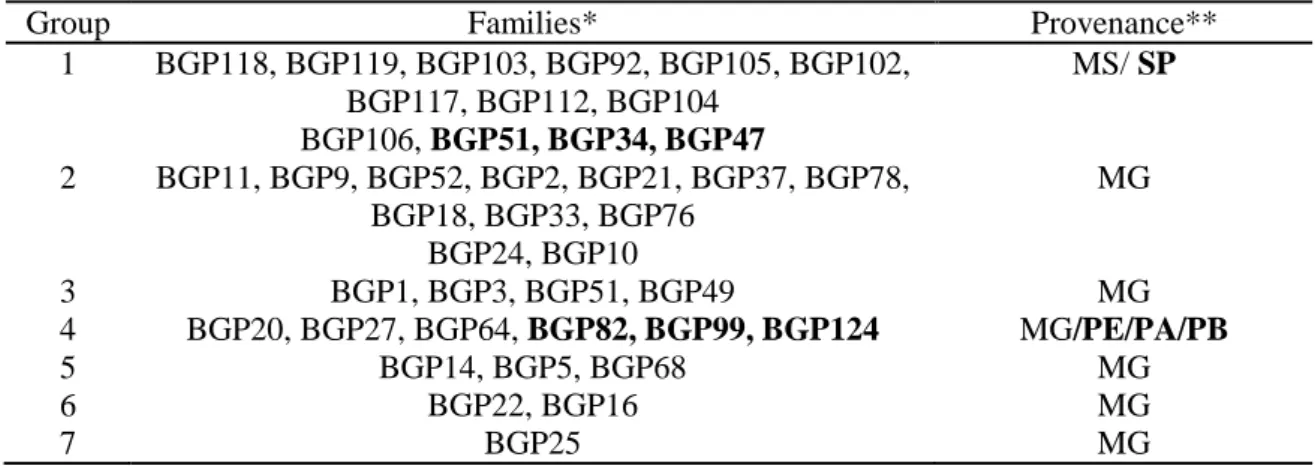
Figure 3. Graphical dispersion of 192 Acrocomia aculeata accessions using Principal Coordinate Analysis (PCoA) showing grouping of the accessions into different distinct groups. Provenances include PA=Pará, PE=Pernambuco; PB=Paraiba; SP=São Paulo; MG=Minas Gerais (containing five sub-provenances: NMG, SMG, CMG, EMG and WMG shown as on group); and MS= Mato Grosso do Sul. ... 70
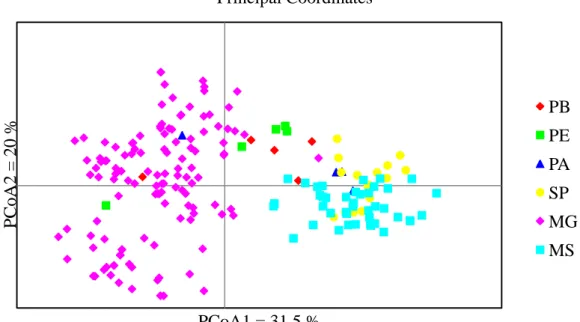
Figure 4. Graphical dispersion of provenances of Acrocomia aculeata in relation to three principal components, established by analysis of 10 SSR loci. Provenances include 1=Pará, 2=Pernambuco; 3=Paraiba; 4=São Paulo; 5−9 are sub-provenances of Minas Gerais (5=NMG; 6=SMG; 7=CMG; 8=EMG; 9=WMG) and 10=Mato Grosso do Sul. ... 71
x LIST OF TABLES
CHAPTER 1
Table 1. List of 41 Acrocomia aculeata families assessed in the macaúba active germplasm bank (BAG-Macauba) ... 30
Table 2. List of SSR primer sequences used to amplify the target microsatellite loci in the cross amplification. ... 32
Table 3. Characteristics of 15 SSR markers identified from Astrocarym aculeatum (Ramos et al., 2012) and Elaeis oleifera (Zaki et al., 2012), which showed amplification in Acrocomia aculeata accessions and three SSR markers screened from sets of markers developed for A. aculeata (Nucci, 2007). ... 36
Table 4. Locus by provenance table of estimated null allele frequencies (p)a and Hardy-Weinberg deviation test. ... 39
CHAPTER 2
Table 1. List of 41 Acrocomia aculeata families, number of individuals per family, provenance and GPS coordinates of each collection point ... 58
Table 2. Primer pairs of 10 SSR markers used in the study and average values obtained for different parameters per locus. ... 63
Table 3. Average estimates of some genetic diversity parameters for Acrocomia aculeata provenances based on ten polymorphic SSR markers. ... 65
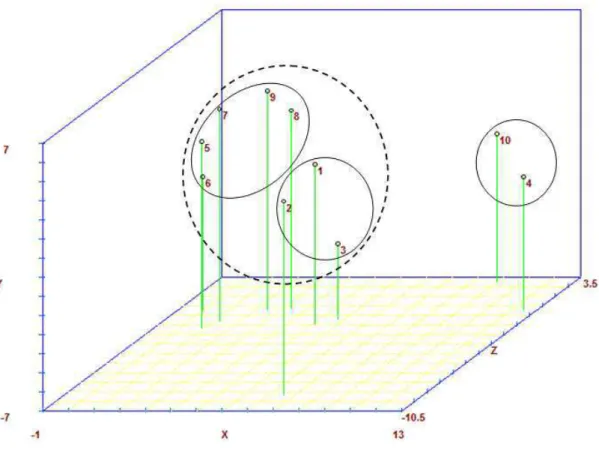
Table 4. Grouping of Acrocomia aculeata provenances using method of Tocher ... 67
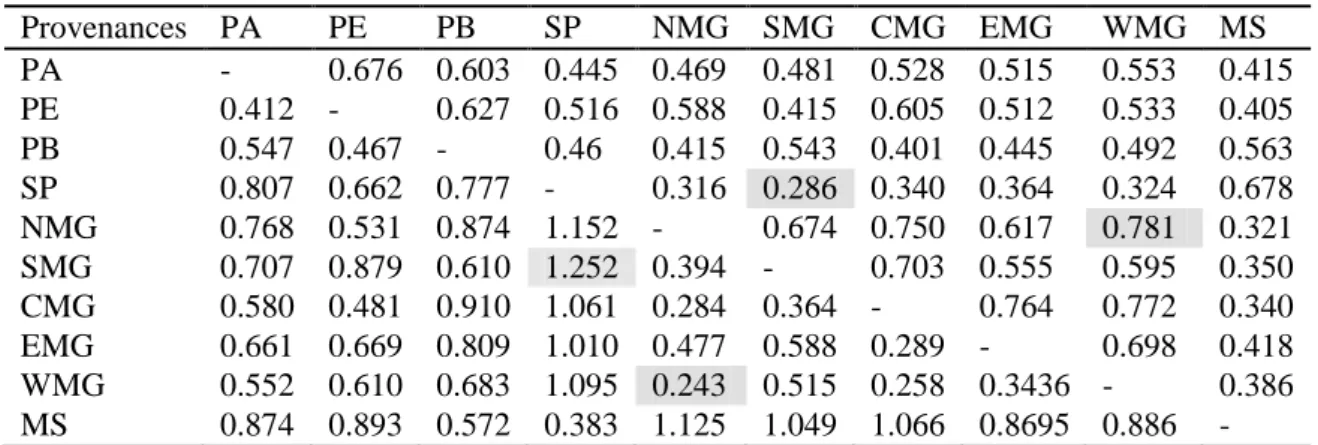
Table 5. Pair wise genetic distance (below diagonal) and genetic identity matrix (above diagonal) between Acrocomia aculeata provenances. ... 68
Table 6. Mean genetic distance among families within each provenance ... 68
Table 7. Grouping of 41 Acrocomia aculeata families using Tocher from genetic distance (Nei, 1972). ... 69
xi RESUMO
MENGISTU, Fekadu Gebretensay, D.Sc., Universidade Federal de Viçosa, julho de 2015. Amplificação cruzada de marcadores microssatélites e estudo da diversidade genética em palmeira macaúba (Acrocomia aculeata). Orientador: Sérgio Yoshimitsu Motoike. Coorientadores: Eveline Teixeira Caixeta e Cosme Damião Cruz.
xiii ABSTRACT
MENGISTU, Fekadu Gebretensay, D.Sc., Universidade Federal de Viçosa, July, 2015. Cross-species amplification of microsatellite markers and genetic diversity in the macaw palm (Acrocomia aculeata). Adviser: Sérgio Yoshimitsu Motoike. Co-advisers: Eveline Teixeira Caixeta and Cosme Damião Cruz.
1 GENERAL INTRODUCTION
Macaúba or also known as Macaw palm (Acrocomia aculeata (Jack.) Lodd. Ex.Mart.) is a perennial arborescent palm tree, native to tropical forests, mainly in South America with wide geographical distribution in Brazil (Scariot et al., 1995). It stands out among the promising oil palms for biodiesel production. It has possibility of becoming commercially the most important oil palm in the Brazilian context, highlighting not only by its considerable oleaginous potential, but also for being species native to Brazil, which occur in large natural mass in much of the national territory (Silva, 1994). This specie has broad utility and more recently its fruit has aroused great social and economic interest in its vegetable oil production capacity, considering that macaúba is cited as one of the main sources of oil in Brazil (Nucci et al., 2008). The oil extracted from macaúba fruits has been used in cosmetic industries, medicinal uses, oil and flour used in food and, most recently as feedstock for biodiesel production (Bora and Rocha, 2004; Hiane et al., 2005).
2 stages of pre-breeding of this palm and the bases for future development of suitable varieties. To quantify the genetic variability between and within populations, the use of molecular markers has proved to be important and efficient tools. For this study, microsatellite markers were chosen for their intrinsic characteristics of stable marker, co-dominant, multiallelic, robust, high reliability, the operational simplicity and speed of analysis when compared to other methods (Mohan et al., 1997; Agarwal et al., 2008). Since macaúba is a newly emerging species, only few molecular markers such as microsatellites are currently available. Therefore, in our study, we did a cross-species transferability of some polymorphic microsatellite markers from related palm species in Arecaceae family (Astrocaryum aculeatum and Elaies oleifera) as an alternative to select some working markers for A. aculeata. Cross-species amplification and transferability studies reveal the capabilities of SSR markers to cross amplify homologous sites among related species and genera in Arecaceae. Ramos et al. (2012) and Zaki et al. (2012) reported cross-amplification and transferability of SSR markers from A. aculeatum and E. oleifera, respectively in several species of Arecaceae. A. aculeatum knows as Tucumã of Amazonas is a tropical palm found in western and central Brazilian Amazonia. The raw fruit is traditionally eaten by the local population and edible oil can be pressed from the fruits for human consumption as well as the dried cake residue is used as animal feed (Ramos et al., 2012). Whereas E. oleifera is a species in the oil palm genus along with the commercial Elaeis guineensis and occurs naturally in south-central America and in the Amazon (Teh, 2010). E. oleifera has been a promising genetic resource for oil palm improvement and currently used in oil palm hybrid breeding programs (Zaki et al., 2012).
3 collections of A. aculeata using microsatellite markers including from the previsouly developed sets of SSR for macaúba.
Hence, the specific objectives were:
a) to evaluate the cross-amplification and transferability of some microsatellite markers sourced from Tucumã (A. aculeatum) and south America oil palm (E. oleifera), in accessions of A. aculeata;
b) to characterize the identified polymorphic microsatellite markers using different parameters in accessions of A. aculeata; and
4 REFERENCES
Agarwal M, Shivastava N and Padh H (2008) Advances in molecular marker techniques and their applications in plant sciences. Plant Cell Reports 27: 617-631.
Bora PS and Rocha RVM (2004) Macaíba palm: fatty and amino acids composition of fruits. Cienc. Tecnol. Aliment. 4: 158–162.
Faleiro FG, Costa AM, Karia CT, Andrade RP et al. (2008) Molecular markers and geographic information systems as a tool to study native plant species in the Brasilian Savannas. Available at http://www.cpac.embrapa.br.
Hiane PA, Ramos-Filho, MM, Ramos MIL and Macedo MLR (2005) Bocaiúva, Acrocomia aculeata (Jacq.) Lodd., pulp and kernel oils: characterization and fatty acid composition. Brazilian Journal of Food Technology 8: 256–259.
Mohan M, Nair S, Bhagwat A, Krishna TG et al. (1997) Genome mapping, molecular markers and marker-assisted selection in crop plants. Molecular Breeding 3: 87-103.
Nucci SM, Azevedo-Filho A, Colomo AC, Priolli GHR, Coelho MR, Mata TL and Zucchi IM (2008) Development and characterization of microsatellites markers from the macaw. Molecular Ecology Resources 8: 224–226.
Ramos SF, Vasconcelos de Macêdo JL, Lopes MTG, Batista JS et al. (2012) Microsatellite Loci for Tucumã of Amazonas (Astrocaryum aculeatum) and amplification in other Arecaceae. American Journal of Botany 508-510. doi:10.3732/ajb.1100607.
Scariot AO, Lleras E and Hay JD (1995) Flowering and fruiting phenologies of the palm Acrocomia aculeata: patterns and consequences. Biotropica 27:168-173.
5 Teh CK (2010) Genetic Diversity of Central and South American Wild Oil Palm (Elaies oleifera) Populations Using Microsatellite Markers. M.Sc. Thesis. Universiti Kebangsaan Malaysia, Kuala Lumpur, Malaysia.
6 LITERATURE REVIEW
1. BOTANY AND TAXONOMICAL DESCRIPTION
Acrocomia aculeata has a wide popular synonym in Brazil: macaúba, mucajá, mocujá, mocajá, macaw, macaiúva, bacaiúva, bocaiúva, imbocaiá, coco-de-phlegm or coco-de-spinho (Lorenzi, 1992). It was formely under family Palmae, is currently classified within the Arecaceae family and genus Acrocomia (Henderson et al., 1995). Taxonomically, A. aculeata is classified under: Kingdom: Plantae; Division: Magnoliophyta; Class: Liliopsida; Subclass: Arecidae; Order: Arecales; Family: Arecaceae; Subfamily: Arecoideae; Tribe: Cocoeae; Subtribe: Bactridinae; Genre: Acrocomia and species: Acrocomia aculeata (Grin, 2013).
According to cytogenetic studies in fifty species of twenty eight genera of palms, including some species in the subfamily Arecoideae, different numbers of chromosomes was found (Sharma and Sarkar, 1956). However, there is a general homogeneity and uniformity of clearly marked chromosomes within each subfamily, and all species are diploid. They consider the subfamily Arecoideae as a good example of evolutionary stability, in which in six different species of different genres, the same number of chromosomes (2n= 2x = 32) and an overall similarity in karyotypes were found. However, Read (1966) did new chromosome count in Palmae (Arecaceae), which divides the subfamily Arecoideae into two species: species with n = 15, which include A. aculeata and species with n = 16.
7 These species are mainly in tropical distribution, but have worldwide occurrence. The number of genera could reach to 236 and 3400 species (Aguiar, 1988; Lorenzi et al., 2004).
The term Acrocomia is Greece origin to describe the arrangement of the leaves in the plant. "Akron" (top) and "Kome" (hair) suggesting that the leaves are arranged in the shape of a crown (Novaes, 1952; Henderson et al., 1995). Due to the co-existence of one or more Acrocomia species, there is high variability of A. aculeata in natural stands as well as in germplasm banks. However, there still exists limitation of well established descriptors or phylogenetic reports available to distinguish between the species. However, efforts have been made to study the morphological structure of A. aculeata, which believe to be of a species widely and abundantly distributed in Brazil and becoming center of several researches due to its high fruit productivity and oil quality for biodiesel production. The morphological reports described here are based on some researches done in the past and could be used as reference to at least have some detail until the species is domesticated and detail reports are available.
A. aculeata is represented by arborescent palms and it is evergreen whose stem can reach up to 15 m in height with 20 to 30 cm in diameter. Most plants have long dark spines along the trunk and the base of the leaf sheaths. The leaves are pinnate presenting 4 to 5 m long, usually 20 to 30 in numbers, dark green color and contemporary distributed in different planes giving a feathery appearance to the crown. The leaflets are approximately 130 in number on each side of the central region of the leaf sheath and are covered with spines (Lorenzi, 1992).
8 flowering in A. aculeata occurs between August and December and inflorescences are androgynous with marked protogyny. The principal pollinators are mainly beetles:
Andranthobius sp. (Coleoptera:Curculionidae), Mystrops cf Mexicana (Nitidulidae) and
Cyclocephala forsteri (Scarabaeidae), with wind playing a secondary role. Cross-pollination between different individuals (xenogamy) accounts for most of the reproductive system. However, the species is self-compatible with geitonogamy accounting for a significant percentage of fruit set (Scariot et al, 1991).
Each inflorescence produces an average of 60 fruits, but this number can vary from 0 to 271, according to the region (Scariot et al., 1995). Fruiting could occur throughout the year, especially from September to January (Scariot et al., 1991; Lorenzi, 1992; Lorenzi, 1996; Silva et al., 2001; Nucci, 2007). A macaw palm can produce 3 to 6 bunches per year with an average of 800 fruits per cluster, ensuring the dispersion of the plant. The fruit is composed of 42% pulp (mesocarp); 20% epicarp (shell) and the remainder is formed by diaspore of the fruits consisting of endocarp (31%) and seeds (7%). The fruits are spherical or slightly flattened, shaped in globose drupe with a diameter ranging from 2 to 5 cm, and form one to three seeds or embyos. The epicarp is thin and easily broken up when mature. The mesocarp is fibrous, mucilaginous, sweet tasting, rich in glycerides, yellow or yellow-brownish coloring (Chuba et al., 2008; Ramos et al., 2008).
2. GEOGRAPHICAL DISTRIBUTION AND ECOLOGY
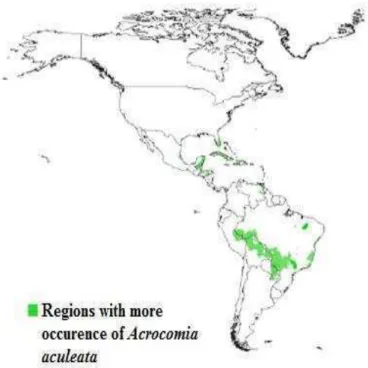
9 Santa Catarina and Rio Grande do Sul. Its distribution area has been heavily influenced by human activities. In Brazil, the palm greater dispersion was with the occurrence of natural stands of this species in almost every territory and widely spread and used by Cerrado people (Silva, 1994; Henderson et al., 1995).
Figure 1. Geographical distribution of Acrocomia aculeata in South America (Adopted from Nucci (2007); original source: New World Fruits (2014)).
According to Scariot et al. (1991, 1995), A. aculeata is cited as the single tree-sized species in pasture areas and occurs mainly in semi-deciduous broadleaved forests (Lorenzi, 1992). This palm has adaptations in different environmental conditions. It was described as mesotrophic soils indicator of central Brazil (Ratter et al., 1996). However, there are reports showing in the state of São Paulo, it mainly occurs in poor soils covered by savannah (Novaes, 1952).
3. AGRICULTURAL PRACTICES AND USES
10 However, if managed properly, in arable lands, it can boost integral agricultural productivity as it can grow mutually with other crop plants and provides spaces for livestock grazing (Averdunk et al., 2013). A. aculeata is cited as one of main sources of vegetable oil in Brazil, which has the potential to produce biodiesel. Macaúba can yield up to 4000 liters of vegetable oil/ha/year, which is high as compared to that of commonly cultivated annual crops such as soybeans which produces only 420 liters, sunflower 890 liters and even castor only 1320 liter/ha/year (Cesar, 2003). Besides, from the solid waste, products such as charcoal and animal feeds could be obtained as by-products (Oliveira, 2006).
In addition the pulp of the fruit is consumed fresh or used for edible oil extraction, and products such as candy, and beverages are prepared out of it. Other parts of the palm such as straws to make crafts and construction of houses by the traditional people, the pulp and seeds are used as food and ingredients for paints and the trunks for their traditional logs. Besides, several species of wild animals feed on its leaves, fruits of pulp and seeds. The core of the stem gets a nutritious starch and the leaves and fodder provide textile fibers for making nets and fishing lines (Lorenzi, 1992).
Besides, A. aculeata has been identified as important palm tree from natural, economical and ecological point of view with the advantage to grow with little water and strive in drought prone and degraded areas (Lima et al., 2003). A. aculeata offers further advantages over agricultural crops that occupy today prominent position in Brazil in biodiesel production, such as soybean and palm oil. Hence, with regard to manpower, it creates more job opportunities which require manual work during harvest and it can provide family and small producers an alternative source of income (Holanda, 2004).
11 genetic resources are vital. It has fundamental importance for sustainable exploitation and conservation of its genetic variability present in its germplasm collections, given the lack of studies on the species.
4. GENETIC DIVERSITY IN PLANTS
Genetic diversity is the measure of genetic variability within and among a given population through different ways such as identifying alleles, the number of individuals and type of genotypes being heterozygous as well as homozygous in different proportions or different amount (Weir, 1996). Agricultural scientists realized that plant genetic diversity can be captured and stored in the form of plant genetic resources such as gene bank, DNA library, and so forth, in the bio-repository which preserve genetic material for long period. However, conserved plant genetic resources must be utilized for crop improvement in order to meet future global challenges in relation to food and nutritional security (Govindaraj et al., 2015).
12 generations, there is total absence of migration, mutation, selection and genetic drift. Through this principle it is possible to calculate the frequency of genotypes from the frequencies of the alleles.
There are ranges of tools utilized to study diversity in plants; which mainly include morphological, biochemical and molecular tools. Each tool has its own advantages and disadvantages. However, molecular markers are highly preferable and reliable tools to study polymorphism (or genetic diversity) among and within populations.
5. MOLECULAR MARKERS
According Matioli and Passos-Bueno (2001), genetic variability is very important tool for researchers in their studies when they wish to verify affinities and boundaries between species, detect modes of reproduction and population structure, estimate migration and dispersion levels in populations and even to help identify the remains of endangered species.
Through the use of molecular markers, advanced techniques have been employed in research allowing researchers to achieve greater efficiency in genetic diversity studies. In the molecular analysis technologies, DNA variability determines reference points on chromosomes, technically termed as "molecular markers". The revolution in this plan began with the discovery and use of isozymes from the year 1959, vastly expanding the number of genetic markers and enabling application of the technique virtually in all plant species (Ferreira and Grattapaglia, 1998).
13 the environment, pleiotropic and epistatic effects (Semagn et al., 2006). However, molecular marker techniques differ from each other with respect to important features such as genomic abundance, level of polymorphism, locus specificity, reproducibility, technical requirements and cost (Agarwal et al., 2008).
5.1 Microsatellite (SSR) markers
Microsatellites are the choice for most studies in evolution, ecology and conservation, due to their high levels of polymorphism, high reproducibility, co-dominant nature and genome and locus-specificity (Powell et al., 1996; Pinheiro et al., 2009). Microsatellites (Litt and Luty, 1989), also known as simple sequence repeats (SSRs; Tautz et al., 1986), short tandem repeats (STRs) or simple sequence length polymorphisms (SSLPs; Mcdonald and Potts, 1997), are the smallest class of simple repetitive DNA sequences. They are 2–8 bp (Armour et al., 1999); 1–6 bp (Goldstein and Pollock, 1997) or 1–5 bp (Schlotterer, 1998) repeats. SSRs are born from regions in which variants of simple repetitive DNA sequence motifs are already over represented (Tautz et al., 1986). The repeated sequence is often simple, consisting of two, three or four nucleotides (di-, tri-, and tetranucleotide repeats, respectively). The total number of repeats usually ranges between 10 and 100; and these markers often present high levels of polymorphism, particularly when tandem repeats number is ten or greater (Queller et al., 1993). SSR allelic differences are, therefore, the results of variable numbers of repeat units within the microsatellite structure and provide highly polymorphic banding patterns, which are often generated by PCR amplification of unique loci using discriminatory primers sets (Farooq and Azam, 2002).
14 desirable because they are often co-dominant, highly reproducible, frequent in most eukaryotes, and reveal high allelic diversity (Mohan et al., 1997; Agarwal et al., 2008).
In macaúba, limited number of works has been conducted in the past since it was recognized as potential species only in recent years. Although, a dominant marker (RAPD) was used to study genetic diversity in macaúba populations (Oliveira et al., 2012), after the development of microsatellite markers by Nucci et al. (2008), more number of studies have been initiated and being realized in macaúba such as population structure and genetic diversity. However, the number of polymorphic SSR markers developed and characterized for macaúba is limited. Only eight SSRs have been characterized (Nucci et al., 2008) from an enriched genomic library containing a total of 77 sets of microsatellites (Nucci, 2007). In the characterization, the results demonstrated that the markers are promising in future population genetic studies to obtain information that will help to understand the evolutionary dynamics of the species and design conservation and breeding strategies. Nucci et al. (2008) reported genetic drift in most of the populations studied as a result of factors such as clearing of natural forests due to extractivism, climate change and land use policy, which lead to a recommendation of ex situ conservation ensuring use of its genetic resources for future breeding programs.
5.2 Development of microsatellite markers and transferability among species
15 positive clones for microsatellite are obtained from this procedure, the DNA is sequenced and PCR primers are chosen from sequences flanking such regions to determine a specific locus. This process involves significant trial and error on the part of researchers, as microsatellite repeat sequences must be predicted and primers that are randomly isolated may not display polymorphism (Queller et al., 1993; Jarne and Lagoda, 1996).
The next step is to select the best candidate markers and then to optimize conditions for their amplification. Optimization of microsatellite systems involves a more or less comprehensive survey of PCR conditions for amplification of candidate loci. This is done to adequately balance the often conflicting requirements for high specificity and high intensity of amplification products of microsatellite loci which are more common in some organisms than in others and screening may produce few useful loci in some species (Cooper, 1995). The efficiency of microsatellite marker development depends on the abundance of repeats in the target species and the ease with which these repeats can be developed into informative markers. When researchers are isolating plant microsatellites, about 30% of the sequenced clones, on average, can be lost due to the absence of unique microsatellites. Of those sequences that contain unique microsatellites, a number of the clones in a library can contain identical sequences (and hence there is a level of redundancy) and/or chimeric sequences (i.e., one of the flanking regions matches that of another clone). Hence, at each stage of SSR development, there is the potential to ‘lose’ loci, and hence the number of loci that will
16 sequences in their genomes. The recovery rate for useful SSR primers is generally low due to different reasons: such as the primer may not amplify any PCR product; the primer may produce very complex, weak or nonspecific amplification patterns; and the amplification product may not be polymorphic.
SSRs are now the marker of choice in most areas of molecular genetics as they are highly polymorphic even between closely related lines, require low amount of DNA, can be easily automated for high throughput screening, can be exchanged between laboratories, and are highly transferable between populations (Gupta et al., 1999). The major constraint of using SSR markers from genomic libraries is the high development cost and effort required to obtain working primers for a given study species. This has restricted their use to only a few of the agriculturally important crops. A new alternative source of SSRs development from expressed sequence tag (EST) databases has been utilized (Kota et al., 2001; Kantety et al., 2002; Michalek et al., 2002). With the availability of large numbers of ESTs and other DNA sequence data, development of EST-based SSR markers through data mining has become a fast, efficient, and relatively inexpensive compared with the development of genomic SSRs (Gupta et al., 2003). This is due to the fact that the time-consuming and expensive processes of generating genomic libraries and sequencing of large numbers of clones for finding the SSR containing DNA regions are not needed in this approach (Eujayl et al., 2004). However, the development of EST-SSRs is limited to species for which this type of database exists. Furthermore, the EST-SSR markers have been reported to have lower rate of polymorphism compared to the SSR markers derived from genomic libraries (Cho et al., 2000; Scott et al., 2000; Eujayl et al., 2002; Chabane et al., 2005).
17 establishment cost of genomic library is high and EST is limited, cross-species amplification or transferability of SSR markers can be used as an alternative means for short term solutions. Closely related species are more likely to share SSR priming sites than more distantly related ones. Close to 90% of species/ primer combinations tested within subgenera were successful; a much higher rate than between genera attempts (just over 35%). It was reported also that when priming sites did transfer across species, the rate of polymorphism was still relatively high, even between evolutionary distant species (Rossetto, 2001).
Research on species relationships has increasingly focused on assessing the ability of SSR primers to amplify the same loci across different species and genera (Smulders et al., 1997; Steinkellner et al., 1997; Witsenboer et al., 1997). Besides, molecular ecologists increasingly require universal markers that can be readily transferred between species which facilitate comparisons among closely related taxa for addressing the mechanisms involved in population divergence and speciation (Barbará et al., 2007). However, there is a challenge that the distribution of cross-species transferability is highly uneven across taxa, being greater in animals and highly variable in flowering plants (Barbará et al., 2007).
18 7. REFERENCES
Agarwal M, Shivastava N and Padh H (2008) Advances in molecular marker techniques and their applications in plant sciences. Plant Cell Reports 27: 617-631.
Aguiar FFA (1988) Caracterização morfológica das principais espécies de palmeiras exóticas na cidade de São paulo. Dissertação Mesterado, Escola Superior de Agricultura Luiz de Queiroz, Piracicaba.
Amsellem LC, Dutech and Billotte N (2001) Isolation and characterization of polymorphic microsatellite loci in Rubus alceifolius Poir (Rosaceae), an invasive weed in La Reunion island. Molecular Ecology Notes 1: 33-35.
Armour JAL, Alegre SA, Miles S, Williams LJ and Badge RM (1999) Minisatellites and mutation processes in tandemly repetitive DNA. In: Goldstein DB, Schlotterer C (ed.) Microsatellites: evolution and applications. Oxford, pp. 24–33.
Ashley MV, Wilk JA, Styan SMN, Craft JK, et al. (2003) High variability and disomic segregation of microsatellites in the octoploid Fragaria virginiana Mill (Rosaceae). Theoretical and Appllied Genetics 107: 1201-1207.
Averdunk K, Zelt T, Golka P, Höpfner M, Müller C and Bettermann I (2013) Macauba –Sustainable Palm Oil, Results of the Feasibility Study of the Leuphana University of Lüneburg‐ Executive Summary. Available at http://www.leuphana.de.
Barbará T, Palma-Silva C, Paggi GM, Bered F, Fay MF and Lexer C (2007) Cross-species transfer of nuclear microsatellite markers: Potential and limitations. Molecular
Ecology 16: 3759–3767.
Cesar E (2003) Biodiesel no tanque. Pesquisa Fapesp, 94 ed., São Paulo.
Chabane K, Ablett GA, Cordeiro GM, Valkoun J and Henry RJ (2005) EST versus genomic derived microsatellite markers for genotyping wild and cultivated barley.
19 Cho YG, Ishii T, Temnykh S, Chen X, Lipovich L, McCouch SR, Parl WD, Ayers N and Cartinhour S (2000) Diversity of microsatellites derived from genomic libraries and GenBank sequences in rice (Oryza sativa L.). Theoretical and Applied Genetics 100:713–722.
Chuba CAM, Tommaselli MAG, Santos WL and Sanjinez-Argandoña EJ (2008) Parâmetros biométricos dos cachos e frutos da bocaiuva. In: Congresso Brasileiro de Fruticultura, Vitória.
Cooper G (1995) Analysis of genetic variation and sperm competition in Dragon flies. D.Phil.Thesis, Oxford University.
Eujayl I, Sledge MK, Wang L, May GD, Chekhovskiy K, Zwonitzer JC an Mian MAR (2004) Medicago truncatula EST-SSRs reveal crossspecies genetic markers for Medicago spp. Theoretical and Applied Genetics 108:414–422.
Eujayl I, Sorrells ME, Wolters P, Baum M and Powell W (2002) Isolation of EST-derived microsatellite markers for genotyping the A and B genomes of wheat.
Theoretical and Applied Genetics 104:399–407.
Farooq S and Zam F (2002) Molecular Markers in Plant Breeding-I: Concepts and Characterization. Pakistan Journal of Biological Sciences 5: 1135-1140.
Ferreira ME and Grattapaglia D (1998) Introducción al Uso de Marcadores moleculares en el Análisis Genético. Brasilia: EMBRAPA-CENARGEN, p. 220..
Goldstein DB and Pollock DD (1997) Launching microsatellites: a review of mutation processes and methods of phylogenetic inference. Joural of Hered 88: 335–342.
20 Govindaraj M, Vetriventhan, M and Srinivasan (2015) Importance of Genetic Diversity Assessment in Crop Plants and Its Recent Advances: An Overview of Its Analytical
Perspectives. Genetics Research International Doi:
http://dx.doi.org/10.1155/2015/431487.
Gupta PK, Rustgi S, Sharma S, Sing R, Kumar N and Balyan HS (2003) Transferable EST-SSR markers for the study of polymorphism and genetic diversity in bread wheat.
MolecularGenetics and Genomics 270: 315–323.
Gupta PK, Varshney RK, Sharma PC and Ramesh B (1999) Molecular markers and their applications in wheat breeding. Plant Breeding 118:369–390.
Henderson A, Galeano G and Bernal R (1995) Field guide to palms of the Americas, New Jersey: Princepton University, pp. 166-167.
Hamrick JL (1982) Plant population genetics and evolution. American Journal of Botany 69 1685-1693.
Holanda A (2004) Biodiesel e a Inclusão Social. Brasília: Câmara dos Deputados, Coordenação de Publicações, Brasilia, p. 200.
Jarne P and Lagoda P (1996) Microsatellites, from molecules to populations and back.
Trends in Ecology and Evolution 11: 424–429.
Kantety RV, Rota ML, Matthews DE and Sorrells ME (2002) Data mining for simple-sequence repeats in expressed simple-sequence tags from barley, maize, rice, sorghum, and wheat. Plant Molecular Biology 48:501–510.
Kota R, Varshney RK, Thiel T, Dehmer KJ and Graner A (2001) Generation and comparison of EST-derived SSRs and SNPs in barley (Hordeum vulgare L.). Hereditas 135:145–151.
21 Litt M and Luty JM (1989) A hypervariable microsatellite revealed by in vitro amplification of a dinucleotide repeat within the cardiac muscle actin gene. American
Journal of Human Genetics 44: 397–401.
Lorenzi H (1992) Árvores brasileiras: manual de identificação e cultivo de plantas arbóreas nativas do Brasil. Nova Odessa, São Paulo, Plantarum.
Lorenzi H (1996) Palmeiras do Brasil: exóticas e nativas. Nova Odessa: Editora Plantarum, pp. 1-20.
Lorenzi H (2004) Palmeiras Brasileiras e exóticas cultivadas, Instituto Plantarum, p. 1-20.
Matiolo SR and Passos-Bueno MRS (2001) Métodos baseados em PCR para análise de polimorfismos de ácidos nucléicos. In: Matioli SR.(ed). Biologia Molecular e Evolução. Ribeirão Preto: Holos, pp. 153-161.
Mcdonald DB, Potts WK (1997) DNA microsatellites as genetic markers for several scales. In: Mindell DP (ed.) Avian molecular evolution and systematics. San Diego, pp. 29–49.
Michalek V, Weschke W, Pleisner KP and Graner A (2002) EST analysis in barley defines a unigene set comprising 4000 genes. Theoretical and Applied Genetics 104: 97–103.
Morcote-Rios G and Bernal R (2001) Remains of palms (Palmae) at archaeological sites in the New Word: a review. The Botanical Review, 67: 309-350.
Nei M (1978) Estimation of average heterozygosity and genetic distances from a small number of individuals. Genetics 89: 583–590.
New World Fruits −Database. Available at http://www.ipgri.cgiar.org on 06/07/2014.
22 Nucci SM, Azevedo-Filho A, Colomo AC, Priolli GHR, Coelho MR, Mata TL and Zucchi IM (2008) Development and characterization of microsatellites markers from the macaw. Molecular Ecology Resources 8: 224–226.
Nucci SM (2007) Development, characterization and analyses of the use of microsatellite markers in macaw palm population genetics. MSc. Thesis, University of Sâo Paulo.
Oliveira DA, Júnior-Melo AF, Brandão MM, Rodrigues LA, Menezes EV and Ferreira PRB (2012) Genetic diversity in populations of Acrocomia aculeata (Arecaceae) in the northern region of Minas Gerais. Genetics and Molecular Research 11: 531–538.
Oliveira FAM (2006) A produção de óleos vegetais de macaúba e seus co-produtos na região metropolitana de Belo Horizonte. In: 3º Congresso Brasileiro de Plantas Oleaginosas, óleos, Gorduras e Biodiesel, Varginha.
Pfeiffer A, Olivieri AM, Morgante M (1997) Identification and characterization of microsatellites in Norway spruce (Picea abies K.). Genome 40:411–419.
Pinheiro F, Palma-Silva C, Barros F and Cozzolino S (2009) Cross-amplification and
characterization of microsatellite loci for the Neotropical orchid genus Epidendrum.
Genetics and Molecular Biology 32: 337–339.
Pinto LR (2001) Análise da estrutura genética das populações de milho (Zea mays L.) BR-105 e BR-106 e respectivos sintéticos IG-3 e IG-4 por meio de microssátelites. Tese Doutorado, Escola Superior de Agricultura “Luiz de Queiroz”, Universidade de São Paulo.
Powell W, Morgante M, Andre C, Hanafey M, Vogel J, Tingey S and Rafalski A (1996) The comparison of RFLP, RAPD, AFLP and SSR (microsatellite) markers for germplasm analysis. Moleculur Breeding 2: 225–238.
23 Ramos MIL, Ramos Filho MM, Hiane PA, Braga Neto, JA, Siqueira EMA (2008) Qualidade nutricional da polpa de bocaiúva Acrocomia aculeata(Jacq.) Lodd. Ciência e Tecnologia de alimentos 28: 90-94.
Ratter JA, Bridgewater S, Atkinson R and Ribeiro JF (1996) Analysis of the floristic composition of the Brazilian cerrado vegetation. Edinburgh Journal of Botany 53: 153-180.
Read RW (1966) New chromosome counts in the Palmae. Principles 10: 55-61.
Roa AC, Chavarriaga-Aquire P, Dugue MC, Maya MM, Bonierbale MW, Iglesias C and Tohme JM (2000) Cross species-amplification of cassava (Manihot esculenta) (Euphorbiaceae) microsatellites: allelic polymorphism and degree of relationships.
American Journal of Botany 87: 1647–1655.
Rosetto M (2001) Sourcing of SSR markers from related plant species. In: Henry RG (ed.) Plant Genotyping: The DNA finger printing of plants. New York. CAB International, pp. 211–224.
Scariot AO, Lleras E and Hay JD (1991) Reproductive biology of the palm Acrocomia
aculeata in Central Brazil. Biotropica 23: 12–22.
Scariot AO, Lleras E and Hay JD (1995) Flowering and fruiting phenologies of the palm Acrocomia aculeata: patterns and consequences. Biotropica 27: 168-173.
Schlotterer C (1998) Microsatellites. In: Hoelzel AR (ed) Molecular genetic analysis of
populations: A practical approach. Oxford, pp. 237–261.
Semagn K, Bjørnstad Å and Ndjiondjop MN (2006) A review on an overview of molecular marker methods for plants. African Journal of Biotechnology 5: 2540-2568.
Sharma AK, Sarkar SK (1956) Cytology of different species of palms and its bearing on the solution of the problems of phylogeny and speciation. Genetica 28: 361–488.
24 Silva JC (1994) Macaúba: fonte de matéria-prima para os setores alimentício, energético e industrial. Trabalho de conclusão da disciplina Cultivo de essências exóticas e nativas. Departamento de Engenharia Florestal, Universidade Federal de Viçosa.
Smulders MJM, Bredemeijer G, Rus-Kortekass W, Arens P and Vosman B (1997) Use of short microsatellites from database sequences to generate polymorphisms among Lycopersicon esculentum cultivars and accessions of other Lycopersicon species.
Theoretical and Applied Genetics 97: 264–272.
Song QJ, Fickus EW and Cregan P (2002) Characterization of trinucleotide SSR motifs in wheat. Theoretical and Applied Genetics 104:286–293.
Squirrell J, Hollingsworth PM, Woodhead M, Russell J, Lowe AJ, Gibby M and Powell W (2003) How much effort is required to isolate nuclear microsatellites from plants?
Molecular Ecology 12:1339–1348.
Steinkellner H, Lexer C,Turetschek E and Glossl J (1997) Conservation of (GA)n microsatellite between Quercus species. Molecular Ecology 6:1189–1194.
Tautz D, Trick M and Dover GA (1986) Cryptic simplicity in DNA is a major source of genetic variation. Nature 322: 652−656.
25 CHAPTER 1
1
CROSS-SPECIES AMPLIFICATION AND CHARACTERIZATION OF NEW MICROSATELLITE MARKERS FOR THE MACAW PALM, Acrocomia aculeata (Arecaceae).
ABSTRACT
Microsatellites (Simple Sequence Repeats−SSRs) are useful molecular markers allowing for efficient conservation and sustainable use of genetic resources of plant species. Development of SSR marker system for new species is a very expensive task and time consuming. Cross-species amplification of microsatellite loci is considered as a cost-effective approach for developing microsatellite markers for new species. The aim of this work was to examine the transferability of some SSR markers of two Arecaceae species (Astrocaryum aculeatum and Elaeis oleifera), in Acrocomia aculeata. A total of 34 SSR markers (14 from A. aculeatum and 20 from E. oleifera) were evaluated for the trsnaferability using 192 A. aculeata individuals. Fifteen (44%) of the markers successfully amplified the genomic DNA in A. aculeata, of which 4 (26%) were polymorphic detecting a range of 3 to 8 alleles with an average of 4.5 per locus. High average percentage of polymorphic loci (P = 71.2%) per provenance was obtained within a range of 57–100% detecting genetic variation in A. aculeata germplasm collections. The polymorphic markers detected a positive inbreeding coefficient (F > 0) per locus revealing heterozygote deficiency in the accessions that were analysed. As the cross-amplification was at family level, in which the taxonomic distance is relatively wider between the sources (A. aculeatum and E. oleifera) and the target (A. aculeata) species, the amplification success was relatively low. However, the results are promising and implicated that high cross-amplification success could be achieved at species or genus level in A. aculeata. The markers will contribute towards the domestication of the potential macaw palm through realizing various studies such as population genetics, germplasm characterization, genetic improvement and conservation.
Key words: biodiesel; domestication; macauba; null alleles; SSRs; transferability
1 Published online in Journal of Plant Genetic Resource (PGR)- Characterization and utilization (doi:
26
AMPLIFICAÇÃO CRUZADA E CARACTERIZAÇÃO DE NOVOS
MARCADORES MICROSSATÉLITES PARA A MACAÚBA, Acrocomia aculeata (Arecaceae).
RESUMO
Os microssatélites (Simple Sequence Repeats−SSR) são marcadores moleculares úteis que auxiliam na conservação eficiente e uso sustentável dos recursos genéticos das espécies de plantas. No entanto o desenvolvimento de marcadores SSR para uma nova espécie é uma tarefa demorada e muito dispendiosa. A amplificação cruzada de locos SSR é considerada uma alternativa para o desenvolvimento de desses marcadores para novas espécies. O objetivo deste trabalho foi avaliar a possibilidade de transferência de alguns marcadores SSR de duas espécies de Arecaceae (Astrocaryum aculeatum e Elaies oleifera), em Acrocomia aculeata. Um total de 34 marcadores SSR (14 de A. aculeatum e 20 de E. oleifera) foram avaliados na transferência usando 192 acessos de A. aculeata. Do total de marcadores analisados, 15 (44%) amplificaram com sucesso o DNA genómico de A. aculeata, dos quais 4 (26%) foram polimórficos e produziram de 3 a 8 alelos, com uma média de 4,5 por loco. Alta média de percentagem de locos polimórficos (P = 71,2%) por procediência foi obtido dentro de um intervalo de 57 a 100%, detectando uma variação genética na coleção de germoplasma de A. aculeata. Os marcadores polimórficos detectaram um coeficiente de endogamia positivo (F > 0) por loco, mostrando deficiência de heterozigose nos acessos que foram analisados. Como a amplificação cruzada foi em nível da família, em que a distância taxonômica é relativamente elevada entre as espécies-fonte (A. aculeatum e E. oleifera) e a espécie-alvo (A. aculeata), o sucesso de amplificação foi relativamente baixa. No entanto, os resultados são promissores e implica que uma alta taxa de sucesso em amplificação cruzada poderia ser alcançada em nível de gênero ou espécie de Acrocomia. Os marcadores apresentados contribuirão para a domesticação da macaúba através da viabilização de vários estudos, tais como genética de populações, caracterização de germoplasma, melhoramento genético e conservação.
27 1. INTRODUCTION
Microsatellites (Simple Sequence Repeats, SSRs) are the choice of many studies because of their high levels of polymorphism, reproducibility, co-dominant nature and genome and locus-specificity (Powell et al., 1996; Pinheiro et al., 2009).
The high transfer rate of SSRs between related species is an advantage to save a large portion of development time and costs (Barbará et al., 2007). Hence, sourcing of SSR primers from related species could be a cost-effective alternative to develop
primers especially for new species where abundant sequence data is not available (Kantety et al., 2002) and resources for developing new SSR primers are limited (Roa et al., 2000; Pinheiro et al., 2009).
The Macaw palm, A. aculeata (Jacq.) (Lodd. ex Mart.)−Arecaceae (2n=2x=30) (Abreu et al., 2011), is an emerging perennial palm native to South America. It is monoecious and self-compatible with androgynous inflorescence, which bears a mixed reproductive system, with a predominance of out-crossing (Scariot et al., 1991; Abreu et al., 2012). The combination of two pollination strategies (entomophily and anemophily) with flexible reproductive systems (cross- and self-pollination) suggests that A. aculeata can be highly successful in the colonization of new areas, as evidenced by its ample distribution in Brazilian biomes and in the rest of the Neotropics (Scariot et al., 1991).
drought-28 prevailing areas (Motoike and Kuki, 2009). Hence, A. aculeata is a suitable option for production of biodiesel among the common food-based oleaginous plants such as soybean, sunflower and oil palms (Teixeira, 2005).
However, A. aculeata has risks of predatory extractivism in natural populations, unsustainable land use and climate change which potentially threaten its natural genetic diversity (Faleiro et al., 2008; Ribeiro et al., 2011). Our study focused on the development of new microsatellite markers for A. aculeata sourcing SSRs from related palm species to contribute for the conservation of genetic resources of this noble palm.
Therefore, this study was carried out to evaluate the transferability of some SSR markers from Astrocaryum aculeatum and Elaeis oleifera to A. aculeata. It was also performed to identify and characterize some polymorphic SSR markers from sets of markers previously developed for A. aculeata.
2. MATERIALS AND METHODS
2.1 Plant material and DNA isolation
Leaf samples of 192 A. aculeata germplasm accessions were obtained from the
ex situ plant collection, Macaúba Active Germplasm Bank (BAG – Macaúba
29 Figure 1. Map of Brazil showing the six geographical States, where the original plant materials were collected. The States include Pará; Pernambuco; Paraiba; São Paulo; Minas Gerais and Mato Grosso do Sul. Araponga is a city in Minas Gerais State, where the germplasm bank is located in which the experimental plant materials were obtained.
30 Table 1. List of 41 Acrocomia aculeata families assessed in the macaúba active germplasm bank (BAG-Macauba)
a
States include: PA=Pará, PE=Pernambuco, PB=Paraiba, SP=São Paulo, MG=Minas Gerais and MS=Mato Grosso do Sul.
b
Coordinates are in degrees, minutes and seconds for both the latitude (S=South) and longitude (W=West). No. Family code State/
Provenancea
Coordinatesb No. Family code State/ Provenancea
Coordinatesb
Latitude Longitude Latitude Longitude
31
2.2 Condition of Polymerase Chain Reaction (PCR) and electrophoresis
The PCR was performed in a 20 µL total reaction volume containing 30 ng of A. aculeata genomic DNA; 1xPCR buffer; 250 µM of each dNTPs; 0.15 µM of forward and reverse primer; 3 mM of MgCl2; and 1 U of Taq DNA polymerase (Nucci et al.,
2008). Some modifications were made by increasing the concentration of MgCl2 to 4
mM for markers Aac04 and Aac12 for better amplification (Table 2). Totally, 20 SSR markers, which were originally developed for E. oleifera (Zaki et al., 2012), 14 SSR markers developed for A. aculeatum (Ramos et al., 2012) and three identified from A. auleata (Nucci, 2007) were used in the reactions (Table 2).
The amplification cycles were carried out on a PCR thermal cycler (Applied Biosystem®Verti®cycler, Thermo Fisher Scientific Brand, USA) programmed as follows: initial denaturation step at 94oC for 5 min followed by 30 cycles of denaturation at 94oC for 1 min; annealing at primer-specific annealing temperature for 1 min (Table 2); extension at 72oC for 1 min and the final extension at 72oC for 8 min (Nucci et al., 2008). PCR products were denatured in a bromophenol blue dye solution at 95oC for 5 min in the thermal cycler immediately before electrophoresis on 6% polyacrylamide gel in 1XTBE (Tris-Borate-EDTA) buffer solution at 60W for 1 hr and 40 min.
2.3 Polyacrylamide gel staining
After electrophoresis, the PCR products were visualized in polyacrylamide gels stained with silver nitrate (AgNO3) according to Brito et al. (2010). The gels were
32 Table 2. List of SSR primer sequences used to amplify the target microsatellite loci in the cross amplification.
a
1, Ramos et al. (2012); 2, Zaki et al. (2012); 3, Nucci (2007); Ta= annealing temperature
Locus Forward primer (5´-3´) Reverse primer (5´-3´) Repeat motif Accession name Ta (
o
C) Sourcea
Aac04 F: GCATTGTCATCTGCAACCAC R: GCAGGGGCCATAAGTCATAA (GT)7(GA)16 GF111930 60 1
Aac08 F: CGCACGTACACACACACACAT R: GCAGGGGCCATAAGTCATAA (CA)11 GF111934 57 1
Aac10 F: AGCCGTGAGTGAACTGCTTT R: AAGCCCAAACTTCTTCCTCG (CT)7 GF111936 60 1
Aac11 F: AAAGGAACAACCCAAGAGGG R: TGGGGAGTGGACGTAAGTGT (AC)5 GF111937 60 1
Aac12 F: GCTCTGTAATCTCGGCTTCCT R: TCCAGTTCAAGCTCTCTCAGC (GC)5(AC)3 GF111938 60 1
Aac13 F: CTAGACAACCCAAGAGAGGGG R: TTGGAGAGTGGATGTAGGTGC (CA)7 GF111939 60 1
sMo00020 F: CCTTTCTCTCCCTCTCCTTTTG R: CCTCCCTCCCTCTCACCATA (AG)15 Pr009947964 58 2
sMo00027 F: TTACAGTTGAGGCAGTATGTCAAT R: CTGTATGTCAAACCTTCTGCAC (TC)14 Pr009947965 50 2
sMo00055 F: GGCATTTCAGATAACGACAAA R: GCACCCAAGTCTCTCTACCTC (GA)11 Pr010315684 54 2
sMo00130 F: TAAGCAAAAGATCAGGGCACTC R: GCTGGTGAAAATAGGTTTACAAAG (AAG)11 Pr009947968 56 2
sMo00137 F: AGGAAGGAGAAGGAGATGAACAG R: CTTTGGATTTGAGCAGAGGAAG (AAAT)6 Pr010315687 54 2
sMo00018 F: TTAAATGAGAGAGAGACGAGGAC R: TGGAGCCATGAGAAAGAGTA (CT)14 Pr009947963 54 2
sMo00141 F: ACTTGACATACAGGTTCCACTGA R: CCTGCTACCTCCTAATTCTATCAAA (TTCTT)5 Pr010317029 56 2
sMo00147 F: TACCCAATCCCACCGAGTTA R: CGTCTCCACTGAACCACAAAA (AAAAG)5 Pr010317030 54 2
sMo00161 F: ACTGTTTCGTCAAGCATTTG R: ATCAAGAGAAGGTCGTGTCAG (TG)8(AG)8 Pr010317032 54 2
Aacu38 F: TTCTCAGTTTCGTGCGTGAG R: GGGAGGCATGAGGAATACAA (TC)15 − 56 3
Aacu45 F: CAGACTACCAGGCTTCCAGC R: TCATCATCGCAGCTTGACTC (CGAC)5 − 56 3
33 2.4 Data analyses
Co-dominant data were analyzed using the GENES statistical software program (Cruz, 2013) to estimate allelic diversity, heterozygosity and polymorphism level of the SSR markers. The number of alleles per locus (A) was determined by quantifying the number of different alleles amplified by each marker analyzed with 192 individuals. The total number of alleles per provenance (Nt) was determined by summing the
number of alleles amplified by each locus (A). Hence, the average number of alleles per provenance (Na) was calculated from the total number of alleles detected in the
provenances by the loci that were analyzed (Cruz et al., 2011). Effective numbers of alleles (Ne), which are used to make sampling in successive generations of a given
population, were determined by quantifying the number of alleles amplified by the polymorphic loci out of the total number of loci analyzed with a criterion that alleles have a frequency of < 0.95 (Cole, 2003).
The heterozygosity level of each locus was determined. Expected heterozygosity (HE) per locus was estimated from the frequency of alleles detected per locus; while
observed heterozygosity (Ho) was determined by calculating the number of
heterozygotes observed out of the total number of individuals analyzed (Nei, 1978). HE
and Ho were used to estimate the inbreeding coefficient (F) per locus to determine
whether there are excess (or any deficiency) of heterozygotes per locus (Hartl and Clark, 1997).
34 on a criterion when a locus with most common alleles has a frequency of less than 0.95 (Cole, 2003).
The null allele test was performed to check for evidence of null alleles detected by the loci using the FreeNA (Chapuis and Estoup, 2007) computer program based on the Expectation Maximization (EM) algorithm as described in Dempster et al. (1977), which estimated the null allele frequency (p) for each locus across the provenances analyzed. A test for deviations from Hardy-Weinberg Equilibrium (HWE) was performed for each locus across the provenances at a significance level of α=0.05 in GENEPOP (Raymond and Rousset, 1995).
3. RESULTS
3.1 Cross-Amplification and Polymorphism
In the cross-amplification, 15 of the total SSR markers (44%) from A. aculeatum and E. oleifera successfully produced amplicons, and were able to amplify the gDNA in A. aculeata (Table 3). However, only four (26%) of the markers were polymorphic and they detected a range of three to eight alleles with average of 4.5 per locus (Table 3). Besides, three new polymorphic SSR markers were identified from sets of SSR markers previously designed for A. aculeata. Hence, a total of 38 alleles were amplified by the seven polymorphic SSR markers with average of 5.4 per locus (Table 3).
Alleles amplified by the polymorphic loci were detected in the six provenances at different proportions from 14 (36.8 %) to 32 (84.2 %) (Table 3). Out of the total number of alleles, a range of 2.4 to 6.8 effective numbers of alleles (Ne) with average of
35 (sMo00137) to 0.61 (Aac04) with average of 0.20 per locus, while expected heterozygosity (HE)ranged from 0.09 (sMo00020) to 0.72 (Aac04) with average of 0.39
36
Table 3. Characteristics of 15 SSR markers identified from Astrocarym aculeatum (Ramos et al., 2012) and Elaeis oleifera (Zaki et al., 2012), which
showed amplification in Acrocomia aculeata accessions and three SSR markers screened from sets of markers developed for A. aculeata (Nucci, 2007).
A, number of alleles per locus; Ho, observed heterozygosity; HE, expected heterozygosity; F, inbreeding coefficient; PIC, polymorphic information content; Nt, total number
of alleles over polymorphic loci and provenance (numbers in brackets are percentages); Na, average number of alleles per polymorphic loci and per provenance; Ne, effective
number of alleles per provenance; P, percentage of polymorphic loci in brackets (numbers outside brackets are numbers of polymorphic loci); Provenances: PA=Pará, PE=Pernambuco, PB=Paraiba, SP=São Paulo, MG=Minas Gerais, MS=Mato Grosso do Sul. a Rows refer to the polymorphic loci.
Number of alleles amplified per provenance
Locus Amplicon (bp) A PA PE PB SP MG MS Ho HE F PIC
Aac04a 258-306 8 4 5 4 7 7 6 0.61 0.72 0.15 0.68
Aac08 428 1 1 1 1 1 1 1 - - - -
Aac10 134 1 1 1 1 1 1 1 - - - -
Aac11 302 1 1 1 1 1 1 1 - - - -
Aac12a 229-247 4 2 1 2 3 2 3 0.06 0.31 0.81 0.27
Aac13 355 1 1 1 1 1 1 1 - -
sMo00020a 242-250 3 1 1 1 3 2 3 0.03 0.09 0.67 0.08
sMo00027 293 1 1 1 1 1 1 1 - - - -
sMo00055 273 1 1 1 1 1 1 1 - - - -
sMo00130 276 1 1 1 1 1 1 1 - - - -
sMo00137a 179-187 3 1 1 1 2 2 2 0.01 0.11 0.91 0.09
sMo00138 305 1 1 1 1 1 1 1 - - - -
sMo00141 441 1 1 1 1 1 1 1 - - - -
sMo00147 310 1 1 1 1 1 1 1 - - - -
sMo00161 221 1 1 1 1 1 1 1 - - - -
Aacu38a 316-346 6 4 2 2 4 6 6 0.13 0.64 0.80 0.58
Aacu45a 260-284 5 4 2 2 2 5 4 0.30 0.38 0.21 0.34
Aacu74a 278-313 9 1 2 2 6 8 6 0.26 0.45 0.42 0.42
Nt 38 17(44.7) 14(36.8) 14(36.8) 27(71.1) 32(84.2) 30(78.9) - - - -
Na 5.4 2.4 2.0 2.0 3.9 4.7 4.3 - - - -
Ne - 3.5 2.8 2.4 4.2 6.8 4.3 - - - -
P - 3.99(57) 3.99(57) 4.97(71) 5.95(85) 3.99(57) 7(100) - - - -
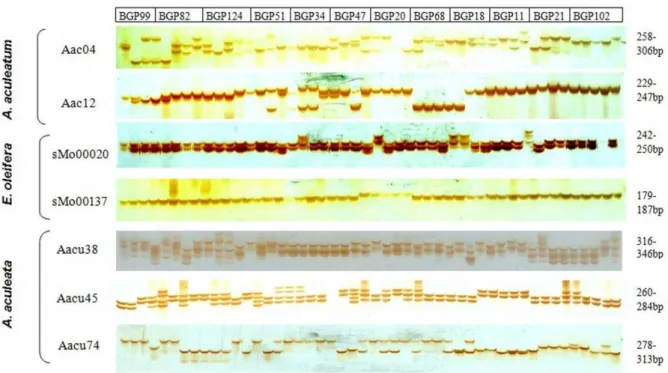
37 The polymorphism and heterozygosity levels of the seven polymorphic SSR markers that amplified the target microsatellite loci in A. aculeata were depicted in a figure (Figure 2). This figure demonstrated the allelic profiles of the loci amplified on 12 selected families of A. aculeata containing 48 accessions from the six provenances and elucidated the capability of the markers to distinguish between heterozygote and homozygote individuals in A. aculeata.
Figure 2. Allelic profiles showing cross-species amplifications of seven SSR loci on Acrocomia aculeata accessions. Loci include Aac04 and Aac12 (Astrocarym aculeatum); sMo00020 and sMo00137 (Elaies oleifera); and Aacu38, Aacu45 and Aacu74 (Acrocomia aculeata). The amplification is on 48 selected A. aculeata accessions of twelve families. BGP99 (Pará); BGP82 (Pernambuco); BGP124 (Paraiba); BGP51, BGP34 and BGP47 (São Paulo); BGP20, BGP68, BGP18, BGP11 and BGP21 (Minas Gerais) and BGP102 (Mato Grosso do Sul). Allele amplicon size (bp) indicated for each locus.
39 Table 4. Locus by provenance table of estimated null allele frequencies (p)a and Hardy-Weinberg deviation test.
PA=Pará; PE=Pernambuco; PB=Paraiba; SP=São Paulo; MG=Minas Gerais; MS=Mato Grosso do Sul; ns=not significant. *significant deviation from HWE at α=0.05. a Frequency estimates (p) were based on the EM algorithm as described in the study by Dempster et al. (1977).
bNo information (−) generated for
loci with less than two alleles at the corresponding provenances. Locus
PA PE PB SP MG MS
p HW p HW P HW p HW p HW p HW
Aacu45 0.000 0.619ns 0.000 1.000ns 0.290 0.030* 0.000 0.142ns 0.129 0.000* 0.148 0.000* Aacu38 0.419 0.000* 0.326 0.000* 0.290 0.000* 0.290 0.000* 0.307 0.000* 0.258 0.000* Aacu74b − − 0.000 0.123ns 0.290 0.142ns 0.210 0.440ns 0.611 0.000* 0.409 0.000* Aac04 0.000 0.840ns 0.000 0.213ns 0.000 0.370ns 0.194 0.860ns 0.172 0.000* 0.101 0.000*
Aac12b 0.326 0.010* − − 0.290 0.040* 0.638 0.000* 0.056 0.025* 0.206 0.000*
sMo00137b − − − − − − 0.816 0.000* 0.991 0.000* 0.935 0.000*
40 4. DISCUSSION
The cross-amplification showed the ability of the polymorphic SSR markers to amplify the target microsatellite sequences in A. aculeata. The low percentage of the cross-amplification (26%) however could be attributed to the relatively wider taxonomic distance between the sources (A. aculeatum and E. oleifera) and the target (A. aculeata) species analyzed in the study, since all the species are from different genera (Baker et al., 2010). Nevertheless, when we look at the taxonomic relatedness between the species, both A. aculeatum and A. aculeata belong to the same sub-tribe (Bactridinae) and hence, in our investigation, provided a relatively higher percentage of cross-amplification (33%) as compared with E. oleifera (22%) (Table 3), which belongs to a different sub-tribe (Elaeidinae) (Baker et al., 2010).