Proteome, Interactome and Diseases for Mammalian
Mitochondria
Jiabin Wang., Jian Yang., Song Mao, Xiaoqiang Chai, Yuling Hu, Xugang Hou, Yiheng Tang, Cheng Bi,
Xiao Li*
College of Life Sciences, Sichuan University, Ministry of Education Key Laboratory for Bio-resource and Eco-environment, Sichuan Key Laboratory of Molecular Biology and Biotechnology, Chengdu, People’s Republic of China
Abstract
Mitochondrion plays a central role in diverse biological processes in most eukaryotes, and its dysfunctions are critically involved in a large number of diseases and the aging process. A systematic identification of mitochondrial proteomes and characterization of functional linkages among mitochondrial proteins are fundamental in understanding the mechanisms underlying biological functions and human diseases associated with mitochondria. Here we present a database MitProNet which provides a comprehensive knowledgebase for mitochondrial proteome, interactome and human diseases. First an inventory of mammalian mitochondrial proteins was compiled by widely collecting proteomic datasets, and the proteins were classified by machine learning to achieve a high-confidence list of mitochondrial proteins. The current version of MitProNet covers 1124 high-confidence proteins, and the remainders were further classified as middle- or low-confidence. An organelle-specific network of functional linkages among mitochondrial proteins was then generated by integrating genomic features encoded by a wide range of datasets including genomic context, gene expression profiles, protein-protein interactions, functional similarity and metabolic pathways. The functional-linkage network should be a valuable resource for the study of biological functions of mitochondrial proteins and human mitochondrial diseases. Furthermore, we utilized the network to predict candidate genes for mitochondrial diseases using prioritization algorithms. All proteins, functional linkages and disease candidate genes in MitProNet were annotated according to the information collected from their original sources including GO, GEO, OMIM, KEGG, MIPS, HPRD and so on. MitProNet features a user-friendly graphic visualization interface to present functional analysis of linkage networks. As an up-to-date database and analysis platform, MitProNet should be particularly helpful in comprehensive studies of complicated biological mechanisms underlying mitochondrial functions and human mitochondrial diseases. MitProNet is freely accessible at http://bio.scu.edu.cn:8085/ MitProNet.
Citation:Wang J, Yang J, Mao S, Chai X, Hu Y, et al. (2014) MitProNet: A Knowledgebase and Analysis Platform of Proteome, Interactome and Diseases for Mammalian Mitochondria. PLoS ONE 9(10): e111187. doi:10.1371/journal.pone.0111187
Editor:Miguel A. Andrade-Navarro, Johannes-Gutenberg University of Mainz, Germany
ReceivedMarch 4, 2014;AcceptedSeptember 26, 2014;PublishedOctober 27, 2014
Copyright:ß2014 Wang et al. This is an open-access article distributed under the terms of the Creative Commons Attribution License, which permits unrestricted use, distribution, and reproduction in any medium, provided the original author and source are credited.
Funding:This work was supported partially by National Natural Science Foundation of China (Grant No. 61001149) and the National Science and Technology Major Project of the Ministry of Science and Technology of China (Grant No. 2012ZX10005001-010). The funders had no role in study design, data collection and analysis, decision to publish, or preparation of the manuscript.
Competing Interests:The authors have declared that no competing interests exist.
* Email: [email protected]
.These authors contributed equally to this work.
Introduction
Almost all eukaryotic organisms possess mitochondria as their essential cellular components that function as the center of energy production, metabolism, signaling, apoptosis and cell growth [1]. Mitochondrial dysfunctions are known to be associated with a broad spectrum of metabolic and age-related diseases in humans, including diabetes mellitus, several cancer types, cardiovascular disorders, and neurodegenerative diseases such as Alzheimer’s and Parkinson’s disease [2–6]. Since these mitochondria-related diseases are caused by multigenic factors and have complex clinical phenotypes, they still remain to be poorly understood and difficult to develop medical therapy. In mammals, it is estimated that the mitochondrion is composed of about 1500 distinct proteins, the vast majority of which (above 99%) are
nuclear-encoded except for thirteen polypeptides of the respiratory chain that are encoded in the mitochondrial genome (mtDNA) [7,8].
developed to store the mitochondrial protein data that were curated manually from the biochemical literatures or collected from the large-scale proteomic studies. Among these, some performed the bioinformatics methods to improve the confidence and the coverage of mitochondrial proteomes [14].
Despite these significant successes in identifying mitochondrial proteins, the high complexity of the current data sets coupled with the tissue and development heterogeneity of mitochondrial proteins [15] are a major challenge to their use in understanding of the mammalian mitochondrial proteome and discovering susceptible genes in complex mitochondrial diseases. Firstly, a lack of common standards hinders us from defining the comprehensive and accurate mitochondrial proteome. By com-bining various experimental datasets from the proteomic studies, an integrative analysis showed that about 7300 proteins were identified as mitochondrial, which significantly excesses the estimated size of the mammalian mitochondrial proteome. The large number of proteins reveals the presence of false discovery in large-scale proteomic studies. This is mainly due to the purified mitochondria are often contaminated by other non-mitochondrial organelles such as microsomes and cytoskeletons whose proteins are falsely identified as mitochondrial [7]. Secondly, with the rapidly increasing number of newly discovered mitochondrial proteins, a critical task beyond protein identification is to annotate cellular functions for newly-identified mitochondrial proteins and to associate their functional roles with human mitochondrial disorders. The investigation [14] on MitoCarta which may represent the largest comprehensive compendium of mammalian mitochondrial proteins to date indicated that about a quarter of proteins in the inventory were not annotated to a biological process in terms of Gene Ontology (GO) annotation [16]. If we expand to the whole mitochondrial proteome, a greater number of mitochondrial proteins will remain to be uncharacterized.
With the increase in the availability of genomic and proteomic data, computational approaches have been proposed for inferring the biological function of mitochondrial proteins, prioritizing and predicting candidate genes susceptible to mitochondrial disorders. Many computational approaches follow the idea termed ‘guilt-by-association’ that the function of one protein could be transferred from another protein with known function relying on their biological relationship [17]. The large-scale genomic and proteo-mic datasets allow us to measure quantitatively the biological relationship between two genes, including gene expression profiling, protein-protein interactions, phylogenetic profiling, and synthetic genetic analysis and so on. For example, using phylogenetic profiling analysis across hundreds of species, Pagliarini et al. identified 19 novel factors that are involved in the assembly of complex I of the mitochondrial respiratory chain [14]. More recently, the biological relationships among a set of genes/proteins can be represented as a network such as gene co-expression network, transcription regulation network and protein interaction network, which provides us a global perspective of understanding mitochondrial biology and disease at a systems level [18–20]. Nevertheless, most of those studies on mitochondria used only individual data source or data type, which led to insufficient coverage of the mitochondrial proteome and thus potentially limited their predictive ability.
A reasonable alternative would be to utilize the functional linkage network (FLN) integrated from heterogeneous datasets generated from successful efforts on larger scale assembly. The integration of complementary knowledge from heterogeneous sources is essential to understand the system as a whole and obtain well populated networks. Comparing with the networks derived from individual data type, the FLNs are denser and less biased
towards a kind of particular evidence. Many successes have been achieved in predicting gene functions and prioritizing disease genes through utilizing the FLN-based scheme. Although several FLN databases have been distributed, such as STRING [21], Reactome [22] and BioGRID [23], there are very few FLN databases that are designed specifically for mitochondria.
To address the issue of single data set or type, Franke et al. [24] constructed a functional linkage network (FLN) by integrating multiple types of genome-wide data, and utilized the FLN for disease gene prioritization. However, it is speculated that the performance of this FLN was highly dependent on Gene Ontology (GO) annotations, and as a result, the predictions tended to be biased towards well-characterized genes, and thus limit capacity on inferences. In another study, Linghu et al. [25] integrated multiple genome-wide features to construct an evidence-weighted FLN, and used a neighborhood-weighting decision rule for disease gene prioritization successfully. Nevertheless, while specialized in mitochondrion, a specific FLN among proteins in this organelle using a combination of multiple types of data focusing its message exclusively on functional associations among mitochondrial proteins, would deliver superior performance. To date, only two databases specialized for mitochondrial protein interactions are public available, Mitointeractome [26] and InterMitoBase [27]. Mitointeractome is a representative interaction database for mitochondria which includes predicted protein-protein interac-tions (PPIs) based on structural and homologous information. InterMitoBase contains well-annotated PPIs between mitochon-drial and mitochonmitochon-drial/non-mitochonmitochon-drial proteins integrated from a wide range of resources. However, the both of databases cover only PPI information, which is not sufficient for character-izing functional associations among mitochondrial proteins. Therefore, it is necessary to construct a database covering the entire FLN that characterizes the global functional associations among mitochondrial proteins.
In this study, we performed a machine-learning classifier to integrate mitochondrial proteins from 23 proteomic datasets for compiling an inventory of mammalian mitochondrial proteins. Comparing with other datasets, the list of mitochondrial proteins comprising 1124 proteins reveals a larger coverage and better accuracy. A mitochondria-specific FLN was constructed by integrating 15 heterogeneous genomic and proteomic datasets, resulting in 32,951 weighted functional linkages among 1072 mitochondrial proteins. Furthermore, the mitochondria-specific FLN was utilized to identify and prioritize candidate genes for typical mitochondrial diseases. The results show the inventory of mitochondrial proteins and the FLN among mitochondrial proteins should be valuable resources in comprehensive studies of complicated biological mechanisms underlying mitochondrial functions and human mitochondrial diseases.
Results and Discussion
General procedure
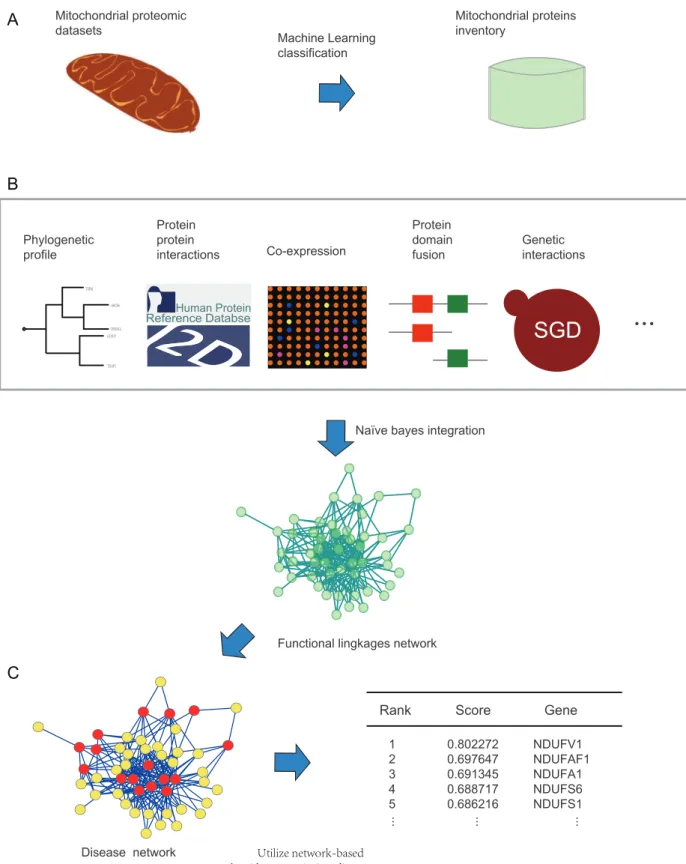
Figure 1. A flowchart depicting the work.(A) Step 1: obtaining a mitochondrial proteins inventory utilizing machine learning classification. (B) Step 2: constructing the FLN by integrating 11 genomic features including protein-protein interaction, domain-domain interaction, shared domains, genomic context, genetic interaction, phenotypic semantic similarity, co-expression, GO semantic similarity, protein expression profiles, disease involvement and operon based on the Naı¨ve bayes model. (C) Step 3: ranking the disease candidate genes utilizing the FLN and a network-based algorithm. The table on the right shows the ranking scores of the top 5 candidate genes for mitochondrial complex I deficiency.
An inventory of mammalian mitochondrial proteins Although Pagliarini et al. presented the most comprehensive mammalian mitochondrial proteome (the MitoCarta database) with nearly 1100 proteins and estimated that their compendium covers more than 85% of the mitochondrial proteome [14], Meisingeret al.speculated that they may underestimate the size of the mammalian mitochondrial proteome and that the total number of mammalian genes for mitochondrial proteins could approach 1500 [28]. Considering the limitation of the databases, as a first step, we needed to compile an inventory of mammalian mitochondrial proteins that covers as many proteins as possible in the organelle. Thus, we made an extensive collection of mammalian mitochondrial proteins identified experimentally.
Despite various proteomics-scale experiments successfully iden-tified mitochondrial proteins, a combined experimental datasets from these proteomic studies showed that about 7300 proteins were identified as mitochondrial proteins, which significantly exceeded the estimated size of the mammalian mitochondrial proteome. The large number of proteins reveals the presence of false discovery in large-scale proteomic studies. The previous investigation revealed that there is a high conservation among mammalian mitochondrial proteomes [8], hence it is a comple-ment to compile a comprehensive inventory of mitochondrial proteins by integrating the proteomic datasets from a wide range of mammalian mitochondria. Here we collected 23 proteomic datasets from three model mammals including human (H. sapiens), mouse (M. musculus) and rat (R. norvegicus) for the integration (Table 1). To reduce false discovery, moreover, we
performed a machine-learning classifier to integrate mitochondrial proteins.
We used weka, a software that collecting a set of machine learning algorithms for data mining tasks [51], to integrate mitochondrial proteomic datasets. As a first step of machine learning, a gold standard positive (GSP) set and gold standard negative (GSN) set were constructed. Based on the test set, various machine-learning classifiers including AdaBoostM1, Id3, J48, Logistic, MultiClassClassifier, MultilayerPerceptron, NaiveBayes and RandomForest were trained. We assessed the prediction performance by 10-fold cross-validation, showing that the AdaBoostM1 classifier [52] achieved the best, prediction with a high sensitivity of 0.93 (Table S1). The AdaBoost classifier was then applied to identify mitochondrial proteins form 23 proteomic datasets, which resulted in 1109 proteins as positives, 550 of which were the known mitochondrial proteins in the GSP set. There were 15 proteins defined in the GSP were falsely classified as non-mitochondrial proteins. To achieve a comprehensive database of mitochondrial proteins, the high-confidence list was curated manually to include these proteins. As a result, we created an inventory of high-confidence mammalian mitochondrial proteins that includes 1124 mitochondrial proteins (Table S2), which consists of 1109 proteins predicted by the AdaBoostM1 classifier as well as 15 missing proteins from the GSP set. In order to utilize sufficiently the proteomic resources, we further classified the remaining about 6100 proteins as middle-confidence or low-confidence using a simple voting policy. The voting policy was described as follows: a protein was classified as middle-confidence
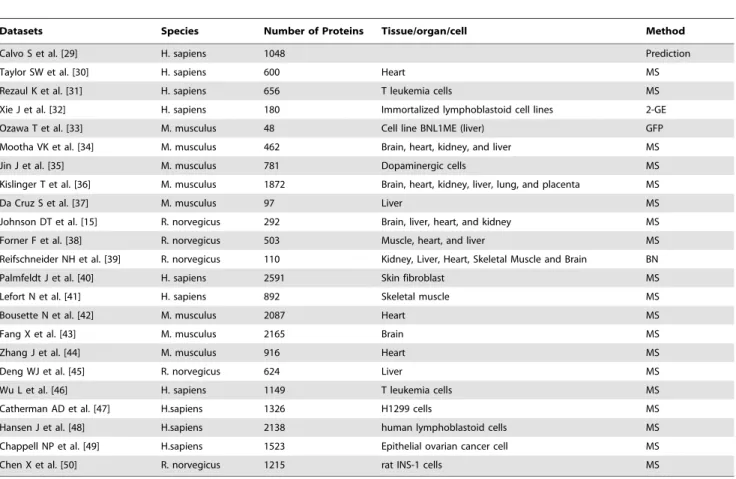
Table 1.Integrated mitochondrial proteomic datasets for an inventory of mammalian mitochondrial proteins.
Datasets Species Number of Proteins Tissue/organ/cell Method
Calvo S et al. [29] H. sapiens 1048 Prediction
Taylor SW et al. [30] H. sapiens 600 Heart MS
Rezaul K et al. [31] H. sapiens 656 T leukemia cells MS
Xie J et al. [32] H. sapiens 180 Immortalized lymphoblastoid cell lines 2-GE
Ozawa T et al. [33] M. musculus 48 Cell line BNL1ME (liver) GFP
Mootha VK et al. [34] M. musculus 462 Brain, heart, kidney, and liver MS
Jin J et al. [35] M. musculus 781 Dopaminergic cells MS
Kislinger T et al. [36] M. musculus 1872 Brain, heart, kidney, liver, lung, and placenta MS
Da Cruz S et al. [37] M. musculus 97 Liver MS
Johnson DT et al. [15] R. norvegicus 292 Brain, liver, heart, and kidney MS
Forner F et al. [38] R. norvegicus 503 Muscle, heart, and liver MS
Reifschneider NH et al. [39] R. norvegicus 110 Kidney, Liver, Heart, Skeletal Muscle and Brain BN
Palmfeldt J et al. [40] H. sapiens 2591 Skin fibroblast MS
Lefort N et al. [41] H. sapiens 892 Skeletal muscle MS
Bousette N et al. [42] M. musculus 2087 Heart MS
Fang X et al. [43] M. musculus 2165 Brain MS
Zhang J et al. [44] M. musculus 916 Heart MS
Deng WJ et al. [45] R. norvegicus 624 Liver MS
Wu L et al. [46] H. sapiens 1149 T leukemia cells MS
Catherman AD et al. [47] H.sapiens 1326 H1299 cells MS
Hansen J et al. [48] H.sapiens 2138 human lymphoblastoid cells MS
Chappell NP et al. [49] H.sapiens 1523 Epithelial ovarian cancer cell MS
Chen X et al. [50] R. norvegicus 1215 rat INS-1 cells MS
if it is included in MitoP2 or MitoCarta dataset, or was identified from more than five proteomic experiments, while the remaining were low-confidence. The high-confidence mitochondrial proteins were strongly supported by the 23 datasets, which may represent the most common proteins in mitochondria. Some other proteins however may intermittently bind to the surface of mitochondria, making it hard to discover by mass spectrometry, thus may fall into the middle-confidence or even low-confidence category. Never-theless, by integrating sufficient datasets from various experimental conditions, the risk for the latter case will drop a lot. Considering the fact that some proteins may expressed under certain circumstances or special tissues, the information for tissue/organ origin of a protein was retained for researchers’ judgments on our web pages. The 1124 high-confidence proteins as well as the 1159 middle-confidence proteins together made up the MitoCom dataset.
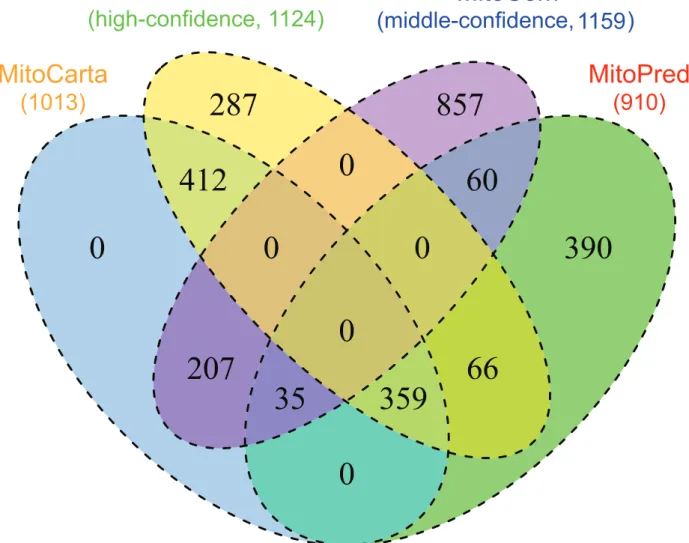
To evaluate the quality of MitoCom, a comparison between MitoCom (high-confidence proteins) and two mitochondrial databases, MitoPred [53] and MitoCarta, was carried out by using the MitoP2 dataset as the reference set. As shown in table 2, the high-confidence proteins in MitoCom showed considerable overlap with MitoPred and MitoCarta, meanwhile it retained a wider coverage, greater sensitivity and lower false discovery rate, which can reduce the ‘‘noise’’ in high-throughput mammalian mitochondrial protein identification effectively. The venn diagram (figure 2) between these three datasets and the middle-confidence proteins showed that the high-confidence proteins had about 74% overlap with MitoCarta and MitoPred, while keeping 288 proteins that identified uniquely by this work. The high-confidence proteins in MitoCom extended the mitochondrial proteome while the middle-confidence proteins can be a clue for a more complete mitochondrial proteome. Thus, our inventory of mammalian mitochondrial proteins would be more comprehensive and accurate in comparison to other databases, which enables it to be a powerful tool for mitochondrial proteome studies.
Functional linkages among mitochondrial proteins With the rapidly increasing number of discovered mitochon-drial proteins, a critical task beyond protein identification is to annotate cellular functions for newly-identified mitochondrial proteins and to associate their functional roles with human mitochondrial disorders. We have pursued these goals by integrating genomic features from heterogeneous data sources to build quantitative functional links among mitochondrial proteins. Since a single data source usually reflects only one type of functional association between proteins (genes), and its coverage is relatively limited, functional associations from multiple data sources should be jointed to achieve larger coverage and better accuracy.
In the previous step, we have built an inventory of 1124 mammalian mitochondrial proteins. This yielded 631688 potential mitochondrial protein-protein functional linkages. To validate
these protein pairs, we systematically combined 11 genomic features about 15 datasets (Table 3) using machine learning algorithm.
The integrated features were shown as follows:
N
Protein-protein interaction (PPI).Protein-protein inter-actions are fundamental to all biological processes. The interacting proteins should have closely functional association.N
Domain-domain interactions. Proteins perform their biological functions often through domains as units. Thus two proteins may have similar function if they contain domains with capability of interacting.N
Shared domains.As well known, domain is the functional unit in protein. Hence, proteins possess the same set of domains should have similar function.N
Genomic context.Genomic context including phylogenetic profiles and Rosetta Stone can be powerful evidence for functional linkages between genes. Gene pair that has similar phylogenetic profile or appears in a gene fusion event tends to be functionally associated [69,70].N
GO Semantic Similarity. Gene ontology defines a gene function with a hierarchical structure in three dimensions including cellular component, molecular function and biolog-ical process. Two genes with terms that share the same parent far from root should be functional associated [24]. Thus, the GO semantic similarity can be used to measure function association between genes.N
Genetic interaction.Genetic interactions, such as synthetic lethal and synthetic growth, infer those involved genes have strong correlation. These correlations are also evidences of functional associations.N
Phenotypic semantic similarity.Genes leading to similar phenotypes should have functional linkages, as similar phenotypes may need similar substances or involve similar processes.N
Gene co-expression. Genes encoding proteins that are involved in the same process are expected to be simultaneously expressed in time and space [71]. Therefore, genes with similar expression patterns should have related function. To profile gene expression, four microarray datasets were selected. GSE1133 and GSE4726 interrogate the expression of the vast majority of protein-encoding human and mouse gene that can give us a global view on gene expression profile at the genome scale, while GSE4330 and GSE6210 studied the influence of mutant in PGC1aand PGC1b, both of which are transcrip-tional coactivator that potently stimulates mitochondrial biogenesis and respiration of cells, focusing on mitochondri-al-specific genes.N
Proteomic profiles.Similar to gene co-expression profile, proteomic profile may lead to better understanding of mitochondrial feature at protein level. Thomas Kislinger etTable 2.Quality comparison of MitoCom with other mitochondrial databases.
Database Number Sensitivity False discovery rate
MitoCom* 1109 97.34% 11.30%
MitoCarta 1013 86.10% 13.70%
MitoPred 910 50.10% 14.80%
al [36] examined the protein content of four organellar compartments in six mouse organs, which could be a valuable resource. We extracted the mitochondrial-specific proteomic profile from this dataset.
N
Diseases involvement. Genes annotated in the same disease tend to have functional associations.N
Operon.Based on the endosymbiotic theory, mitochondrion may evolve from an ancestor ofRickettsia prowazekii, which shares a lot of homological genes with mitochondrial genome [72]. As a functional unit, operon contains a series of genes that involved in same biological process. Therefore, mito-chondrial genes whose homologies appear in the same operon inRickettsia prowazekiishould be an evidence for functional associations.To implement the machine learning algorithm, a GSP and a GSN were first constructed (see materials and methods). Based on the well-defined GSP and GSN, we investigated the coverage of each genomic feature, revealing that several datasets had very low coverage (,20%). Only five datasets including GO semantic similarity, gene co-expression, proteomics profiles and phenotypic semantic similarity covered over 20% on the GSP and GSN (Table S3). For integrating these datasets, we used a naı¨ve Bayes classifier [73,74] owing to its two advantages. First, it can integrate
heterogeneous kinds of evidence and tolerate missing data among them. Second, it is simple but highly efficient to tackle data in a large scale with short time consumption.
As a prerequisite for using naı¨ve Bayes classifier, all the datasets should be conditionally independent. We assessed the statistical independence between each pair of datasets with coverage more than 20% by calculating the PCC. As shown in Table S4, these datasets are relatively independent with the maximum PCC is only 0.217. Following the naı¨ve Bayes theorem, a likelihood ratio (LR) corresponding to a specific biological evidence could be used to measure the predictive power or confidence degree. Thus we measured the power of individual datasets to infer functional linkages by using the naı¨ve Bayes model. Each dataset was divided into several bins, and then the LR for each bin was calculated according to the GSP and the GSN. As shown in Figure S1, all the 15 datasets were clearly correlated with LRs and all the datasets had one or more bins with LR.1, which suggested that the 15 datasets can be used to infer functional linkages between genes.
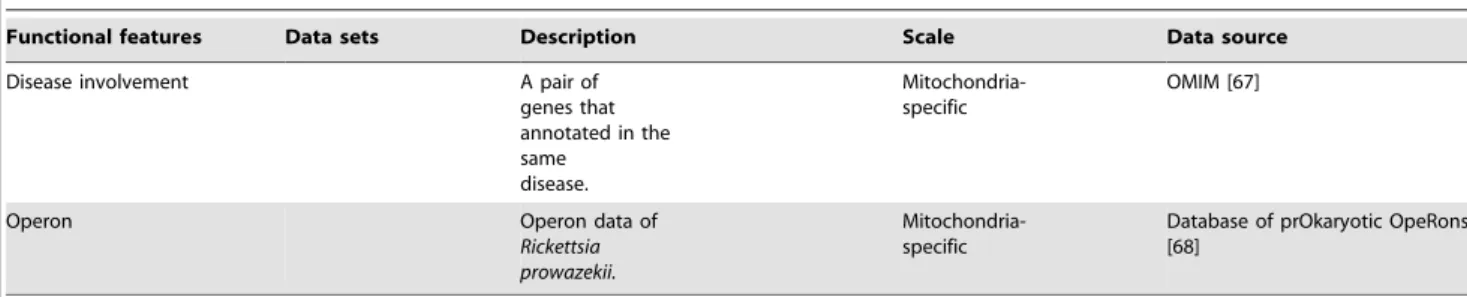
To evaluate the performances of individual dataset model and integrated model, we carried out five-fold cross-validation and drew the receiver operating characteristic (ROC) curve (Fig-ure 3A). The fig(Fig-ure showed that the integrated model had the largest area under ROC curves (AUC), demonstrating the superiority of data integration. The results also suggested that
287
0
857
412
0
0
0
60
0
207
35
359
66
390
0
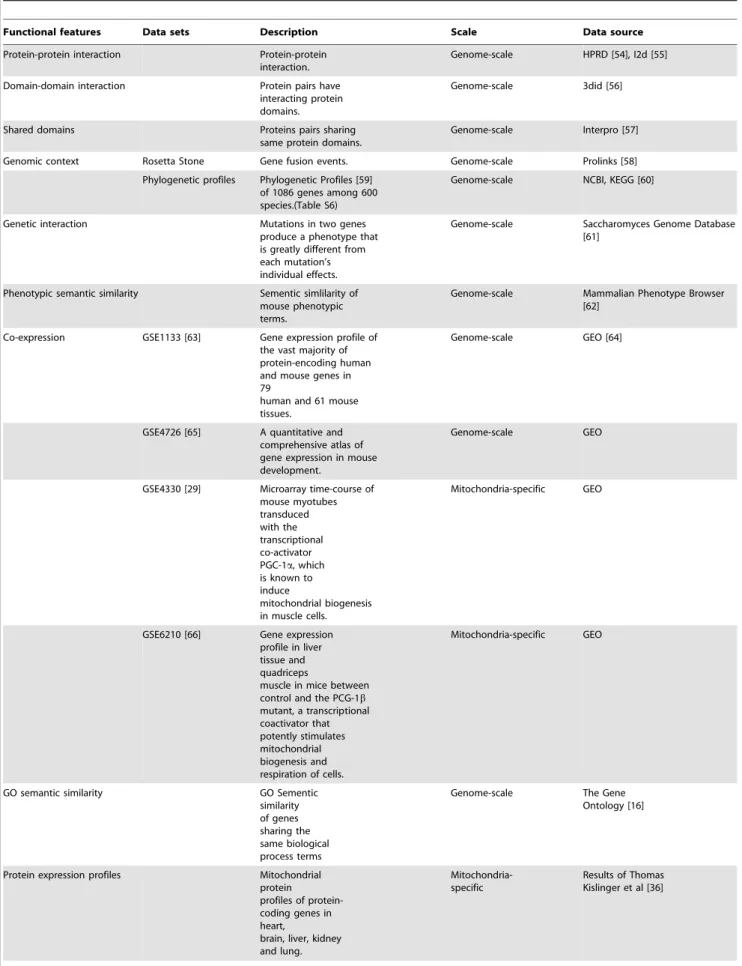
Table 3.Functional features for mammalian mitochondrial FLN construction.
Functional features Data sets Description Scale Data source
Protein-protein interaction Protein-protein interaction.
Genome-scale HPRD [54], I2d [55]
Domain-domain interaction Protein pairs have interacting protein domains.
Genome-scale 3did [56]
Shared domains Proteins pairs sharing
same protein domains.
Genome-scale Interpro [57]
Genomic context Rosetta Stone Gene fusion events. Genome-scale Prolinks [58]
Phylogenetic profiles Phylogenetic Profiles [59] of 1086 genes among 600 species.(Table S6)
Genome-scale NCBI, KEGG [60]
Genetic interaction Mutations in two genes produce a phenotype that is greatly different from each mutation’s individual effects.
Genome-scale Saccharomyces Genome Database [61]
Phenotypic semantic similarity Sementic simlilarity of mouse phenotypic terms.
Genome-scale Mammalian Phenotype Browser [62]
Co-expression GSE1133 [63] Gene expression profile of the vast majority of protein-encoding human and mouse genes in 79
human and 61 mouse tissues.
Genome-scale GEO [64]
GSE4726 [65] A quantitative and comprehensive atlas of gene expression in mouse development.
Genome-scale GEO
GSE4330 [29] Microarray time-course of mouse myotubes transduced with the transcriptional co-activator PGC-1a, which is known to induce
mitochondrial biogenesis in muscle cells.
Mitochondria-specific GEO
GSE6210 [66] Gene expression profile in liver tissue and quadriceps
muscle in mice between control and the PCG-1b
mutant, a transcriptional coactivator that potently stimulates mitochondrial biogenesis and respiration of cells.
Mitochondria-specific GEO
GO semantic similarity GO Sementic
similarity of genes sharing the same biological process terms
Genome-scale The Gene Ontology [16]
Protein expression profiles Mitochondrial protein
profiles of protein-coding genes in heart,
brain, liver, kidney and lung.
Mitochondria-specific
individual data models have limited capability to correctly identify functional linkages between genes. Most of individual dataset models including gene co-expression model and proteomic profile model have similar performances with an AUC around 0.6, much lower than the integrated model. The rest datasets except for the GO semantic similarity model showed no difference to the reference line, indicating their inefficiency. A clear exception was GO semantic similarity model, which had an AUC of 0.772, a little lower than the integrated data. The GSP and GSN were derived from prior knowledge, which will introduce in bias when estimating the GO semantic similarity model that was also derived from prior knowledge. If we use this model to predict novel function linkage, the prediction ability is limited. Therefore, we can conclude that data integrating approach is the best when try to predict novel functional linkages.
Furthermore, we classified the 15 datasets as genomic-scale and mitochondria-specific according to dataset source and data scale. A dataset was considered as mitochondria-specific if the dataset was generated from an experiment was aimed at mitochondrial study, like GSE4330, GSE6210 and proteomic profile, If a dataset
contains information only derived from the mitochondrial proteome, such as diseases involvement, operon and GO semantic similarity, it was also considered as mitochondria-specific. As shown in Figure 3B, the integrated mitochondria-specific model had a larger AUC than the integrated genome-scale model, which indicated that the mitochondria-specific dataset was more powerful to construct FLN.
After data integration, each protein pair has been attached a LR score. A cutoff of LR was determined afterward, which representing as an indicator of whether a protein pair is functional associated (that is, yes if the composite LR is above the LR cutoff, no if not). We used the ratio of true positive (TP) to false positive (FP) to measure the prediction accuracy, and plotted the TP/FP ratio as a function of LR cutoff (Figure 4). We found that there is an apparent positive correlation between the TP/FP ratio and LR cutoff, but the sensitivity decreases monotonically and the FLN scale shrinks simultaneously with the increase of LR cutoff. A composite LR cutoff of 2.5 was selected where the TP/FP ratio was 1, which means that we can achieve 50% prediction accuracy at this resolution. Based on this LR cutoff, the resulting FLN is Table 3.Cont.
Functional features Data sets Description Scale Data source
Disease involvement A pair of
genes that annotated in the same
disease.
Mitochondria-specific
OMIM [67]
Operon Operon data of
Rickettsia prowazekii.
Mitochondria-specific
Database of prOkaryotic OpeRons [68]
doi:10.1371/journal.pone.0111187.t003
Figure 3. ROC curves for evaluating the performances of various data sources using cross-validations.(A) ROC curves and AUC of individual dataset and integrated dataset. The data sources are highlighted in different colors. (B) ROC curves and AUC of mitochondrial-specific (green) and genome-scale (blue) datasets. ID: Integrated datasets; ProP: Protein expression profiles; DDI: Domain-Domian Interaction; GI: Genetic Interaction; DI: Disease Involvement; PSS: Phenotypic Semantic Similarity; PheP: Phylogenetic Profiles; RS: Rosetta Stone; PPI: Protein-Protein Interaction; SD: Shared Domains; GOSS: GO Semantic Similarity; IGD: Integrated Genomic-scale Datasets; IMG: Integrated Mitochondrial-specific Datasets; ROC: receiver operating characteristic; AUC: area under ROC curves.
comprised of 1072 proteins (covering approximately 71% of the mitochondrial proteome) and 32951 weighted functional linkages (Table 4), the average number of functional linked neighbors per protein is 61. The mitochondria-specific FLN owns such high coverage and linkage density, which is essential to the successful utilization of the FLN for disease gene prediction and prioritiza-tion.
Disease candidate gene prioritization
With the FLN, we aimed at using the information to prioritize candidates for mitochondrial diseases. The utility of FLN for disease candidates prioritization based on the assumption that genes underlying the same or related diseases tend to be functionally related [69]. Based on this assumption, FLNs have been successfully used to identify novel disease genes in recent studies [74–76]. Meanwhile, many network-based methods have been developed to prioritize candidates, for example, random walk, neighborhood-based and diffusion kernel methods. These methods mostly locate the known disease genes in network as ‘‘seeds’’ first, and then score the associated neighborhoods of these seeds by specific algorithm, and finally candidates are prioritized based on the scores of candidates.
In this work, four network-based methods were chosen for disease candidate prioritization. The average adjacency ranking (AAR) rule has been successfully used by Guan Y et al. to predict novel pathway components [74]. PageRank with Priors (PRP), K-step Markov (KSM) and Heat Kernel Diffusion Ranking (HKDR) methods were also used to prioritize disease candidates based on PPI networks [75]. Goncalves et al analyzed the performance of the four methods, indicating their applicability in prioritizing disease candidates [76].
Despite the impacts of ranking approaches, FLN should outperform the single source networks for the reason that multiple evidence increases coverage/density and reduces bias toward individual sources [76]. We evaluated the effectiveness of the four ranking algorithms utilizing the FLN and two single source networks including PPI network and co-expression network to prioritize candidates, both of which were derived from single data source. Furthermore, because the ranking algorithms are also susceptible to the network scale and density, the FLN was expanded into a scale-larger network named the FLNhm by including the middle-confidence mitochondrial genes and their functional linkages (the LR cutoff wasn’t used). We downloaded the disease data from the OMIM database, and extracted those that have at least two OMIM-annotated disease genes present in
the networks for identifying disease candidates. Owing to the scale difference, different sets of mitochondrial diseases and disease genes were analyzed when utilizing the four networks respectively. Using known disease-associated genes as ‘‘seeds’’, Leave-one-out cross-validation tests were conducted. ROC curves were plotted to visualize the performance with AUC values as quantitative measures.
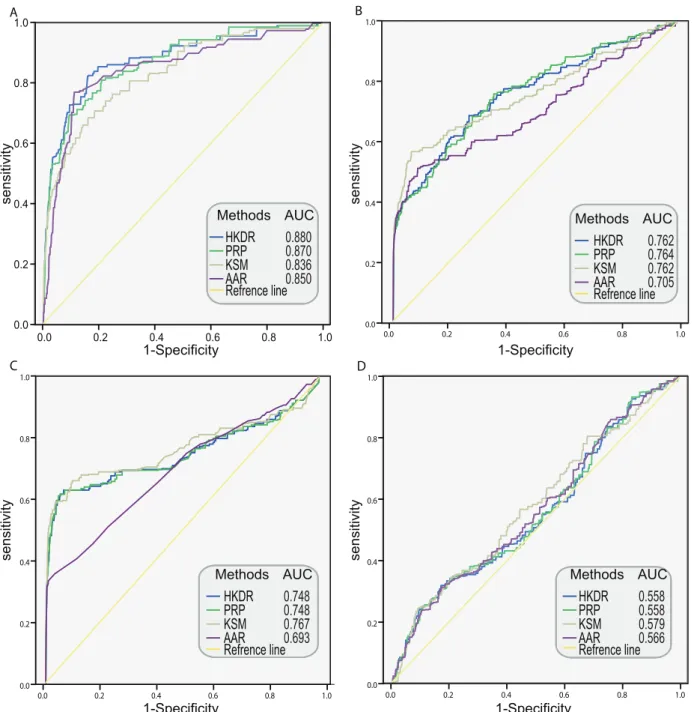
For the reason that algorithms performance differently with the parameter set and the scale of network different, different test parameter sets were empirically selected to decide the best algorithm and its optimal parameter set for each network. (see materials and methods).We decided the optimal parameters of the algorithms on each network based on the AUC (Table S5). Figure 5 showed ROC curves of the four algorithms with optimal parameters on the four networks. The HKDR, PRP and KSM algorithms outperformed neighborhood algorithm AAR, which indicated that the three algorithms utilizing the whole topology information were superior to algorithms utilizing local topology information. It may be the result of that the algorithms that utilize the whole topology can compensate for missing links by exploiting higher order neighborhoods and path redundancies [76]. HKDR and PRP algorithms performed best respectively on the FLN and the FLNhm. KSM had a poor performance compared with PRP and HKDR on FLN and FLNhm, but outperformed the two algorithms on the PPI network and the co-expression network, suggest that KSM algorithm was better in compensating for missing links than HKDR and PRP algorithm when being utilized in single source networks.
Furthermore, we also observed that the performances of the four algorithms dropped orderly and significantly in FLN, FLNhm, PPI network and co-expression network. As a single source network, the PPI network and co-expression network were supported to be less informative with limited coverage and large number of false positive linkages. Therefore, PPI network and co-expression network performed worse than FLN and FLNhm as expected. The FLNhm, which was denser and with bigger coverage than FLN, but performed worse than FLN, indicated that topology also play an important role in the performance of network. Being the best performance of cross-validation, HKDR algorithm with its optimal parameter (n = 3) on the FLN were chosen to rank candidates of mitochondrial diseases.
Mitochondrial complex I deficiency: a case study Mitochondrial complex I deficiency, the most common cause of mitochondrial disorders (accounts for,30% cases of respiratory
Table 4.Descriptions and parameters of four networks.
Description
Number of Nodes
Number of Edges
Average number of
neighbors Density
FLN FLN among the proteins with high confidence
1072 32951 61.476 0.057
FLNhm FLN among the proteins with high or middle confidence
1992 1983036 1991.000 1
PPI network Protein-protein interactions network derived from HPRD and I2D
1322 9049 12.850 0.01
Co-expression network
Co-expression network derived from microarray experiment GSE1133
1684 1417186 1683.000 1
chain deficiency in humans) [77], causes a wide range of clinical disorders, ranging from lethal neonatal disease to adult-onset neurodegenerative disorders. Phenotypes include macrocephaly with progressive leukodystrophy, nonspecific encephalopathy, hypertrophic cardiomyopathy, myopathy, liver disease, Leigh syndrome, Leber hereditary optic neuropathy, and some forms of Parkinson disease. It shows extreme genetic heterogeneity. Up to now, mutations in 17 genes encoding mitochondrial complex I subunits have been described in the OMIM database. However, these 17 genes account for disease in only a minority of mitochondrial complex I patients. Since mitochondrial complex I has at least 45 subunits [78,79], mutations in any of the other approximately 30 supernumerary subunit genes could potentially cause mitochondrial complex I deficiency, even mutations in other genes functionally associated with mitochondrial complex I subunits are also possible causes. Here, heat diffusion was applied to rank and screen promising candidates of mitochondrial complex I deficiency based on linkage with known disease genes, then we assessed the ability of prioritization to identify unknown causes.
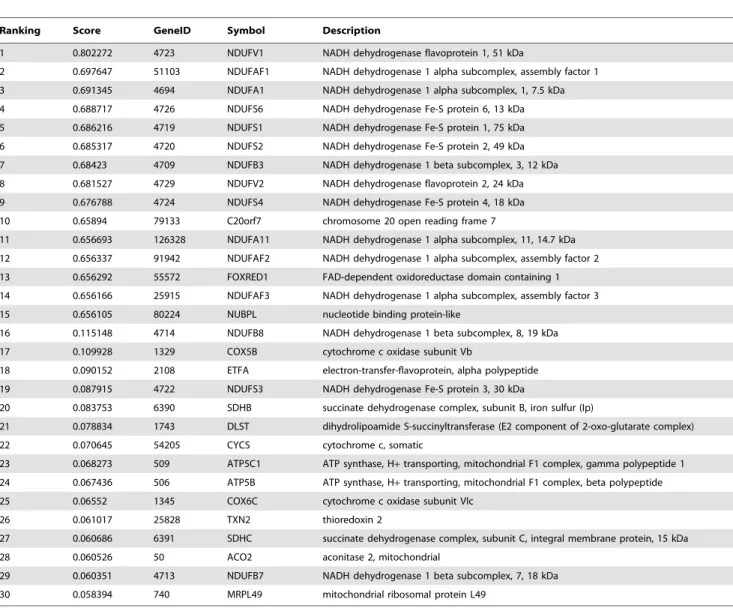
Fifteen of these disease causing genes are present in our function linkage network. The importance of each gene in the function linkage network relative to mitochondrial complex I deficiency was ranked using these 15 genes as seeds. We investigated the top 15 candidates (Table 5), almost all of which could be associated with mechanisms of mitochondrial complex I deficiency (Figure 6). In the top three, the NADH dehydrogenase 1 beta subcomplex, 8, 19 kDa(NDUFB8) is known to encode a subunit of mitochondrial complex I [79,80]. Haack et al. found mutations in NDUFB8 result in decreased activity and amount of mitochondrial complex I [81]. And thecytochrome c oxidase subunit Vb(COX5B), known to cooperate with mitochondrial complex I in respiratory electron transport chain, is a terminal enzyme of the mitochondrial respiratory chain [82].Electron-transfer-flavoprotein, alpha poly-peptide (ETFA), in the third place, shuttles electrons between primary flavoprotein dehydrogenases and the membrane-bound
electron transfer flavoprotein ubiquinone oxidoreductase [83]. Mutations inETFAare causative for multiple acyl-CoA dehydro-genase deficiency, and result in decreased activity of mitochondrial complexes I [84,85]. It is worth noting that the NADH dehydrogenase Fe-S protein 3, 30 kDa (NDUFS3), ranked 4th, encodes one of the iron-sulfur protein components of mitochon-drial NADH: ubiquinone oxidoreductase (complex I) [79,80]. Benit et al. found mutations in NDUFS3 related to isolated mitochondrial complex I deficiency by using a combination of denaturing high performance liquid chromatography and se-quence analysis [86]. Haack et al. also reported pathogenic mutations inNDUFS3 caused isolated mitochondrial complex I deficiency by combining unbiased exome analysis, sequential filter, and functional investigation [81]. The NADH dehydrogenase 1 beta subcomplex, 7, 18 kDa(NDUFB7), ranked 14th, encodes a subunit of mitochondrial complex I [79], Triepels et al. found pathogenic mutations inNDUFB7in the patients of mitochon-drial complex I deficiency [87].
Despite continued progress in our understanding of the molecular basis of mitochondrial complex I deficiency, the genetic defect remains elusive in many cases. With the application of the function linkage network, potential pathogenic causes could be ranked and prioritized. Furthermore, top ranked candidates could guide the design of new disease-genes association studies and offer clues for new treatment strategies.
Database and web server
We constructed a database named MitoProNet for storing our results including mammalian mitochondrial proteins, the FLN and human disease information. MitoProNet is an object-relational database implemented by mysql accessible via a user-friendly web interface written in JSP.
The main contents of MitProNet are demonstrated in Figure 7 including proteome section, disease section and FLN among proteins or genes, which could be accessed by browsing or Figure 4. TP/FP ratios vs. LR cutoff, and corresponding sensitivity.TP: True Positive; FP: False Positive. Sensitivity = TP/(TP+FN).
searching in MitProNet. Users can browse proteome data and disease data by clicking the proteome interface and the disease interface. The proteome interface provides comprehensive data of mammalian mitochondrial proteins that were identified experi-mentally. Results could be displayed orderly according to experiment, confidence level or organisms. The disease interface provides comprehensive information about typical mitochondrial diseases, including description, known disease genes, top ranking disease candidates ranked in our study, as well as functional linkages network among these genes. Users can also click the name of a protein of interest, the results include description of the
protein and its annotation information will be displayed via HTML pages. Moreover, a local functional linkages network can be visualized online as a scalable vector graphics (SVG) file, which provides the means for a fast visual evaluation of the protein’s functional association with other proteins. The search interface also allows users to source the proteins or diseases of interest conveniently by using a variety of keywords include gene IDs, gene symbols, protein IDs and OMIM IDs. And Figure 8 showed a case of browsing and searching in MitProNet. All these data presented in MitProNet can be downloaded freely through our download interface.
Figure 5. ROC curves for evaluating the performances of four networks on disease-gene prioritization.(A) The ROC curve for FLN. (B) The ROC curve for FLNhm. (C) The ROC curve for PPI network. (D) The ROC curve for co-expression network. AAR: Average Adjacency Ranking; PRP: PageRank with Priors; KSM: K-Step Markov; HKDR: Heat Kernel Diffusion Ranking; FLN: Functional Linkage Network among high-confidence mitochondrial proteins; FLNhm: Functional Linkage Network among high-confidence and middle-confidence mitochondrial proteins; PPIN: Protein-Protein Interaction Network; CEN: Co-Expression Network.
Conclusions
In our work, we carried out a comprehensive mammalian mitochondrial proteomic study through a three-step approach. We compiled an extensive inventory of mammalian mitochondrial proteins by combining 23 genomic-scale datasets. Our inventory showed considerable overlap with MitoPred and MotoCarta, the two best existing mitochondrial databases, but held greater sensitivity and lower false discovery rate. The high-confidence proteins along with the middle-confidence proteins provide a narrowed scope of candidates for mitochondrial proteins with relatively high possibility. We also constructed a comprehensive and high quality weighted FLN among mitochondrial proteins through integrating 15 heterogeneous functional features. With the comprehensive features integrated, the FLN is less biased towards single evidence and can be more accurate and with higher coverage. The high coverage and linkage density is essential to the successful utilization of the FLN for disease gene prediction and prioritization. Thus the FLN we presented can provide valuable resource for researches on mammalian mitochondrial proteomics. One important utility of the FLN is for mitochondrial disease
genes predicting and prioritizing. The top-ranking candidates for the mitochondrial diseases reported in this work represent the highly possible risk genes for the specific disease, which provide a narrowed spectrum of suspects for these important human diseases and will promote the disease-genes association studies and offer clues for new treatment strategies. Moreover, with the identifica-tion of new disease genes, these results can be further integrated into our framework for better disease gene predictions. Further-more, a web-based database MitProNet was also implemented. Researchers can easily locate a gene of interest and analyze those tightly associated genes. The visualization of local FLN around the gene can be a rapid and convenient approach to inspect the relationship of those associated genes. The disease related network present an overall landscape of the relationship of known and candidate genes. The complete set of mitochondrial genes and FLN are also provided. Thus the FLN and the disease candidates implemented in MitoProNet would facilitate the researches in mitochondria and diseases related to this important organelle. Table 5.The 30 top-ranking genes for mitochondrial complex I deficiency.
Ranking Score GeneID Symbol Description
1 0.802272 4723 NDUFV1 NADH dehydrogenase flavoprotein 1, 51 kDa
2 0.697647 51103 NDUFAF1 NADH dehydrogenase 1 alpha subcomplex, assembly factor 1
3 0.691345 4694 NDUFA1 NADH dehydrogenase 1 alpha subcomplex, 1, 7.5 kDa
4 0.688717 4726 NDUFS6 NADH dehydrogenase Fe-S protein 6, 13 kDa
5 0.686216 4719 NDUFS1 NADH dehydrogenase Fe-S protein 1, 75 kDa
6 0.685317 4720 NDUFS2 NADH dehydrogenase Fe-S protein 2, 49 kDa
7 0.68423 4709 NDUFB3 NADH dehydrogenase 1 beta subcomplex, 3, 12 kDa
8 0.681527 4729 NDUFV2 NADH dehydrogenase flavoprotein 2, 24 kDa
9 0.676788 4724 NDUFS4 NADH dehydrogenase Fe-S protein 4, 18 kDa
10 0.65894 79133 C20orf7 chromosome 20 open reading frame 7
11 0.656693 126328 NDUFA11 NADH dehydrogenase 1 alpha subcomplex, 11, 14.7 kDa
12 0.656337 91942 NDUFAF2 NADH dehydrogenase 1 alpha subcomplex, assembly factor 2
13 0.656292 55572 FOXRED1 FAD-dependent oxidoreductase domain containing 1
14 0.656166 25915 NDUFAF3 NADH dehydrogenase 1 alpha subcomplex, assembly factor 3
15 0.656105 80224 NUBPL nucleotide binding protein-like
16 0.115148 4714 NDUFB8 NADH dehydrogenase 1 beta subcomplex, 8, 19 kDa
17 0.109928 1329 COX5B cytochrome c oxidase subunit Vb
18 0.090152 2108 ETFA electron-transfer-flavoprotein, alpha polypeptide
19 0.087915 4722 NDUFS3 NADH dehydrogenase Fe-S protein 3, 30 kDa
20 0.083753 6390 SDHB succinate dehydrogenase complex, subunit B, iron sulfur (Ip)
21 0.078834 1743 DLST dihydrolipoamide S-succinyltransferase (E2 component of 2-oxo-glutarate complex)
22 0.070645 54205 CYCS cytochrome c, somatic
23 0.068273 509 ATP5C1 ATP synthase, H+transporting, mitochondrial F1 complex, gamma polypeptide 1
24 0.067436 506 ATP5B ATP synthase, H+transporting, mitochondrial F1 complex, beta polypeptide
25 0.06552 1345 COX6C cytochrome c oxidase subunit VIc
26 0.061017 25828 TXN2 thioredoxin 2
27 0.060686 6391 SDHC succinate dehydrogenase complex, subunit C, integral membrane protein, 15 kDa
28 0.060526 50 ACO2 aconitase 2, mitochondrial
29 0.060351 4713 NDUFB7 NADH dehydrogenase 1 beta subcomplex, 7, 18 kDa
30 0.058394 740 MRPL49 mitochondrial ribosomal protein L49
Materials and Methods
An inventory of mammalian mitochondrial proteins To reduce redundancy, the proteins were transformed into corresponding genes identified unique by Entrez GeneID.
Gold standard sets. The GSP dataset was comprised of human mitochondrial proteins that were curated from the MitoP2
database [88]. To avoid contamination, we only used proteins with supports of sublocalization experiments, and excluded those characterized solely by large-scale proteomic studies. The GSN, on the other hand, was selected from proteins located in other cellular compartments according to Gene Ontology (GO) anno-tations. For those proteins with multiple subcellular locations, we excluded those with subcellular location in mitochondrial compo-Figure 6. Prioritization results for mitochondrial complex I deficiency.(A) A hypothetical FLN of mitochondrial complex I deficiency. The FLN is comprising of known disease genes (highlighted in red) annotated in OMIM and predicted disease genes (highlighted in greed). The candidates are classified into three levels (high-confidence, middle-confidence and low-confidence) according to their ranking scores. (B) The functional linkage sub-network among the candidate NDUFS3 that has a top score on ranking algorithm for mitochondrial complex I deficiency. doi:10.1371/journal.pone.0111187.g006
Figure 7. System architecture and main contents of MitProNet.MitProNet is composed of three sections including mitochondrial protein part lists, annotations of mitochondrial protein and disease information.
nents or locations from the GSN. As a result, the GSP dataset contained 553 proteins, while the GSN dataset consisted of 9950 non-mitochondrial proteins.
Cross validation and evaluation of machine-learning algorithms. When training the classifiers, the 23 proteomic experiments datasets were considered as ‘features’. And for each feature, we assigned a score 1 to each human gene product if the product exists in the dataset, or 0 otherwise. We used the 10-fold cross validation to evaluate prediction performance of these machine-learning classifiers [89]. For each machine-learning classifier, at first, both the GSP and GSN were randomly partitioned into ten equal-sized folds. After that, the machine-learning classifier was trained on nine folds and the remaining one fold was used as a test set to identify the number of positives and negatives. This was repeated ten times with a different fold used for testing each time.
Calculating sensitivity and false discovery rate. Sensitivity is defined as TP/(TP+FN), where TP is the number of true positives and FN is the number of false negatives, respectively, estimated from gold-standard sets. The false discovery
rate (FDR) is the proportion of all predictions that are false; FDR = FP/(FP+TP), where FP represent the number of false positives [29].
Construction of mitochondrial FLN through data integration
To carry out the construction of FLN, each dataset should be transformed into protein pairs with functional linkage. The preprocessing is described in supplementary methods (Method S1) in detail.
Gold standard sets. In this study, we downloaded KEGG pathway [60] and MIPS complex [90] about mitochondrion. The GSP were defined as mitochondrial protein pairs sharing the same KEGG pathway or existing in the same MIPS complex, while the GSN were defined as mitochondrial protein pairs both annotated by KEGG pathway or MIPS complex terms but that do not share any term.
Naı¨ve Bayes for mammalian mitochondrial FLN construction. According the Bayesian theorem, the prior odds Figure 8. Web pages in MitProNet.(A) A list page of mitochondrial proteins. The mitochondrial proteins can be listed according to proteomic datasets, confidence levels and organisms, respectively. (B) The outcome page for the query protein NDUFS7, an annotated disease gene for Leigh syndrome. The page provides a brief summary of the query protein, subcellular localization evidences and a FLN among the query protein. Moreover, the query protein is annotated according to the information collected from their original sources including GO, KEGG, MIPS and OMIM. (C) The prioritization results for Leigh syndrome. The result page includes a brief description for this phenotype, disease genes and a FLN among these genes. The disease genes are listed dividedly as the known genes and the candidates that are ordered by these ranking scores.
(Oprior) of finding a gene pair with functional linkage could be
calculated as:
Oprior~Ppos
Pneg ð1Þ
wherePposis the probability that a gene pair functionally relates
within all the possible gene pairs while the Pneg stands for the
probability that a gene pair isn’t functionally related. When considering the givennevidences (E) that stands for the functional features, the posterior odds (Oposterior) of a functional linkage gene
pair could be computed as:
Oposterior~P(positiveDE1,:::,En)
P(negtiveDE1,:::,En)
~Oprior|LR(E1,:::En) ð2Þ
whereLR(E1,…,En)is the likelihood ratio of thenevidences(E).
From Equation 1 and Equation 2, the LR could be calculated as:
LR(E1,:::,En)~
P(E1,:::,EnDpos) P(E1,:::,EnDneg)
ð3Þ
If we assume that the evidences are conditionally independent, the compositeLRcan be calculated simply as following:
LR(E1,:::,En)~ P n
i~1
P(EiDpos)
P(EiDneg) ð4Þ
And Equation 4 can also be written as the following:
LR(E1,:::,En)~ P n
i~1LR(Ei) ð5Þ
Cross validation and cutoff selection. We employed the five-fold cross-validation against the golden standard datasets to evaluate the overall prediction performance under different LR cutoffs. First, both the GSP and GSN datasets were randomly partitioned into five equal-sized folds. After that, the naı¨ve Bayesian classifier was trained on four folds and the remaining one fold was used as a test set to identify the number of positives and negatives. This was repeated five times with a different fold used for testing each time. We used the ratio of true positive to false positive (TP/FP) and the sensitivity to measure the prediction accuracy.
Ranking the mitochondrial disease gene
Average Adjacency Ranking. Given a particular mitochon-drial disease, firstly,mgenes were extracted randomly from known disease-related mitochondrial genes as seed gene set, and the rest of the genes were treated as unknown ones. Then for every other gene, we compute the adjacency to themseeds. This process was repeated one hundred times with random samplings of the seed set. Lastly, we calculated the average adjacency with a given disease for each gene:
Wi~1
ni Xni
K~1 Xm
j~1
Wij ð6Þ
whereWirepresents the weight of each gene associate with a given
disease andjrepresents the seed genes, andWijis the functional
linkage weights connecting geneiand seed genej.niis the number
of times gene iwas not a member in the seed set and k is the iteration number.
PageRank with Priors. PRP mimics a random jump procedure in network, which start with known disease-related genes and randomly jump to candidate genes. When the system jump to a candidate gene, system can continue jumping to other candidate genes or jump back to known disease-related genes and then restart the procedure. After enough jumping, PRP scores each candidate gene based on the probability that system jump to the gene. The iterative stationary probability is:
p(v)(iz1)~(1{b) X
din(v)
u~1
p(vDu)p(i)(u)
( )
zbpv ð7Þ
wherepvrepresents the ‘‘prior bias’’ which means the probability
to start with a particular genes.pv= 1/|R| if v in root node set R
(known disease-related gene set);pv= 0 otherwise.bis empirically
defined on [0, 1], represents a ‘‘back probability’’ which means the probability to jump back to the root node in each step. din(v)is the in-degree ofv.p(v|u)is the probability of arriving nodevfromu. K-step Markov. KSM also mimics a random jump proce-dure that start with disease-related genes and ends after fixed K steps. It computes the relative probability that the system will spend time at any particularnode given that it starts in a set of roots R and ends after K Steps [91]. K keeps a balance between distributions of candidate genes ‘biased’ toward known disease-related genes. With a larger K, system gets a more steady distribution of candidate genes [75]. The to compute the K-Step Markov importance is:
I(tDR)~ APRzA2PR:::AkPR
ð8Þ
WhereAis the transition probability matrix of network,pRis an
vector of initial probabilities for the root set R (known disease genes set),kis the probability transition steps andI(t|R)is thet-th entry in this sum vector.
Heat Kernel Diffusion Ranking. The Heat Kernel Diffu-sion Ranking approach ranks the candidate genes by diffusing the signal of ‘seeds’ to the candidate genes through the network based on the weighted edges [92]. The network can be represented as a weighted, simple graph G, where genes are nodes and weighted linkages are weighted edges. Given a graph G, let A be the Adjacency matrix whereaij= wij and thenDcan be defined as
D~diag(ai)~Pnj~1aij. The transition probability matrixWof a random walk onGis defined asW = D21A. Consider L = I-W.
Given a parameter a, establishing the diffusion rate, and a preference vectorp0, expressing the initial relevance score of each
node, the rankingpais given by
Pa~P0(Iz
{a
N L)
N
ð9Þ
whereNis the number of iterations.
Evaluation scheme
and SKM, a set of different parameters were empirically selected: HKDR with n = 2, 3, 4, 5, 6, 7; PRW withb= 0.01, 0.05, 0.1, 0.2, 0.3, 0.4,0.5,0.6, 0.7,0.8, 0.9,0.95; SKM with K = 2, 3, 4, 5, 6, 7, 8, 9.
Supporting Information
Figure S1 Measurement of the contributions of diverse datasets for constructing the FLN. (A) GO semantic similarity. (B) Four microarray experiment datasets GSE1133, GSE4330, GSE6210, GSE4726. (C) Protein expression profiles. (D) Protein-protein interaction (PPI), Rosetta Stone (RS), domain-domain interaction (DDI), diseases involvements (DI), genetic interaction(GI). (E) Operons. (F) Phylogenetic profiles. (G) Phenotypic semantic similarity. (H) Shared domains.
(EPS)
Table S1 Ten-fold cross-validation results of machine-learning classifiers in Weka.
(DOC)
Table S2 List of high-confidence mammalian mitochondrial proteins.
(XLS)
Table S3 Coverage of datasets on gold standard set. (DOC)
Table S4 Pearson correlation coefficients between high coverage datasets on the gold standard set.
(DOC)
Table S5 Optimal parameters and corresponding performances of four algorithms on four networks.
(DOC)
Table S6 Organisms used for phylogenetic profiles. (XLS)
Method S1 Data source and processing methods of the 11 genomic features to generate FLN.
(DOC)
Author Contributions
Conceived and designed the experiments: XL. Performed the experiments: JW JY. Analyzed the data: JW JY SM YH XH YT XC XL CB. Wrote the paper: JW JY XL. Collected datasets: JW JY SM YH. Constructed the web server and implemented database: JW. Read and approved the final manuscript: JW JY SM YH XH YT XC XL CB.
References
1. Chan DC (2006) Mitochondria: dynamic organelles in disease, aging, and development. Cell 125: 1241–1252.
2. Facecchia K, Fochesato LA, Ray SD, Stohs SJ, Pandey S (2011) Oxidative toxicity in neurodegenerative diseases: role of mitochondrial dysfunction and therapeutic strategies. J Toxicol 2011: 683–728.
3. Shenouda SM, Widlansky ME, Chen K, Xu G, Holbrook M, et al. (2011) Altered mitochondrial dynamics contributes to endothelial dysfunction in diabetes mellitus. Circulation 124: 444–453.
4. Traish AM, Abdallah B, Yu G (2011) Androgen deficiency and mitochondrial dysfunction: implications for fatigue, muscle dysfunction, insulin resistance, diabetes, and cardiovascular disease. Hormone Molecular Biology and Clinical Investigation 8: 431–444.
5. Johri A, Beal MF (2012) Mitochondrial dysfunction in neurodegenerative diseases. Journal of Pharmacology and Experimental Therapeutics 342: 619– 630.
6. Salminen A, Ojala J, Kaarniranta K, Kauppinen A (2012) Mitochondrial dysfunction and oxidative stress activate inflammasomes: impact on the aging process and age-related diseases. Cell Mol Life Sci 69: 2999–3013.
7. Distler AM, Kerner J, Hoppel CL (2008) Proteomics of mitochondrial inner and outer membranes. Proteomics 8: 4066–4082.
8. Smith AC, Robinson AJ (2009) MitoMiner, an integrated database for the storage and analysis of mitochondrial proteomics data. Mol Cell Proteomics 8: 1324–1337.
9. Gregersen N, Hansen J, Palmfeldt J (2012) Mitochondrial proteomics–a tool for the study of metabolic disorders. J Inherit Metab Dis 35: 715–726.
10. Elstner M, Andreoli C, Klopstock T, Meitinger T, Prokisch H (2009) The mitochondrial proteome database: MitoP2. Methods Enzymol 457: 3–20. 11. Cotter D, Guda P, Fahy E, Subramaniam S (2004) MitoProteome:
mitochondrial protein sequence database and annotation system. Nucleic Acids Res 32: D463–467.
12. Catalano D, Licciulli F, Turi A, Grillo G, Saccone C, et al. (2006) MitoRes: a resource of nuclear-encoded mitochondrial genes and their products in Metazoa. BMC Bioinformatics 7: 36.
13. Basu S, Bremer E, Zhou C, Bogenhagen DF (2006) MiGenes: a searchable interspecies database of mitochondrial proteins curated using gene ontology annotation. Bioinformatics 22: 485–492.
14. Pagliarini DJ, Calvo SE, Chang B, Sheth SA, Vafai SB, et al. (2008) A mitochondrial protein compendium elucidates complex I disease biology. Cell 134: 112–123.
15. Johnson DT, Harris RA, French S, Blair PV, You J, et al. (2007) Tissue heterogeneity of the mammalian mitochondrial proteome. Am J Physiol Cell Physiol 292: C689–697.
16. Ashburner M, Ball CA, Blake JA, Botstein D, Butler H, et al. (2000) Gene ontology: tool for the unification of biology. The Gene Ontology Consortium. Nat Genet 25: 25–29.
17. Oliver S (2000) Guilt-by-association goes global. Nature 403: 601–603. 18. Shen-Orr SS, Milo R, Mangan S, Alon U (2002) Network motifs in the
transcriptional regulation network of Escherichia coli. Nat Genet 31: 64–68. 19. Stelzl U, Worm U, Lalowski M, Haenig C, Brembeck FH, et al. (2005) A human
protein-protein interaction network: a resource for annotating the proteome. Cell 122: 957–968.
20. Zhang J, Xiang Y, Ding L, Keen-Circle K, Borlawsky TB, et al. (2010) Using gene co-expression network analysis to predict biomarkers for chronic lymphocytic leukemia. BMC Bioinformatics 11 Suppl 9: S5.
21. Snel B, Lehmann G, Bork P, Huynen MA (2000) STRING: a web-server to retrieve and display the repeatedly occurring neighbourhood of a gene. Nucleic Acids Res 28: 3442–3444.
22. Joshi-Tope G, Gillespie M, Vastrik I, D’Eustachio P, Schmidt E, et al. (2005) Reactome: a knowledgebase of biological pathways. Nucleic acids research 33: D428–D432.
23. Stark C, Breitkreutz BJ, Reguly T, Boucher L, Breitkreutz A, et al. (2006) BioGRID: a general repository for interaction datasets. Nucleic Acids Res 34: D535–539.
24. Franke L, van Bakel H, Fokkens L, de Jong ED, Egmont-Petersen M, et al. (2006) Reconstruction of a functional human gene network, with an application for prioritizing positional candidate genes. Am J Hum Genet 78: 1011–1025. 25. Linghu B, Snitkin ES, Hu Z, Xia Y, Delisi C (2009) Genome-wide prioritization
of disease genes and identification of disease-disease associations from an integrated human functional linkage network. Genome Biol 10: R91. 26. Reja R, Venkatakrishnan AJ, Lee J, Kim BC, Ryu JW, et al. (2009)
MitoInteractome: mitochondrial protein interactome database, and its applica-tion in ‘aging network’ analysis. BMC Genomics 10 Suppl 3: S20.
27. Gu Z, Li J, Gao S, Gong M, Wang J, et al. (2011) InterMitoBase: an annotated database and analysis platform of protein-protein interactions for human mitochondria. BMC Genomics 12: 335.
28. Meisinger C, Sickmann A, Pfanner N (2008) The mitochondrial proteom: From inventory to function. Cell 134: 22–24.
29. Calvo S, Jain M, Xie X, Sheth SA, Chang B, et al. (2006) Systematic identification of human mitochondrial disease genes through integrative genomics. Nat Genet 38: 576–582.
30. Taylor SW, Fahy E, Zhang B, Glenn GM, Warnock DE, et al. (2003) Characterization of the human heart mitochondrial proteome. Nat Biotechnol 21: 281–286.
31. Rezaul K, Wu L, Mayya V, Hwang SI, Han D (2005) A systematic characterization of mitochondrial proteome from human T leukemia cells. Mol Cell Proteomics 4: 169–181.
32. Xie J, Techritz S, Haebel S, Horn A, Neitzel H, et al. (2005) A two-dimensional electrophoretic map of human mitochondrial proteins from immortalized lymphoblastoid cell lines: a prerequisite to study mitochondrial disorders in patients. Proteomics 5: 2981–2999.
33. Ozawa T, Sako Y, Sato M, Kitamura T, Umezawa Y (2003) A genetic approach to identifying mitochondrial proteins. Nat Biotechnol 21: 287–293.
34. Mootha VK, Bunkenborg J, Olsen JV, Hjerrild M, Wisniewski JR, et al. (2003) Integrated analysis of protein composition, tissue diversity, and gene regulation in mouse mitochondria. Cell 115: 629–640.
35. Jin J, Davis J, Zhu D, Kashima DT, Leroueil M, et al. (2007) Identification of novel proteins affected by rotenone in mitochondria of dopaminergic cells. BMC Neurosci 8: 67.