SENTINEL-1/2 DATA FOR SHIP TRAFFIC MONITORING ON THE DANUBE RIVER
I. Dana Negula a, *, V. D. Poenaru a, V. G. Olteanu a, A. Badea a
a Romanian Space Agency, 010362 Bucharest, Romania - (iulia.dana, violeta.poenaru, vlad.olteanu, alexandru.badea)@rosa.ro
Commission VIII, WG VIII/1
KEY WORDS: Sentinel-1, Sentinel-2, Ship Detection, Water Mask, Danube River, Low Water Level
ABSTRACT:
After a long period of drought, the water level of the Danube River has significantly dropped especially on the Romanian sector, in July-August 2015. Danube reached the lowest water level recorded in the last 12 years, causing the blockage of the ships in the sector located close to Zimnicea Harbour. The rising sand banks in the navigable channel congested the commercial traffic for a few days with more than 100 ships involved. The monitoring of the decreasing water level and the traffic jam was performed based on Sentinel-1 and Sentinel-2 free data provided by the European Space Agency and the European Commission within the Copernicus Programme. Specific processing methods (calibration, speckle filtering, geocoding, change detection, image classification, principal component analysis, etc.) were applied in order to generate useful products that the responsible authorities could benefit from. The Sentinel data yielded good results for water mask extraction and ships detection. The analysis continued after the closure of the crisis situation when the water reached the nominal level again. The results indicate that Sentinel data can be successfully used for ship traffic monitoring, building the foundation of future endeavours for a durable monitoring of the Danube River.
* Corresponding author
1. INTRODUCTION
The exceptional potential of Earth Observation (EO) satellite data for ship traffic monitoring is progressively demonstrated by the numerous projects and initiatives supported by European Space Agency (ESA), European Commission (EC) or other significant organizations. Relevant examples include the Sea Search Project, the MAPP-DEMO Maritime Prevention Project Demonstrator, the EO CROWD Project – Feasibility Study on Joint EO and Crowdsource Bathymetry, the METSAR Project, the PROTECT Project - Piracy Prevention and Commercial Navigation in Insecure Waters, the DESIRE II Project – Demonstration of the Use of Satellites Complementing Remotely Piloted Aircraft Systems Integrated in Non-Segregated Airspace - Second Element (https://artes-apps.esa. int/projects/theme/maritime-offshore), SpaceNav - Space-Based Maritime Navigation, EONav - Earth Observation for Maritime Navigation, MARISS - Maritime Security Services, DOLPHIN Development of Pre-operational Services for Highly Innovative Maritime Surveillance Capabilities, NEREISDS - New Service Capabilities for Integrated and Advanced Maritime Surveillance (http://www.copernicus.eu/search/node/maritime), etc.
In July-August 2015, the high temperatures and the lack of precipitation led to the considerable decrease of the Danube water level. In August, Danube reached the lowest water level recorded since 2003, causing the congestion of ship traffic in several important points, such as Zimnicea, Braila, Galati, Cotul Prutului, Isaccea, Tulcea, and Bara Sulina. According to the media reports, the water flows between Bechet and Rast, Calafat and Zimnicea, and between Harsova and Tulcea were strongly affected by the crisis situation. More than 100 commercial ships were blocked by the sand banks (Figure 1) that emerged in the navigable channel of the Danube River. The total length of the Danube River in Romania is 1,075 km (29.9% Danube Basin).
Figure 1. Sand banks emerged in the Danube navigable channel – Galati, 8 August 2015 (© Marian Cepeha 2015)
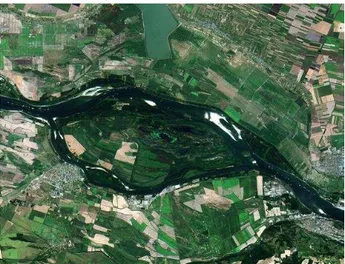
Lower Danube flows through the Romanian towns of Bazias, Moldova Noua, Orsova, Drobeta-Turnu Severin, Calafat, Turnu Magurele, Zimnicea, Giurgiu, Oltenita, Calarasi, Fetesti, Cernavoda, Harsova, Braila, Galati, Isaccea, Tulcea and Sulina (Figure 2).
Figure 2. Danube River in Romania The International Archives of the Photogrammetry, Remote Sensing and Spatial Information Sciences, Volume XLI-B8, 2016
2. SATELLITE DATA AND TEST AREA Sentinel-1 and Sentinel-2 data were used for the monitoring of the decreasing water level and the traffic jam. Sentinel-1 carries a C-band synthetic aperture radar (SAR) that continues the ESA missions of ERS and ENVISAT. The data acquired by Sentinel-1 are suitable for the surveillance of the marine environment, including oil-spill monitoring, ship detection for maritime security and mapping in support of emergency situations (http://www.esa.int/Our_Activities/Observing_the_Earth/Coper nicus/Sentinel-1/Introducing_Sentinel-1).
The Sentinel-1 data were acquired in the Interferometric Wide (IW) swath mode, with dual polarization VV+VH, Ground Range Detected (GRD) processing level. Table 1 presents the list of Sentinel-1 images processed within the study.
Acquisition date Orbit type Relative orbit
24.07.2015 A 58
27.07.2015 A 102
28.07.2015 D 109
02.08.2015 D 07
05.08.2015 A 58
08.08.2015 A 102
08.08.2015 A 102
09.08.2015 D 109
12.08.2015 D 153
14.08.2015 D 07
Table 1. List of Sentinel-1 data
Based on Sentinel-1 data, Figures 3-7 illustrate the evolution of the riverine traffic congestion between July 27-28 and August 9, 2015, in Zimnicea Harbour, and Giurgiu Harbour, respectively.
Figure 3. Zimnicea Harbour – 27.07.2015 - Sentinel-1A (© Copernicus Sentinel data 2015)
Figure 4. Zimnicea Harbour – 02.08.2015 - Sentinel-1A (© Copernicus Sentinel data 2015)
Figure 5. Zimnicea Harbour – 09.08.2015 - Sentinel-1A (© Copernicus Sentinel data 2015)
Figure 6. Giurgiu Harbour – 28.07.2015 - Sentinel-1A (© Copernicus Sentinel data 2015)
Figure 7. Giurgiu Harbour – 09.08.2015 - Sentinel-1A (© Copernicus Sentinel data 2015)
Sentinel-2 is equipped with an innovative multispectral imager that acquires images with a swath width of 290 km using 13 spectral bands. The high-resolution optical sensor (4 spectral bands with 10 m spatial resolution) has a frequent revisiting capacity (5 days when both satellites will be on orbit). Sentinel-2 can be used to determine different water content indexes, water quality, and water pollution. Also, Sentinel-2 data play a major role in disaster mapping, including floods (http://www. esa.int/Our_Activities/Observing_the_Earth/Copernicus/Sentine l-2/Introducing_Sentinel-2). Table 2 displays the details of the Sentinel-2 image used within the present study, while Figures 8-10 present RGB compositions in natural colors (B4-B3-B2) for different points of interest along the Danube River.
Acquisition date Orbit type Relative orbit
08.08.2015 D 93
Table 2. Details of Sentinel-2 data The International Archives of the Photogrammetry, Remote Sensing and Spatial Information Sciences, Volume XLI-B8, 2016
Figure 8. Zimnicea Harbour – 26.07.2015 - Sentinel-2A (© Copernicus Sentinel data 2015 / ESA)
Figure 9. Rast Harbour – 08.08.2015 - Sentinel-2A (© Copernicus Sentinel data 2015)
Figure 10. Portile de Fier – 08.08.2015 - Sentinel-2A (© Copernicus Sentinel data 2015)
3. SATELLITE DATA PROCESSING 3.1 SAR for vessel surveillance
Nowadays, space-borne SAR data represent an adequate solution for vessel surveillance applications due to the capacity of SAR systems to operate day and night, on all weather conditions (Tello et al., 2006), (Zhao et al., 2014a). The Vessel Monitoring System (VMS) provides the position and identification of fishing vessels longer than 15 m. Likewise, the Automatic Identification System (AIS) gives the position and enables the identification of large merchant vessels. Usually, the smallest vessels are not equipped with VMS or AIS. Nevertheless, small vessels can detected by using Earth Observation satellite data. SAR data acquired by the current
operational satellites have high resolution and cover large areas. However, the ideal approach is the integration of SAR data with AIS data in order to achieve near-real and global surveillance, as the collected information is complementary (Zhao et al., 2014a). The automatic detection of ships based on SAR data benefits from a large number of scientific studies. An in-depth analysis of the new and well-known algorithms for SAR ship detection is performed in (Marino et al., 2015). The automatic classification of vessels using inverse synthetic aperture radar (ISAR) imagery is described in (Zhao et al., 2014b). A new SAR technique called CopSAR (coprime SAR) enables the identification of ships within a maritime environment, by increasing the range swath without the loss of the geometric resolution (Di Martino and Iodice, 2014). In addition, the detection of small vessel may be improved by using corner reflectors, as proposed in (Stastny et al., 2014). An operational ship monitoring system based on SAR processing is presented in (Margarit et al., 2009).
3.2 Optical satellite data for ship detection
Optical EO imagery is also crucial for maritime security. An operational ship detection algorithm that provides good results also for small targets is detailed in (Corbane et al., 2010). The combined use of optical EO imagery and electronic intelligence satellite data is presented in (Sun et al., 2015). Other methods are thoroughly described in (Arguedas, 2015), (Bi et al., 2012), (Yang et al., 2013), (Jubelin and Khenchaf, 2014), and (Proia and Pagé, 2009).
3.3 Sentinel data processing – preliminary results
The current study presents the preliminary results of Sentinel-1 data processing for ship detection. Firstly, in order to extract the areas covered by water, the Sentinel-1 images acquired along the Danube River were processed using the SNAP software (© ESA, version 3.0) and the UN-SPIDER recommended practice for flood mapping (http://www.un-spider.org/advisory-support/ recommended-practices/recommended-practice-flood-mapping), (Kussul et al., 2011). Small tiles of data were extracted from the original images in order to reduce the processing time. Next, basic pre-processing operations (calibration, speckle filtering) were applied to the subsets, followed by water mask extraction (Figure 11) and geocoding based on SRTM data. Secondly, the detection of ships was carried out by automatic segmentation classification using a trial version of the eCognition software (Figures 12 and 13). The results may be further improved as not all the ships congested in the area of the Zimnicea Harbour are correctly identified, as it can clearly be observed by the visual interpretation of the Sentinel-1 images (Figures 14-17).
Figure 11. Water mask Zimnicea – 09.08.2015 - Sentinel-1A (© Copernicus Sentinel data 2015)
Figure 12. Automatic detection of ships - Zimnicea – 09.08.2015 - Sentinel-1A (© Copernicus Sentinel data 2015)
Figure 13 Automatic detection of ships (zoom) - Zimnicea – 09.08.2015 - Sentinel-1A (© Copernicus Sentinel data 2015)
Figure 14. Vessel situation (1) - Zimnicea – 09.08.2015 - Sentinel-1A (© Copernicus Sentinel data 2015)
Figure 15. Vessel situation (2) - Zimnicea – 09.08.2015 - Sentinel-1A (© Copernicus Sentinel data 2015)
Figure 16. Vessel situation (3) - Zimnicea – 09.08.2015 - Sentinel-1A (© Copernicus Sentinel data 2015)
Figure 17. Vessel situation (4) - Zimnicea – 09.08.2015 - Sentinel-1A (© Copernicus Sentinel data 2015)
4. CONCLUSION
The present study demonstrated the potential of Sentinel data for vessel surveillance. With the great advantage of being free and immediately available for the users, Sentinel data can provide critical information for the responsible authorities, just by using visual interpretation without any advanced processing tools. However, by using an automatic approach for ship detection, the products derived from Sentinel data may become even more effective. A ship traffic monitoring service for the Danube River can be successfully developed based on Sentinel data, considering the large number of interested parties, i.e. private and public port and marina operators, security, law enforcement and defence agencies, border control, commercial and leisure mariners, harbour responsible authorities, marine insurers, national naval authorities, fishermen organisations and last but not least, scientists from oceanography, riverine and marine environment and ecology, etc. Although the processing of Sentinel-1 data yield good preliminary results, the next phase of the study consists in the further improvement of the outcomes, followed by their validation based on ground truth data acquired by VMS/AIS installed in the considered harbours. Additionally, future work includes the integration of optical satellite data for more comprehensive products in support of riverine and maritime traffic surveillance.
ACKNOWLEDGEMENT
This work was supported by a grant of the Romanian Ministry of National Education and Scientific Research, Executive Agency for Higher Education, Research, Development and Innovation Funding (UEFISCDI), contract no 202/2012, project ID PN-II-PT-PCCA-2011-3.2-0575.
REFERENCES
Arguedas, V. F., 2015. Texture-based Vessel Classifier for Electro-optical Satellite Imagery. In: Image Processing (ICIP), 2015 IEEE International Conference on, Quebec City, Canada, 27-30 September 2015, pp. 3866-3870.
ARTES Applications, European Space Agency, 2016. Maritime and Offshore Projects, https://artes-apps.esa.int/projects/theme/ maritime-offshore (16 Apr. 2016).
Bi, F., Zhu, B., Gao, L., Bian, M., 2012. Computational Model for Ship Detection in Optical Satellite Images. IEEE Geoscience and Remote Sensing Lettters, 9(4), pp. 749-753.
COPERNICUS Europe's Eyes on Earth, European Commission, 2016, Maritime (Marine Monitoring) Projects, http://www. copernicus.eu/search/node/maritime (16 Apr. 2016).
Corbane, C., Najman, L., Pecoul, E., Petit, M., 2010. A Complete Processing Chain for Ship Detection Using Optimal Satellite Imagery. International Journal of Remote Sensing, 31(22), pp. 5837-5854.
Di Martino, G. & Iodice, A., 2014. Coprime Synthetic Aperture Radar (CopSAR): A New Acquisition Mode for Maritime Surveillance. IEEE Transactions on Geoscience and Remote Sensing, 53(6), pp. 3110-3123.
Jubelin, G. and Khenchaf, A., 2014. Multiscale Algorithm for Ship Detection in Mid, High and Very High Resolution Optical Imagery. In: 2014 IEEE Geoscience and Remote Sensing Symposium, Quebec City, Canada, 13-18 July 2014, pp. 2289-2292.
Kussul N., Shelestov A., Skakun S., 2011. Flood Monitoring on the Basis of SAR Data”, In: Use of Satellite and In-Situ Data to Improve Sustainability, NATO Science for Peace and Security Series C: Environmental Security, pp. 19-29.
Margarit, G., Milanes, J. A. B., Tabasco, A., 2009. Operational Ship Monitoring System Based on Synthetic Aperture Radar Processing. Remote Sensing, 1(3), pp. 375-392.
Marino, A., Sanjuan-Ferrer, M. J., Hajnsek, I., Ouchi, K., 2015. Ship Detection with Spectral Analysis of Synthetic Aperture Radar: A Comparison of New and Well-Known Algorithms. Remote Sensing, 7(5), pp. 5416-5439.
Proia, N. and Pagé, V., 2009. Characterization of a Bayesian Ship Detection Method in Optical Satellite Images. IEEE Geoscience and Remote Sensing Lettters, 7(2), pp. 226-230.
Sentinel-1, European Space Agency, 2016. Introducing Sentinel -1, http://www.esa.int/Our_Activities/Observing_the_Earth/ Copernicus/Sentinel-1/Introducing_Sentinel-1 (16 Apr. 2016).
Sentinel-2, European Space Agency, 2016. Introducing Sentinel -2, http://www.esa.int/Our_Activities/Observing_the_Earth /Copernicus/Sentinel-2/Introducing_Sentinel-2 (16 Apr. 2016).
Stastny, J., Cheung, S., Wiafe, G., Agyekum, K., Greidanus, H., 2014, Application of RADAR Corner Reflectors for the Detection of Small Vessels in Synthetic Aperture Radar. IEEE Journal of Selected Topics in Applied Earth Observations and Remote Sensing, 8(3), pp. 1099-1107.
Sun, H., Zou, H. X., Ji, K. F., Zhou, S. L., Lu, C. Y., 2015, Combined Use of Optical Imaging Satellite Data and Electronic Intelligence Satellite Data for Large Scale Ship Group Surveillance. Journal of Navigation, 68(2), pp. 383-396.
Tello, M., López-Martínez, C., Mallorqui, J., 2006, Automatic vessel monitoring with single and multidimensional SAR images in the wavelet domain. ISPRS Journal of Photogrammetry and Remote Sensing, 61(3–4), pp. 260-278.
UN-SPIDER Knowledge Portal – Space-based Information for Disaster Management and Emergency Response, UN Office for Outer Space Affairs, 2016, Recommended Practice: Flood Mapping, Space Research Institute NASU-SSAU Ukraine, http://www.un-spider.org/advisory-support/ recommended-practices/recommended-practice-flood-mapping (17 Apr. 2016).
Yang, G., Li, B., Gao, F., Xu, Q., 2013. Ship Detection from Optical Satellite Images Based on Sea Surface Analysis. IEEE Geoscience and Remote Sensing Lettters, 11(3), pp. 641-645.
Zhao, Z., Ji, K. F., Xing, X. W., Zou, H. X., Zhou, S. L., 2014a. Ship Surveillance by Integration of Space-borne SAR and AIS-Review of Current Research. Journal of Navigation, 67(1), pp. 177-189.
Zhao, H. Y., Wang, Q., Wu, W. W., Wang, Q. P., Jiao, S. H; Yuan, N. C., 2014b. Hierarchical vessel classifier based on multifeature joint matching for high-resolution inverse synthetic aperture radar images. Journal of Applied Remote Sensing, 8. The International Archives of the Photogrammetry, Remote Sensing and Spatial Information Sciences, Volume XLI-B8, 2016