Using complex networks to characterize international business cycles.
Texto
Imagem
Documentos relacionados
Por fim, indo de encontro as pesquisas realizadas no âmbito deste estudo, considera-se o índice WBGT como uma ferramenta de triagem, a fim de identificar a existência ou
Para a população local e regional a atividade florestal trouxe melhorias: as pessoas aderiram aos novos padrões de trabalho, ele- vando os índices de emprego e renda; passaram a
The G group of most advanced economies in the world will record in a GDB rise of more than %, thus arriving at the fastest pace of growth recorded following. On the
Bat assemblages were sampled with mist nets in central Brazilian Amazonia, across a mosaic of várzea, igapó, and terra firme forests in the low and high-water seasons, and it
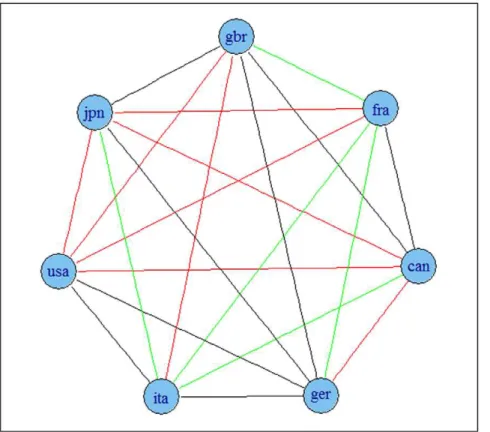
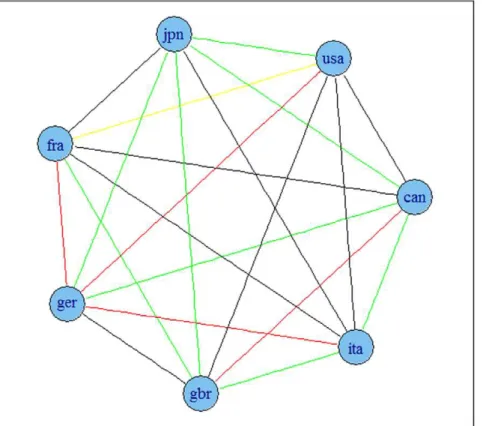
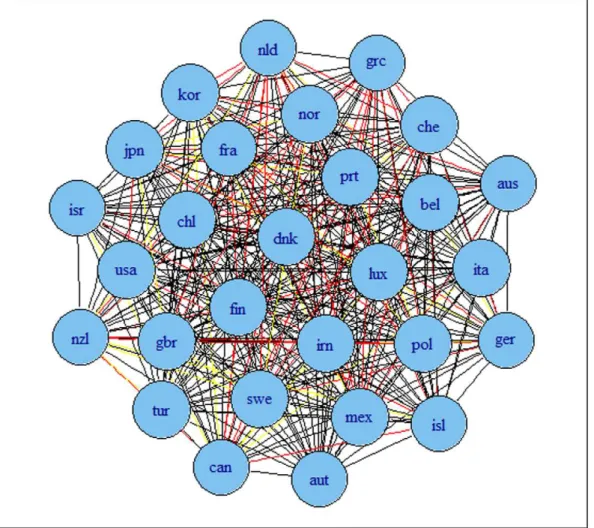
economies and labour markets, the social ties of agents (day-to-day life,. family…) – explain the social embeddedness
We ran through all eight markets' stock index data using out myopic KAII neural network and we got different results from different markets. Most of the
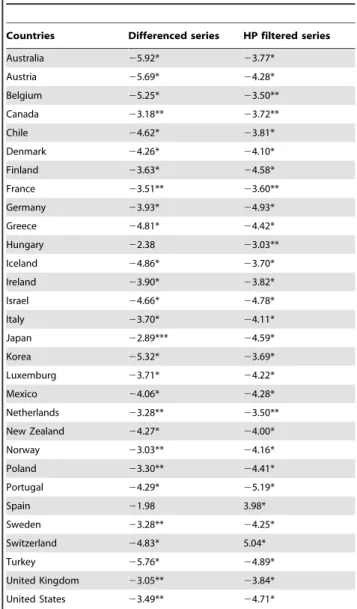
Using time–series data drawn from the United Nations national accounts databases, this study applies the econometric Granger causality methodology to investigate the
O Estágio Pedagógico, sendo realizado, na realidade do contexto escolar, para além de me dar a conhecer, o como é trabalhar numa escola, em todas as suas
