Vicarious Calibration Based Cross Calibration of
Solar Reflective Channels of Radiometers Onboard
Remote Sensing Satellite and Evaluation of Cross
Calibration Accuracy through Band-to-Band Data
Comparisons
Kohei Arai
Graduate School of Science and Engineering Saga University
Saga City, Japan
Abstract—Accuracy evaluation of cross calibration through band-to-band data comparison for visible and near infrared radiometers which onboard earth observation satellites is conducted. The conventional cross calibration for visible to near infrared radiometers onboard earth observation satellites is conducted through comparisons of band-to-band data of which spectral response functions are overlapped mostly. There are the following major error sources due to observation time difference, spectral response function difference in conjunction of surface reflectance and atmospheric optical depth, observation area difference. These error sources are assessed with dataset acquired through ground measurements of surface reflectance and optical depth. Then the accuracy of the conventional cross calibration is evaluated with vicarious calibration data. The results show that cross calibration accuracy can be done more precisely if the influences due to the aforementioned three major error sources are taken into account.
Keywords—vicarious calibration; cross calibration; visible to near infrared radiometer; earth observation satellite; remote sensing; radiative transfer equation;
I. INTRODUCTION
Calibration of solar reflective wavelength coverage of mission instruments onboard remote sensing satellites is research subject for many years [1]-[17]. It is obvious that onboard calibration sources are degraded for time being as Dinguirard and Slater (1999) argued. It cannot be monitored even if onboard monitoring system is used for it because monitoring systems are degraded. Therefore, other calibrations, vicarious and cross calibrations are required. Reflectance based vicarious calibration is not accurate enough for monitoring the degradation. That is same thing for cross calibration.
Usually, the conventional cross calibration can be done through comparisons of band-to-band data of which spectral response functions are overlapped mostly. There are the following major error sources due to observation time difference, spectral response function difference in
conjunction of spectral surface reflectance and spectral atmospheric optical depth, observation area difference. These error sources are assessed with dataset acquired through ground measurements of spectral surface reflectance and spectral optical depth. Then the accuracy of the conventional cross calibration is evaluated with vicarious calibration data.
Several researchers investigated cross calibration. Teillet, Fedosejevs, Thome, and Barker (2007) investigated impact of spectral response difference effect between sensors as quantitative indication using simulated data of observation [19]. The effect is called SBDE (Spectral Band Difference Effect) in this research. Twenty sensors were considered in the simulation together with some ground types, various combinations of atmospheric states and illumination geometries. They argued, overall, if spectral band difference effects (SBDEs) are not taken into account, the Railroad Valley Playa site is a ’good ’ground target for cross calibration between most but not all satellite sensors in most but not all spectral regions investigated. ’Good ’is denoted as SBDEs within 3%.
Liu, Li, Qiao, Liu, and Zhang (2004) developed a new method for cross calibration, and then applied the method to sensors Multi-channel Visible Infrared Scanning radiometers (MVIRS) and Moderate Resolution Imaging Spectro-radiometer (MODIS) [18]. They argued,“'An error analysis indicates that the calibration is accurate to within 5%, which is comparable to, or better than, the vicarious calibration method. The method considers surface bidirectional reflectance distribution function (BRDF) mainly. BRDF indicates distribution of angle of reflection depend on an angle of incidence of illumination on the surface. In these researches, differences of SRF do not be considered. If the impact of its difference can be considered on cross calibration, differences between observed data can be explained more exactly and we can implement cross calibration by higher reliability.
with onboard calibration sources [20], vicarious calibration data as well as cross calibration. MODIS is onboard same platform and is calibrated with the aforementioned several types of data [21]. This situation is same thing for MISR [22] and ETM+ onboard the different platform, Landsat-7 [23].
The method proposed here is to check a reliability of the calibration sources through vicarious and cross calibrations for validations of these calibration accuracies. Namely, vicarious calibration requires spectral surface reflectance measurements and spectral optical thickness measurements. By using these ground based acquired data, cross calibration is conducted to improve a reliability of the calibration sources through comparison of vicarious calibration data. The results show that cross calibration accuracy can be done much more precisely if the influences due to the aforementioned three major error sources are taken into account.
The following section describes the proposed cross calibration method together with research background followed by some experiments. Then conclusion is described together with some discussions.
II. PROPOSED CROSS CALIBRATION METHOD
A. Research Background
The proposed cross calibration method is based on improvement of reliability of calibration accuracy through cross comparison to the vicarious calibration. The conventional cross calibration can be done with cross comparison between two visible to near infrared radiometer data. Therefore, cross calibration coefficients are essentially relative value. Cross calibration may be affected by the difference of wavelength coverage of the different visible to near infrared radiometers in conjunction with spectral surface reflectance and spectral optical depth, the difference between Instantaneous Field of View: IFOV, and the registration error between two visible to near infrared radiometer pixels and is not so good in terms calibration accuracy.
B. Example of Cross Calibration
The mission instrument in concern is VNIR: Visible to Near Infrared Radiometer of ASTER: Advanced Spectrometer for Thermal Emission and Reflectance onboard Terra satellite. Other instruments of which wavelength coverage are overlapped are onboard the same Terra satellite. Namely, the wavelength coverage of MODIS and MISR are overlapped with ASTER/VNIR. The wavelength coverage of these mission instruments are shown in Table 1 together with IFOV: Instantaneous Field of View. Other than these, the wavelength coverage of ETM+ onboard Landsat-5 is also overlapped with that of ASTER/VNIR. Therefore, cross calibration can be done between ASTER/VNIR and MODIS, MISR, ETM+. In MISR, these wavelengths are center wavelength of band. MISR bandwidth in Green, Red, and NIR are 0.028, 0.022, 0.039 micrometer, respectively.
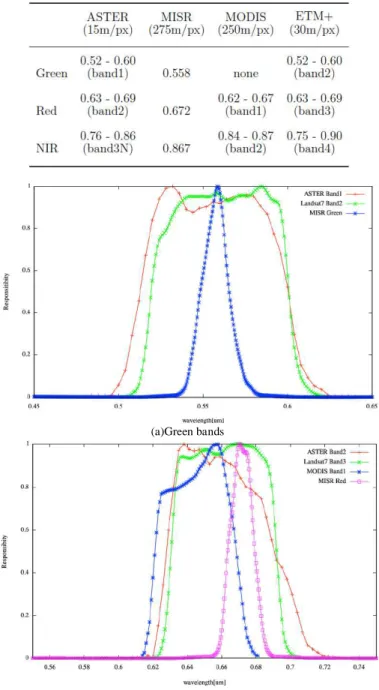
Spectral response functions of these instruments are shown in Figure 1. Figure 1 (a) shows spectral responses for Green bands of the three mission instruments in concern while Figure (b) shows those for Red bands.
Furthermore, Figure 1 (c) shows those for Near Infrared bands. Band width and center wavelength are different each other.
Wavelength Coverage of Visible to Near Infrared Radiometers for Cross Calibration in Unit of Micrometer Therefore, influence due to the difference of spectral response functions have to be taken into account. These data are available from the urls listed in Table 2.
Although the data acquisition time of ASTER/VNIR is totally equal to these of MISR, and MODIS because these instruments are onboard the same satellite, Terra, ETM+ onboard Landsat-5 differs from the ASTER/VNIR for about 30 minutes.
TABLE I. MAJOR SPECIFICATION OF FOUR RADIOMETERS IN CONCERN FOR CROSS CALIBRATION BETWEEN ASTER/VNIR AND THE OTHER THREEE
RADIOMETRS
(a)Green bands
(c)Near Infrared bands
Fig.1. Comparison among the spectral response functions of ASTER/VNIR, MODIS, MISR, and ETM+
TABLE II. URLS OF WHICH VISIBLE TO NEAR INFRARED RADIOMETER
DATA CAN BE DOWNLOAD
Other than these, registration error has to be taken into account in cross calibration. Figure 2 shows the illustrative view of the registration error between the pixels of ASTER/VNIR and the other instruments.
Fig.2. Registration error
Registration of the pixel of ASTER/VNIR in concern does not match perfectly to a corresponding pixel of the other mission instruments. Also, IFOV of ASTER/VNIR differs from those of the other mission instruments.
C. Coventional Cross Calibration
In the conventional cross calibration, the corresponding pixels of ASTER/VNIR are compared to those of the other instruments in unit of radiance. The difference of radiance between ASTER/VNIR and the other instruments is cross calibration coefficients for each band.
It is difficult to take into account the difference of spectral
response functions, the difference of acquisition time difference. Influence due to the difference of IFOV and registration error can be taken into account. Therefore, cross calibration coefficients are essentially relative values.
D. Vicarious Calibration
Vicarious calibration coefficients, on the other hand, is defined as the difference between ASTER/VNIR pixel value derived radiance and the estimated radiance derived from the radiative transfer equation with the input parameters of surface reflectance measured on the ground, refractive index and size distribution estimated with atmospheric optical depths measured on the ground at the several wavelengths for aerosol scattering and absorption, and Rayleigh scattering derived from measured atmospheric pressure. Therefore, vicarious calibration coefficients are essentially absolute values.
E. Proposed Cross Calibration
The cross calibration method proposed here provides absolute calibration coefficients with measured reflectance and optical depth which are used for vicarious calibration. Top of the atmosphere: TOA radiance is estimated with radiative transfer equation with the measured surface reflectance and optical depth through convolution with the spectral response functions of the visible to near infrared radiometers in concern. Then cross comparison is made between the estimated TOA radiance of the visible to near infrared radiometers in concern.
Vicarious calibration, on the other hand, uses measured spectral reflectance and spectral optical depth. Therefore, vicarious calibration coefficients are essentially absolute value and are comparatively good in terms calibration accuracy. The difference between the proposed cross calibration and vicarious calibration methods is comparison processes. After the vicarious calibration for different visible to near infrared radiometers, vicarious calibration coefficients of visible to near infrared radiometer are compared each other in the proposed cross calibration.
III. EXPERIMENTS
A. Experiments Conducted
Field campaigns are conducted at the following there test sites,
IV: Ivanpah Playa (35:34N, 115:24W,790m), California AL: Alkali Lake (37:51N, 117:25W, 1463m), Nevada
RV: Railroad Valley Playa (38:30N, 115:41N, 1440m) Nevada
Table 3 shows the dates of the field campaigns. Target pixel can be identified through visual perception of blue tarp on the test sites. Thus the test site locations are precisely identified with good registration accuracy.
B. Surface Reflectance
TABLE III. THE DATES OF THE FIELD CAMPAIGNS
The first column shows the days after launch
C. ASTER/VNIR Images
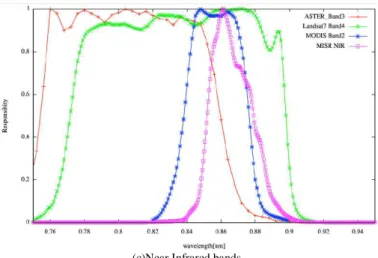
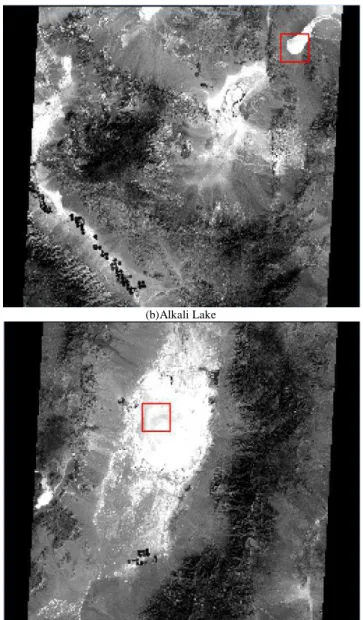
Figure 3 shows examples of the ASTER/VNIR NIR band images of three test sites. Red square shows the test site locations.
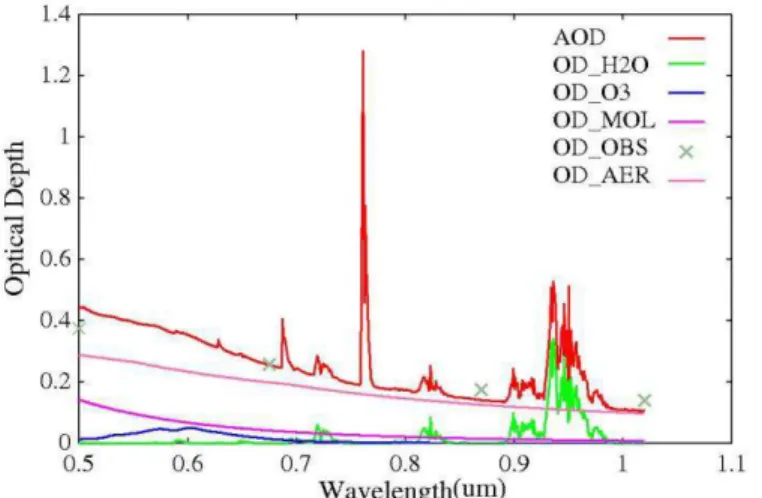
D. Atmospheric Optical Depth
The atmospheric optical depth is measured at the test sites. Figure 7 shows examples of the measured atmospheric optical depth. In the atmosphere, there are absorption due to water vapor, ozone and aerosols together with scattering due to the atmospheric molecules, aerosols. Atmospheric Optical Depth: AOD (optical thickness) in total, Optical Depth: OD due to water vapor (H2O), ozone (O3), molecules (MOL), aerosols
(AER), and real observed OD (OBS) are plotted in Figure 7.
(a)Ivanpah Playa
(b)Alkali Lake
(c)Railroad Valley Playa
Figure 5 Examples of the ASTER/VNIR NIR band images of three test site
Figure 7 Example of observed atmospheric optical depth in total and the best fit curves of optical depth due to water vapor, ozone, molecules, and aerosols calculated with MODTRAN of atmospheric radiative transfer software code..
E. Vicarious Calibration
Vicarious calibration coefficients are obtained based on radiative transfer software code of MODTRAN with the field campaign data of surface reflectance, total column ozone and water vapor, as well as atmospheric pressure together with aerosol parameters; refractive index and size distribution derived from sky radiometer data and atmospheric optical depth. TOA radiance is estimated through the aforementioned procedure and then is compared to the ASTER/VNIR derived radiance results in calculation of vicarious calibration coefficients. Table 4 shows the calculated vicarious calibration data.
TABLE IV. THE VICARIOSU CALIBRATION COEFFICIENTS
(a)Ivanpah Playa
Band Green
Day DAL RCC_vc
2000/06/04 169 0.89570
2001/06/07 537 0.79536
2002/01/17 757 0.76413
2005/12/11 2148 0.66320
2006/08/08 2424 0.84946
2006/11/28 2536 0.84655
2007/09/12 2824 0.77642
2008/09/14 3192 0.73081
2008/11/03 3242 0.64953
2009/09/01 3544 0.76699
2010/09/20 3928 0.80678
2011/08/22 4265 0.83696
Band Red
Day DAL RCC_vs
2000/06/04 169 0.93470
2001/06/07 537 0.81293
2002/01/17 757 0.80310
2005/12/11 2148 0.69795
2006/08/08 2424 0.85075
2006/11/28 2536 0.85321
2007/09/12 2824 0.76921
2008/09/14 3192 0.75591
2008/11/03 3242 0.69026
2009/09/01 3544 0.78700
2010/09/20 3928 0.79278
2011/08/22 4265 0.94690
Band NIR
Day DAL RCC_vs
2000/06/04 169 1.00010
2001/06/07 537 0.87390
2002/01/17 757 0.90067
2005/12/11 2148 0.78288
2006/08/08 2424 0.93711
2006/11/28 2536 0.95591
2007/09/12 2824 0.74768
2008/09/14 3192 0.79275
2008/11/03 3242 0.73340
2009/09/01 3544 0.81375
2010/09/20 3928 0.89448
2011/08/22 4265 1.00322
(b)Alkali Lake
Band Green
Day DAL RCC_vc
2005/12/16 2159 0.69600471
2007/09/17 2829 0.66371092
2008/09/19 3197 0.84800178
2009/09/06 3549 0.774319
2010/09/25 3933 0.67612548
2011/08/27 4270 0.60813229
Band Red
Day DAL RCC_vs
2005/12/16 2159 0.69859583
2007/09/17 2829 0.77056662
2008/09/19 3197 0.7507701
2009/09/06 3549 0.79646567
2010/09/25 3933 0.70989962
2011/08/27 4270 0.69222309
Band NIR
Day DAL RCC_vs
2005/12/16 2159 0.80871349
2007/09/17 2829 0.81529287
2008/09/19 3197 0.79725186
2009/09/06 3549 0.90928185
2010/09/25 3933 0.85319343
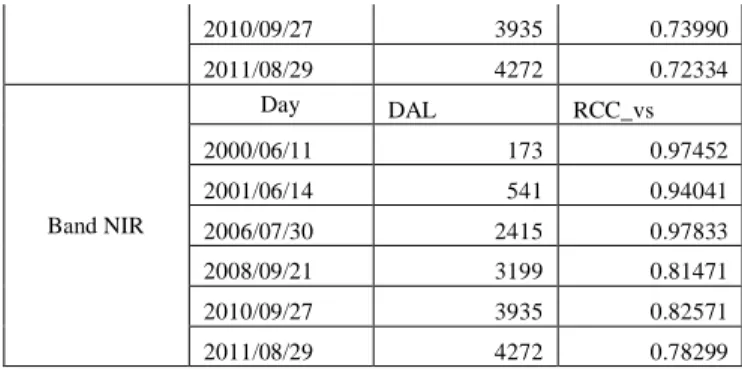
2011/08/27 4270 0.85718958 (c)Railroad Valley Playa
Band Green
Day DAL RCC_vc
2000/06/11 173 0.88235
2001/06/14 541 0.80184
2006/07/30 2415 0.94137
2008/09/21 3199 0.76877
2010/09/27 3935 0.74499
2011/08/29 4272 0.70407
Band Red
Day DAL RCC_vs
2000/06/11 173 0.89655
2001/06/14 541 0.84616
2006/07/30 2415 0.89336
2010/09/27 3935 0.73990
2011/08/29 4272 0.72334
Band NIR
Day DAL RCC_vs
2000/06/11 173 0.97452
2001/06/14 541 0.94041
2006/07/30 2415 0.97833
2008/09/21 3199 0.81471
2010/09/27 3935 0.82571
2011/08/29 4272 0.78299
DAL denotes the days after launch.
In accordance with the days after launch, Radiometric Calibration Coefficient: RCC is decreased as exponential function. Namely, sensitivity of ASTER/VNIR is degraded for time being. There is test site dependency and wavelength dependency. The most degraded band is band 1 followed by band 2 and band 3 depending on the corresponding wavelength. Namely, sensitivity degradation is negatively proportional to the wavelength (degradation of shorter wavelength is much greater than that of longer wavelength).
Sensitivity degradation foe the Alkali test site, on the other hand, is much significant in comparison to the other two test sites, sensitivity degradation for the other two sites indicate almost same though. One of the biggest reasons for this is sensor saturations. Due to the fact that the surface reflectance at Alkali test site is highest comparing to the others, ASTER/VNIR, in particular, band 1 and 2 are saturated. Sensitivity degradation should be same for all the test sites. Therefore, vicarious calibration coefficients for in particular band 1 and 2 derived from the Alkali test site would be better to forget.
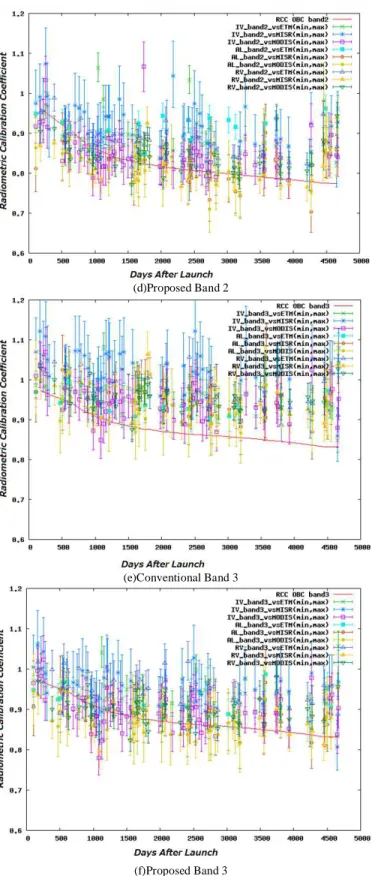
F. Cross Calibration Coefficients
Figure 8 (a), (c), (e) shows the Radiometric Calibration Coefficient: RCC of the conventional cross calibration while Figure 8 (b), (d), (f) shows those for the proposed cross calibration. Red solid line in the figure shows RCC derived from Onboard Calibration: OBC data. OBC data derived RCC differs from both the conventional and the proposed cross calibration RCC. These cross calibration coefficients are summarized with their averaged RCC and Standard Deviation: SD together with their Confidence Interval: CI at 95% of confidence level as shown in Table 5. Also Root Mean Square Difference: RMSD between vicarious RCC and the conventional cross calibration RCC as well as the proposed cross calibration RCC is shown in Table 6.
As shown in Table 6, RMSD between the vicarious RCC and the proposed cross calibration RCC is less than that between the vicarious RCC and the conventional cross calibration RCC. Therefore, it is said that the proposed cross calibration method is superior to the conventional cross calibration method obviously. Percent difference of RMSD between the conventional and the proposed cross calibration is shown in Table 7.
It may said that the proposed cross calibration method shows 6 to 89% better cross calibration accuracy in comparison to the conventional cross calibration.
(a)Conventional Band 1
(b)Proposed Band1
(d)Proposed Band 2
(e)Conventional Band 3
(f)Proposed Band 3
Figure 8 Comparison of cross calibration RCC between the conventional and the proposed cross calibration methods
TABLE V. SUUMARY OF CROSS CALIBRATION COEFFICIENTS
(a)Cross RCC for Green and Red bands
(b)Cross RCC for NIR band
TABLE VI. AVERAGED ROOT MEAN SQUARE DIFFERENCE BETWEEN VICARIOUS CALIBRATION RCC AND CROSS CALIBRATION RCC
Conventional Proposed
Site ETM+ MISR MODIS ETM+ MISR MODIS Ivanpah 0.0733 0.0798 0.0338 0.0690 0.0645 0.0169 Alkali 0.0280 0.0625 - 0.00312 0.0387 - Railroad 0.0889 0.0194 0.0619 0.0807 0.0031 0.0346
TABLE VII. PERCENT DIFFERENCE OF RMSD BETWEEN CONVENTIONAL AND PROPOSED CROSS RCC
% Difference between Conventional and Proposed Cross RCC
Site ETM+ MISR MODIS
Ivanpah 5.866 19.173 50.000
Alkali 88.857 38.080 -
Railroad 9.224 84.021 44.103
IV. CONCLUSION
The results show that cross calibration accuracy can be done more precisely if the influences due to the aforementioned three major error sources are taken into account.
ACKNOWLEDGMENT
The author would like to thank Dr. Satoshi Tsuchida and his colleague of The National Institute of Advanced Industrial Science and Technology (AIST), and Dr. Fumihiro Sakuma and his colleague of The Japan Space Systems: JSS people for their support to this research works. The author also would like to thank Mr. Yuichi Sarusawa of Graduate School of Saga University for his efforts to conduct cross calibration experiments.
REFERENCES
[1] Arai,K., Calibration /intercalibration of multi-sensor for satellites, Advances in Space Research, Vol.16, No.10, pp.125-128, A31-002, July 1994.
[2] P.Slater, K.Thome, A.Ono, F.Sakuma, Kohei Arai, F.Palluconi, H.Fujisada, Y.Yamaguchi and H.Kieffer, Radiometric Calibration of ASTER Data, Journal of Remote Sensing Society of Japan, Vol.15, No.2, pp.16-23, Jun.1994.
[3] A.Ono, F.Sakuma, Kohei Arai, Y.Yamaguchi, H.Fujisada, P.Slater, K.Thome, F.Palluconi and H.Kieffer, Pre-filight and In-flight Calibration Plan for ASTER, Journal of Atmospheric and Oceanic Technology, Vol.13, No.2, pp.321-335, Apr.1995.
[4] Kohei Arai, Inflight Test Site Cross Calibration Between Mission Instruments Onboard Same Platform, Advances in Space Research, Vol.19, No.9, pp.1317-1324, Jul.1997.
[5] K.Thome, K.Arai et al., ASTER Preflight and Inflight Calibration and Validation of Level 2 Products, IEEE Trans.on Geoscience and Remote Sensing, Vol.36, No.4, 1161-1172, Sep.1998.
[6] K.Thome, S.Schiller, J.Conel, K.Arai and S.Tasuchida, Results of the 1996 EOS vicarious calibration joint campaign at Lunar Lake Playa, Nevada(USA), Metrologia, Vol.35, pp.631-638, Jan.1999.
[7] K.Arai, Error budget analysis of cross calibration method between ADEOS/AVNIR and OCTS, Advances in Space Research, Vol.23, No.8, pp.1385-1388, June 1999.
[8] K.Arai, Preliminary vicarious calibration for EOS-AM1/ASTER with field campaign, Advances in Space Research, Vol.23, No.8, pp.1449-1457, June 1999.
[9] Kohei Arai and H.Tonooka, Radiometric performance evaluation of ASTER/VNIR, SWIR and TIR, IEEE Trans. on GeoScience and Remote Sensing, 43,12,2725-2732, 2005.
[10] Kohei Arai, Vicarious calibration for solar reflection channels of radiometers onboard satellites with deserted area of data, Advances in Space Research, 39, 1, 13-19, 2007.
[11] Kurtis Thome, Kohei Arai, Satoshi Tsuchida and Stuart Biggar, Vicarious calibration of ASTER via the reflectance based approach, IEEE transaction of GeoScience and Remote Sensing, 46, 10, 3285-3295, 2008.
[12] Chrysoulakis,Abrams, Feidas and Kohei Arai, Comparison of Atmospheric correction methods using ASTER data for the area of Crete, Greece, International Journal of Remote Sensing, 31,24,6347-6385,2010.
[13] Ramachandran, Justice, Abrams(Edt.),Kohei Arai et al., Land Remote Sensing and Global Environmental Changes, Part-II, Sec.5: ASTER VNIR and SWIR Radiometric Calibration and Atmospheric Correction, 83-116, Springer 2010.
[14] Arai, K., & Terayama, Y. (2000). An Experimental Study on Cross Calibration of ADEOS / AVNIR and the Visible Channels of OCTS. Journal of Remote Sensing Society of Japan, 20 (2), 60{68.
[15] Cachorro, V. E., Frutos, A. M. D. E., Aplicada, D. D. F., Gonzalez, M. J., & Electrica, D. D. I. (1993). Analysis of the relationships between Junge size distribution and angstrom _ turbidity parameters from spectral measurements of atmospheric aerosol extinction. Atmospheric Environment, 27A(10), 1585{1591.
[16] Chandrasekhar, S. (1960). Radiative transfer (1st ed.). New York, US: Dover Publications, Inc.
[17] Dinguirard, M., & Slater, P. (1999). Calibration of space-multispectral imaging sensors: A review. Remote Sensing of Environment, 4257 (98), 194{205. Earth Remote Sensing Data Analysis Center. (2005). ASTER User's Guid Part I General (Ver.4.0 ed.).
[18] Liu, J.-J., Li, Z., Qiao, Y.-L., Liu, Y.-J., & Zhang, Y.-X. (2004, December). A new method for cross-calibration of two satellite sensors. International Journal of Remote Sensing, 25 (23), 5267{5281. Retrieved from
http://www.tandfonline.com/doi/abs/10.1080/01431160412331269779 doi: 10.1080/01431160412331269779
[19] Teillet, P. M., Fedosejevs, G., Thome, K., & Barker, J. L. (2007, October). Impacts of spectral band difference effects on radiometric cross-calibration between satellite sensors in the solar-reflective spectral domain. Remote Sensing of Environment, 110 (3), 393{409. doi: 10.1016/j.rse.2007.03.003
[20] Tsuchida, S., Sakuma, H., & Iwasaki, A. (2004). Equations for ASTER radiometric calibration ver.0.20. Retrieved 2013/01/24, from http://staff.aist.go.jp/s.tsuchida/aster/cal/info/equation/index.html [21] Xiong, X., Che, N., & Barnes, W. L. (2006). Terra MODIS On-Orbit
Spectral Characterization and Performance. IEEE transactions on Geoscience and Remote Sensing, 44 (8), 2198{2206.
[22] C.J. Brueggc and D.J. Diner, “Instrument verification tests on the Multi -angle imaging Spectro-Radiometer (MISR),” in Earth Observing Systems II, SPIE 3117, San Diego, CA, 28-29 July 1997.
[23] P.M. Teillet, J.L. Barker, B.L. Markham, R.R Irish, G. Fedosejevs, J.C. Storey, Radiometric cross-calibration of the Landsat-7 ETM+ and Landsat-5 TM sensors based on tandem data sets, Remote Sensing of Environment 78 (2001) 39– 54
AUTHORS PROFILE