Evidence for the Robustness of Protein Complexes to
Inter-Species Hybridization
Jean-Baptiste Leducq, Guillaume Charron, Guillaume Diss, Isabelle Gagnon-Arsenault, Alexandre K. Dube´, Christian R. Landry*
Institut de Biologie Inte´grative et des Syste`mes, De´partement de Biologie, PROTEO, Pavillon Charles-Euge`ne-Marchand, Universite´ Laval, Que´bec City, Canada
Abstract
Despite the tremendous efforts devoted to the identification of genetic incompatibilities underlying hybrid sterility and inviability, little is known about the effect of inter-species hybridization at the protein interactome level. Here, we develop a screening platform for the comparison of protein–protein interactions (PPIs) among closely related species and their hybrids. We examinein vivo the architecture of protein complexes in two yeast species (Saccharomyces cerevisiae and
Saccharomyces kudriavzevii) that diverged 5–20 million years ago and in their F1 hybrids. We focus on 24 proteins of two large complexes: the RNA polymerase II and the nuclear pore complex (NPC), which show contrasting patterns of molecular evolution. We found that, with the exception of one PPI in the NPC sub-complex, PPIs were highly conserved between species, regardless of protein divergence. Unexpectedly, we found that the architecture of the complexes in F1 hybrids could not be distinguished from that of the parental species. Our results suggest that the conservation of PPIs in hybrids likely results from the slow evolution taking place on the very few protein residues involved in the interaction or that protein complexes are inherently robust and may accommodate protein divergence up to the level that is observed among closely related species.
Citation:Leducq J-B, Charron G, Diss G, Gagnon-Arsenault I, Dube´ AK, et al. (2012) Evidence for the Robustness of Protein Complexes to Inter-Species Hybridization. PLoS Genet 8(12): e1003161. doi:10.1371/journal.pgen.1003161
Editor:Jianzhi Zhang, University of Michigan, United States of America
ReceivedJuly 7, 2012;AcceptedOctober 26, 2012;PublishedDecember 27, 2012
Copyright:ß2012 Leducq et al. This is an open-access article distributed under the terms of the Creative Commons Attribution License, which permits unrestricted use, distribution, and reproduction in any medium, provided the original author and source are credited.
Funding:This work was supported by a Natural Sciences and Engineering Research Council of Canada (NSERC) discovery grant to CRL and partly by a Genome Quebec grant, Human Frontier Science Program (HFSP) grant RGY0073/2010, and Canadian Institute of Health Research (CIHR) grant GMX-191597. J-BL was supported by a fellowship from the Fonds de Recherche en Sante´ du Que´bec (FRSQ). The funders had no role in study design, data collection and analysis, decision to publish, or preparation of the manuscript.
Competing Interests:The authors have declared that no competing interests exist.
* E-mail: christian.landry@bio.ulaval.ca
Introduction
Identifying the molecular processes underlying species incom-patibilities is a fundamental issue in evolutionary biology. Charles Darwin first suggested that the inviability and sterility often occurring after species hybridization could result from mecha-nisms other than the differences observed between parents and morphological disorders in the descendants [1]. Several theoretical models have since been developed to address how differences leading to incompatibilities may accumulate between species [2–6] and genetic mapping of such incompatibilities [7–10] has uncovered some molecular mechanisms by which they may take place. In theory, any system in which molecules or genes interact with each other to perform a function and that co-evolve within species, could give rise to such incompatibilities. Most studies on molecular incompatibilities have so far been performed using genetic approaches to identify the genes involved in hybrid lethality and sterility, for instance, inDrosophila[7–9] or in hybrid sterility in yeasts [10]. In a cell, all processes are controlled and mediated by protein-protein interactions (PPIs). Stable PPIs form protein complexes that are the workhorses of the cell and perform fundamental tasks such as DNA replication, repair and transcrip-tion, cellular transport or cytoskeleton architecture [11–16]. More transient interactions are involved, for instance, in cell signaling events such as phosphorylation cascades [17]. Proteins are
suggested to co-evolve within species over-time as a response of selection to maintain these interactions [18–20], and this co-evolution is so important that it can be used to infer PPIs [20]. Each pairwise PPI therefore represents an opportunity for incompatibilities to accumulate between closely related species, although there is limited empirical evidence for this phenomenon [21]. Whether protein divergence can result in incompatibilities in protein complexes in hybrids is largely unknown because we lack experimental systems to directly measure physical interactions in living cells in closely related species and in inter-species hybrids.
entirely sterile [27,28], which makes standard genetic mapping approaches inefficient to identify incompatibilities systematically.
Several techniques are available for interactome mapping and could be applied to the screening of abnormal PPIs directly in viable F1 hybrids. A technique that would be particularly powerful would integrate all factors that affect PPIs such as protein abundance and localization. It would allow detecting PPIsin vivo, among proteins expressed at their endogenous levels and at their normal cellular localization. One such method has recently been developed for the budding yeast and is based on the Protein-fragment Complementation Assay (PCA) technology [13,29]. This technique detects structural relationships among proteins, as the C-termini of both proteins need to be within 80 Angstroms of each other for PPI detection [13]. The signal detected also reflects the amount of protein complexes formed [30]. Here, we set out to adapt the PCA based on the dihydrofolate reductase (DHFR),
recently developed for Scer [13], to other species of the
Saccharomyces sensu stricto group, which covers the same range of molecular divergence as that between birds and mammals [22]. Using this tool, we directly test whether 5–20 millions years of evolution result in protein incompatibility between species,i.e.in gain or loss of PPIs in the hybrid background as compared to the parental species.
We identified two protein complexes that can serve as models, namely the nuclear pore complex (NPC) and the RNA polymerase II (RNApII). We selected these two complexes because they have distinct functions and contrasting patterns of evolution. The NPC performs selective molecule transport across the nuclear envelope and its overall structure is conserved among eukaryotes [31], although the precise organization diverges among distantly related species [32]. The RNApII is a core enzyme that performs DNA transcription and its structure is fully conserved in eukaryotes [33]. The structure of these complexes has either been well established or extensively modeled. InScer, the NPC is a circular assembly of about 500 proteins (nucleoporins) arranged in eight identical substructures, each constituted of about 30 nucleoporins, most of them being duplicated in a substructure [34]. The RNApII is composed of 12 interacting subunits [35]. These complexes were
at least partially detectedin vivoinScerby DHFR-PCA [13] and in agreement with structural information provided by other tech-niques [24]. A number of characteristics make these complexes appropriate models to investigate the impact of hybridization on PPIs. First, proteins belonging to the same complex evolve at equivalent rates inSaccharomyces species (Figure 1), reflecting the potential coevolution of subunits within NPC and RNApII, as expected from previous reports [36]. Further, the NPC proteins are at the high end of the spectrum of divergence among the Saccharomyces species, whereas RNApII proteins show stronger conservation (Figure 1). Second, the NPC and RNApII represent contrasted situations because their respective functions require different levels of complex architecture flexibility. For instance, in Scer, most of RNApII subunits are essential for cell viability [37] and all are required for transcription [35], whereas about one third of nucleoporin genes are non-essential [37] and many NPC proteins perform redundant structural functions and are thus likely interchangeable [34]. Also, theScerNPC includes several recent genes which originated during the whole yeast genome duplication [38]. All these observations suggest that PPIs in the NPC would be more likely to diverge among species. A lack of changes in the architecture of the NPC between species or in the hybrid would suggest that protein complexes can be robust to protein divergence.
Results
The DHFR-PCA permits detection of PPIs across the
Saccharomyces sensu strictospecies complexes
We first tested whether we could detect PPIs using the DHFR-PCA inS. paradoxus(Spar),S. uvarum(Suva) andS. kudriavzevii(Skud) and determined what would be the optimal experimental
conditions for measuring PPIs in vivo. The DHFR-PCA assay is
based on the reconstitution of the DHFR enzyme (see Figure S1A– S1B). In order to measure the signal to noise ratio of this assay in the four species, we engineered a strong PPI reporter by fusing the DHFR fragments (F[1,2] and F[3]) downstream of the coding sequence of homodimerizing residues of the GCN4 parallel coiled-coil leucine zipper [39]. Overall, we observed the strongest signal-to-noise ratio (growth of positive/negative controls) in Scer and Skudand in conditions that are standard for theScerDHFR-PCA (Figure 2A). We thereafter focused our study onScerand Skudto ensure optimal conditions to detect PPIs in these species and in their hybrids. The two species show an average of 16.4% pairwise protein divergence (Figure 1), which is in the same order of magnitude than what it is observed between birds and mammals [22]. Because no hybridizable species presents such a protein
divergence level in plants or animals, Scer and Skud offer a
conservative system to measure how hybrid protein complexes form in inter-species crosses.
Comparison of protein complexes between species and their hybrids
We set out to compare the architecture of the NPC (15 subunits considered) and the RNApII (9 subunits considered) betweenScer,
Skud and their F1 hybrids. The 24 subunits corresponded to a
subset ofScerproteins, which were showed to be involved in at least one PPI in the considered complexes in Tarrassovet al.[13]. Not allScerstrains were available in the DHFR-PCA collection so we reconstructed them by homologous recombination as described in Tarrassovet al. [13]. We then attempted to construct all of the
equivalent strains (24 in MATa and 24 in MATa) in Skud by
targeting the orthologous genes [40]. All strains were obtained for Scer; 23 and 17 strains were obtained for, respectively,MATaand Author Summary
Figure 1. Protein divergence in the RNApII (black) and the NPC (grey) in theSaccharomyces sensu strictogroup.Evolutionary trees were drawn for all proteins of a complex and are on the same scale (proportion of different amino acids). Distribution of protein divergence betweenScer andSkudwas calculated from multiple-sequence alignments available for 5261 orthologous proteins [23]. Arrows indicate protein divergence covered by the two complexes.
doi:10.1371/journal.pgen.1003161.g001
Figure 2. Optimization of the DHFR-PCA in fourSaccharomycesspecies.(A) Control diploid strains were grown in presence of DMSO (control) and methotrexate (MTX). In the positive controls (+), two zipper protein fragments (white) were fused via a linker (grey) to complementary protein
fragments of the MTX-resistant DHFR (black). Zipper fragments strongly interact, reconstituting the DHFR activity and allowing growth on MTX medium. In the negative controls (2), the absence of interaction (L alone) prevents the DHFR reconstitution and strain growth. Optimal signal was found inScerandSkud. (B) High density arrays were used to screen PPIs inScerandSkud. Each plate contained crosses between 24MATaand 16 MATastrains in three non adjacent replicates. Here, the interaction between Nup159 and Nup116 reconstitutes the DHFR (+) and allows growth of
the colony in both species. Nup159 and Nup60 do not interact directly (2) and strains do not grow on MTX medium. doi:10.1371/journal.pgen.1003161.g002
MATa strains in Skud (Table S1). We then performed a comprehensive screen of PPIs within and between the NPC and RNApII, within species and their hybrids. We crossed allScerand Skud MATastrains with all Scerand Skud MATastrains. Most of interactions between two proteins P1 and P2 were testable in two reciprocal ways (P1 inMATa6P2 inMATavs.P2 inMATa6P1 in
MATa; Figure S2A), which was the case of 276 PPIs. The 24
remaining homomeric interactions (P1 in MATa6P1 in MATa)
were also tested. We compared these PPIs betweenScer,Skudand the inter-specific hybrids, namely hybrid 1 (Scer MATa6Skud MATa) and hybrid 2 (Skud MATa6Scer MATa), giving a total of 1927 possible combinations (Table S2). In order to evaluate the
interaction between P1 fromScer and P2 from Skud, P1-P2 was
measured in hybrid 1 and P2-P1 in hybrid 2 (Figure S2A). All combinations P1-P2 and P2-P1 were replicated three times. PPIs were measured by estimating colony size in pixels on high quality images of plates (Figure 2B). The DHFR-PCA signal was highly reproducible and the reproducibility was similar for the intra and inter-specific crosses (r = 0.90 to 0.97, p,0.001; Figure S3). Triplicates were averaged, giving a mean growth signal index (SI) for all downstream analyses (data available in Dataset S1). Because SI values associated to a particular protein were sometimes lower when the protein was tagged inMATaorMATa, potentially generating false positive or hide true interactions, we corrected SI values for these haploid strain effects (see Methods and Figures S2B–S2F, S4, S5, S6, S7, data available in Dataset S2).
We defined a threshold (t) above which SI would represent a PPI by comparing the distributions of SI measured among (SA) and within (SW) the NPC and RNApII (Figure S8 and S9), assuming that among complex crosses represent background growth of the colonies, which is well supported by the almost complete absence of physical interactions reported between NPC and RNApII proteins [24]. As all SA values fell belowt<1.4, we
considered SW values above 1.4 to be a conservative threshold (Figure S8 and S9). InScer, 39 out of 54 interactions
(correspond-ing to 82 SW values with SW.t before reciprocal redundant
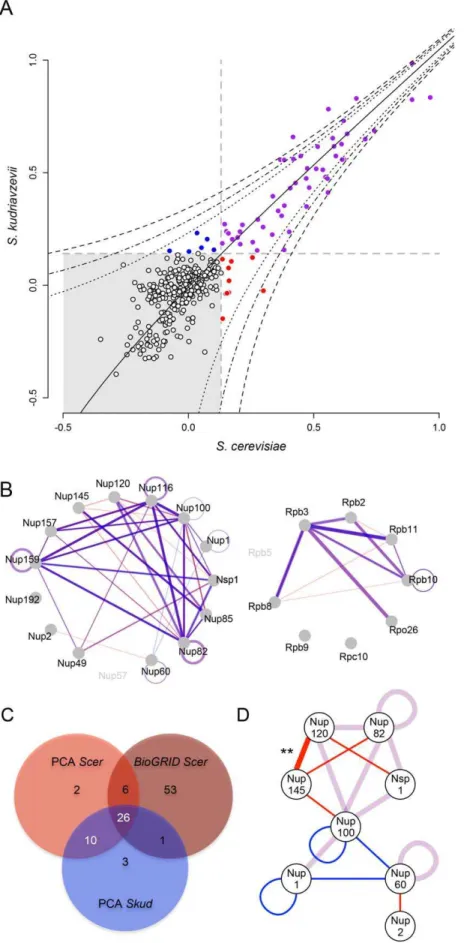
combinations were collapsed) were concordant with physical interactions already reported in this species by independent methods (Figure S10A). Also, SW values measured in Scerwere positively correlated to the number of times a PPI was reported in BioGRID (r= 0.55, p,0.001; Figure S10B). In Scer, PPIs were mostly detected between proteins for which C-termini are close to each other in the case of RNApII (Figure S10C) or corresponded to the architecture of NPC previously defined (Figure S10D). We observed a strong and highly significant correlation between SI values measured in the two species (r= 0.93,p,0.001; Figure 3A), suggesting a high degree of conservation in the protein complexes. Most interactions were shared between species, and SI remained highly correlated between species when only considering these interactions (r= 0.87,p,0.001). Among the 54 PPIs observed in Scer, 44 were comparable withSkudand 36 physical interactions were common to both species (8 in the RNApII, 28 in the NPC, Figure 3A–3C), corresponding to 50 significant SI values before reciprocal redundant combinations were collapsed. The remaining unshared PPIs inScerand Skud(eight and four PPIs respectively) were all close to the detection thresholdtand further examination by regression analysis showed that most of the differences were not significant (Figure 3D). This was the case for three very weak PPI signals found in RNApII inScerbut not in Skud(Figure 3Band
Figure S10C). Other differences involved nucleoporins Nup1,
Nup2 and Nup60 belonging to the subcomplex of the nuclear pore basket, with respectively one and three PPIs specific toScerand Skud(Figure 3D). The structure of this subcomplex is poorly known
[41] mainly because its location at the nuclear side makes unsuccessful the use of most of PPIs detections methods, which was in agreement with weak signals we found for these interactions. Thus, like the differences we found in RNApII, these variations have to be carefully interpreted. Other variations in PPIs involved proteins from the outer ring NPC subcomplex. Four PPIs were absent inSkudand three of them involved interactors of Nup145;
Nup120, Nup82 and Nup100 (Figure 3D). However, the only
statistically significant difference we found was the absence of
Nup120-Nup145 interaction in Skud, which we discuss in-depth
below (Figure 3D).
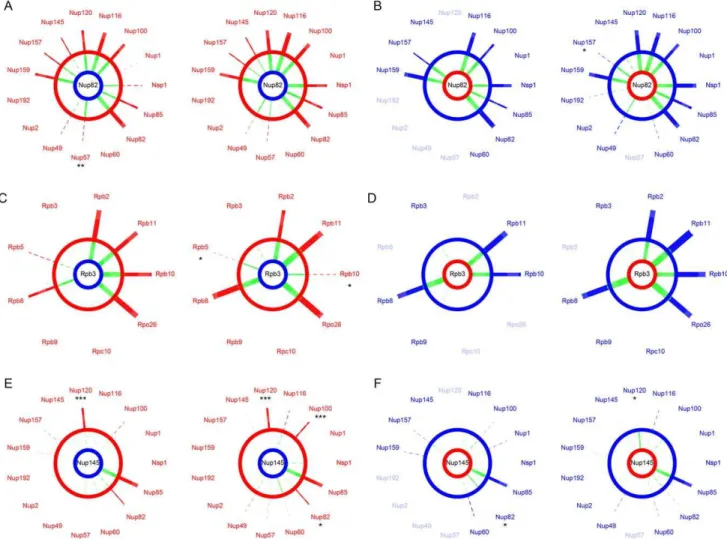
Protein complex architecture in the hybrid background We assessed the extent to which the integrity of the protein complexes was preserved in hybrids by comparing PPIs in their parental background to PPIs in F1 hybrids. In hybrids, protein complexes can be formed with subunits from the two species. Incompatibilities between subunits could directly disrupt interac-tions between the two proteins of interest or indirectly affect the architecture of the complex and disrupt or lead to novel, spurious, unexpected interactions [42]. We considered that an interaction was disrupted or gained in hybrids when its residual value resulting from the species/hybrid comparison was significantly different from the distribution of all residual values pooled together (Figure S2E–S2F). Overall, we found that all interactions that were conserved between parental species were also seen in the hybrids, i.e.no interaction was disrupted specifically in the hybrid. We also found no instance of hybrid-specific interactions. For instance, we found that interactions involving Nup82 in the Scerbackground were fully conserved in hybrids between theSkudNup82 andScer NPC subunits (Figure 4A–4B). Similar observations were made for Rpb3 in RNApII (Figure 4C–4D). Additionally, SI values from species and hybrids were strongly correlated in most of cases (FigureS S4, S5, S6, S7), suggesting that inter-species PPIs could not be differentiated from within species PPIs. We observed the same pattern for almost all comparisons between hybrids andScer (Figure S8) andSkud(Figure S9).
We found one exception for the interaction between proteins Nup120 and Nup145, which are also involved in few divergent interactions betweenScerandSkud. The Nup120-Nup145 interac-tion is present in Scer but is undetectable in Skud (Figure 3D), neither in hybrids between theScerNup120 and theSkudNup145 (Figure 4E). Conversely, the SkudNup120-ScerNup145 interaction
was observed (Figure 4F), suggesting that the absence of
interaction inSkudis due to changes in the amino acid sequence of Nup145 rather than Nup120. In order to determine whether the Nup145-Nup120 interaction was lost inSkudor gained inScer, we repeated the PCA experiment between Nup145 and Nup120 by includingSuva, which diverged early in theSaccharomyces sensu scrictogroup. As shown in Figure 5A, we found that the
Nup145-Nup120 interaction was present in Suva, suggesting that the
absence of interaction inSkudis a lost rather than a gain inScer. Figure 5Bshows three protein domains of Nup145 (namely I, II and III) essential for its interaction with Nup120 and Nup85 that have been recently mapped inScer using deletion analysis [43]. Domains I and II also overlap a 900 bp region that is the only essential fragment of the gene [44]. We examined Nup85 and showed that it strongly interacted with Nup145 and Nup120 in three species and their hybrids, suggesting that the inability of
Skud-Nup145 to interact was unlikely affected by the DHFR
fragment and that the effect was specific to its interaction with
Nup120 (Figure 5C). We thus looked at whether amino acid
cleavedin vivo into two distinct but functional protein fragments, Nup145N and Nup145C [45], and because the DHFR fragments are fused to the C-terminus of proteins, we focused on the Nup145C fragment.
We found 81 amino acid (aa) changes unique toSkudNup145C
sequence (i.e. changes accumulated since theScer-Skuddivergence), with 27 of them located in three domains involved in Nup45C-Nup120 interaction [43], thus representing changes that could potentially affect the interaction (Figure S11A). Among these changes, seven were concentrated in a very short region (13 aa length) of the main interaction domain (domain I) and resulted in
three important aa polarity inversion (Figure S11B). The fact that domain I is also located at the N-terminal end of Nup145C, that it concentrates several hypervariable regions, three phosphorylated sites [46,47] and most of disordered regions of Nup145C [48], strongly suggests that this is the main interacting domain of the protein. Hence, several aa changes we observed in this domain betweenScerandSkudare good candidates to explain the loss of interaction inSkud, since these changes could potentially enhanced a modification of the Nup145C N-terminal activity that subse-quently caused this loss. We also found a 8 aa insertion at the C-terminal of theScerNup145, in the domain III (Figure S11), that 1% and 0.1% threshold above which SI residuals significantly deviate from theScer-Skudregression (black line). (B) Overlapped networks ofScerand Skud. Only SI abovetand comparable interactions are represented. Line width is proportional to SI values measured between proteins inScer(red) andSkud(blue) in the NPC (left) and the RNApII (right). Interactions appear in purple whenScerandSkudSI values overlap. Different degrees of purple depend on whether the interaction could be tested in reciprocal ways or not. (C) Venn diagram indicating the overlap of PPIs detected by PCA of other methods (BioGRID) inScer, and by PCA inSkud. Reciprocal combinations of PPIs were collapsed. (D) Representation of PPIs shared (purple lines) or unique toScer(red lines) orSkud(blue lines) in the NPC. Only proteins involving divergences in PPIs are showed. Only the difference in the Nup120-Nup145 PPI was significant (**:p,0.01).
doi:10.1371/journal.pgen.1003161.g003
Figure 4. The NPC and RNApII are robust to hybridization.SI values compared betweenScer(red) orSkud(blue) andScer-Skudhybrids (green). Examples of proteins Nup82 (A–B) and Nup145 (E–F) in the NPC and Rpb3 (C–D) in the RNApII. Segment width is proportional to SI (dotted line if SI,t). For each comparison, networks on left show interactions measured between the protein of interest tagged inMATa(center) and other proteins of the same complex tagged inMATa. Networks on right show the reciprocal interactions. The protein of interest comes fromScer(red ring) orSkud(blue ring) and is in the species background (outer ring) or in the hybrid background (inner ring). Asterisks indicate whether the SI value measured in hybrid is significantly different from that measured in species (*:p,0.05; **:p,0.01; ***:p,0.001). Only the absence ofScer Nup120-SkudNup145 is significant in reciprocal comparisons (E). Protein names were blurred when strains were unavailable.
may thus potentially affect the activity of this domain, while the absence of this insertion inSkudandSuvawas not concordant with the absence of Nup145-Nup120 interaction inSkudonly.
Interestingly, the interaction between Nup145C fromSuvaand
Nup120 from Skud was also lost, as the interaction between
Nup120 from Suva and Nup85 from Skud (Figure 5C–5D),
suggesting that the architecture of this subcomplex, while conserved betweenScerandSuva, may be modified in hybrids of
Suva due to changes that occurred in this lineage. Many other
variations in Nup145C sequence, like the 8 amino acids insertion in Scer, but also post-translational modifications and changes in regulation, may modulate these differences in PPIs we observed. Because Nup145 is an essential gene [37], we could expect that these interaction modifications would lead to incompatibilities in hybrids. However, we did not know whether the hybrid Nup145C-Nup120 interaction is essential for the cell, nor if incompatibilities between Nup145C and Nup120 actually affect the hybrid fitness, since parental proteins are all present in the diploid hybrid and thus parental interactions could occur and perform the function if hybrid interactions fail. In order to test if the loss of interactions
could lead to an incompatibility between Scer and Skud, we
constructed a haploid strain ofScerin which we replacedNup145 by its homologue fromSkud(see Text S1). If the lack of interaction were causing an incompatibility, we would expectSkud-Nup145 to
not be able to complement the loss of Scer-Nup145. Then we
compared the relative growth of modified strains and wild types (WT) on enriched YPD medium, to directly test whether SkudNup145 complemented ScerNup145. We observed a normal
and similar growth for the WT and modified Scer strains,
suggesting that, while essential, Nup145 from Scer, can be
complemented byNup145fromSkud(Figure 5E).
Discussion
Investigating the role of protein-protein incompatibilities among closely related species is an underexplored but fundamental issue in evolutionary biology. Because interacting proteins are known to co-evolve within species [18–20], such incompatibilities are expected to accumulate as species diverge. Very few cases of such incompatibilities have been reported in the literature. One Figure 5. The absence of Nup120-Nup145C interaction inSkudis likely a PPI loss.(A) Spot assays on Methotrexate medium (six days of growth at 30uC) to dissect the interaction inScer(red),Skud(blue),Suva(yellow) and their hybrids. The interaction between Nup145C fromScerand Nup120 fromScer,SkudorSuvais detected, whereas it is lost when Nup145C comes fromSkud. The interaction was also absent when it involved Nup120 fromSkudand Nup145 fromSuva. (B) Schematic structure of theScerNup120-Nup85-Nup145 sub-complex adapted from Fernandez-Martinezet al.[43]. The three interacting domains are indicated in black. (C) Interactions between Nup85 and Nup145C or Nup120 in three species and their hybrids confirm that not all Nup145C interactions are lost. (D) Evolutionary tree ofScer,SkudandSuvaand schematic representation of Nup145-Nup120-Nup85 interactions in species and hybrids according to spot assays (A–C), revealing several other loss of interaction in hybrids with Suva. Line width is proportional to the number of spot growth observed for each interaction. (E) Similar growth for BY4741Scerwild type (WT) and modified strains (DSkud-NUP145) suggest thatSkud-Nup145complements the absence ofScer-Nup145(YPD medium, two days of growth at 30uC), as Nup145is essential for growth inScer.
doi:10.1371/journal.pgen.1003161.g005
instance has recently been reported in the Proliferating Cell Nuclear Antigen (PCNA) protein complex between two groups of yeasts species [42]. However, the species investigated are distantly related (300 My), such that the question of whether protein incompatibilities can accumulate fast enough to result in inter-species incompatibilities during or just after a speciation event and thus cause inter-species incompatibilities is still an open one. Here, we adapted tools developed for the model speciesScerto study PPIs in vivoin the closely related speciesSkud. We examined how two protein complexes with contrasting evolutionary properties could
assemble in the hybrid between Scer and Skud. Given that the
divergence time betweenSkudandScerrepresents about 78% of the age of the Saccharomycesgenus [23], with a molecular divergence range that is equivalent to molecular divergence between birds and mammals [22],Saccharomycesspecies cover the higher end of the spectrum of molecular divergence that can be observed among species that can be hybridized. As a result of this high divergence,
F1 haploid recombinant hybrids of Scer and Skud are unviable
[27,28], while F1 diploid hybrids are viable [25,26]. The inviability of F1 haploid hybrids makes the use of standard genetic mapping techniques to locate incompatible loci in the genome impossible. However, PCA allows us to examine potential incompatibilities resulting from PPIs perturbations directly in diploid F1 at the molecular and network levels.
Our results indicate that neither of our model protein complexes, the NPC nor the RNApII, is significantly perturbed in the hybrid between species. Our results are unintuitive since these two complexes have highly contrasting evolutionary histories in the twoSaccharomycesspecies.Scer-Skudprotein divergence within the RNApII never exceeds 3%, whereas nucleoporins diverge in the range of 7–41% (Figure 1), suggesting that unlike the RNApII where all proteins are essential for DNA transcription [35], the structure of the NPC is highly flexible [49]. The high conservation of PPIs is thus consistent with the evolutionary history of RNApII but not NPC. For instance, Nup82 is a key protein of the NPC that is involved in PPIs with almost all nucleoporins we tested. Despite the high protein divergence betweenScerandSkudNup82 (26%), we found that all these interactions were indistinguishable and highly correlated between species. This result likely illustrates that only few protein residues contribute to PPIs, as has been previously shown in many protein complexes of known structure [50]. In the NPC, very little detailed structural data is available, most of it from human [51,52] andScer[43,53]. For instance, the
Nup82-Nup116-Nup159 sub-complex structure was solved inScer
[53]. The Nup116-Nup82 interaction that we found to be the strongest in the NPC forScerandSkudinvolves 23 Nup82 residues, among which 21 are conserved between these two species. This observation suggests that at least part of the robustness of protein complexes to inter-species hybridization results from the fact that few sites are involved and those are conserved, while the rest of the protein is free to evolve. The evolution of PPIs has recently been investigated for orthologous proteins in distant Eukaryotes [54]. While the high level of divergence between studied organisms restricted the number of investigable PPIs, these works provided strong evidences that PPIs evolve much slower than proteins, particularly for orthologous proteins which genes underwent no duplication event during their evolutionary history. Our works based on thein vivodetection of PPIs through a same method in two divergent species but with comparable level of organization, confirmed the high level of PPIs conservation at a lower scale of evolutionary time.
The few differences we observed for PPIs in hybrids were not significant in most cases (Figure 4), with the exception of one particular interaction occurring in Scerbut not in Skud between
nucleoporins Nup120 and Nup145C. By comparing PPIs signals inScer, Skud, Suva and hybrids, we deduced that this interaction
change was likely a lost in Skud rather than a gain in Scer
(Figure 5A). Nup145C and Nup120 belong to a NPC heptameric
sub-complex that has a partially known structure in Scer
(Figure 5B). Fernandez-Martinezet al.showed that three Nup145C protein regions disrupted the Nup145C-Nup120 interaction when deleted [43]. Interestingly, one region that likely corresponds to the functional domain of Nup145C contains a high concentration of amino acids changes proper to Skud, potentially leading to substantial changes in the domain functionality (Figure S11), enforcing the hypothesis that these amino acid changes may had an impact on Nup145C interactions with other proteins. The complicated pattern of PPIs loss we observed in hybrids ofSuva also suggests that the Nup145C-Nup120-Nup85 subcomplex accumulated several other differences in amino acids, in post-translational modifications or in protein regulation during Suva divergence with other Saccharomyces species (Figure 5D). Such changes, without affecting the functionality of the subcomplex in parental species, may increase the probability of protein incom-patibilities to occur in hybrids. Our observations, based on evolutionary protein divergence, thus corroborate the work of Fernandez-Martinezet al.based on experimental protein domain mapping [43]. These results show that protein complexes such as the NPC diverge among closely related species. Because the tools we developed for the comparison of PINs among species are also suitable for high throughput screening of PPIs, they provide a powerful method to identify these changes at the whole interactome level.
The loss or gain of PPIs in hybrids as compared to parental species could potentially affect the functional organization of hybrid complexes, and thus lead to incompatibilities. However,
PPI changes we found in the Scer-Skud hybrid were mostly
associated with differences we already identified between parents, and were always congruent with the architecture of the complex.
Because we demonstrated that theSkudgene coding for protein
Nup145C, losing its interactions in hybrids, was interchangeable in function with its ortholog inScer(Figure 5E), one can support that in this particular case, PPIs changes in hybrids had no effect on hybrid viability. It is interesting to note that the gene coding for the Nup145C is orthologous to Nup96 ofDrosophila simulans, which was shown to be involved in male hybrid inviability by interacting with genes located on the X chromosome ofD. melanogaster[55]. While the precise mechanism underlying this incompatibility is unknown, studies suggest that it likely occurs at the protein-protein interaction level, and that the strong coevolution acting on
interacting nucleoporins drove the divergence between D.
melanogasterand D. simulansNup96 ortholog, the latter potentially becoming incapable of some vital interaction in the hybrid NPC [56].
Few genes were found to have a strong effect on yeast hybrid sterility [10] and because most of genetic incompatibilities are rather caused by interactions involving many genes [28,57,58], they potentially involve many PPI perturbations in hybrids. However, we found that two large protein complexes in yeasts SkudandScerwere highly robust to hybridization and thus unlikely to be involved in hybrid incompatibilities. Some works provided indirect evidence about the potential implication of PPIs loss in hybrids inviability due to variations found in natural populations of S. cerevisiae [59] and S. paradoxus [60], suggesting that even within-species protein variation is enough to generate PPIs
perturbations in hybrids. Skud and Scer diverged 5–20 My ago
protein complexes and transient, signaling interactions. Incom-patibilities may also accumulate in parts of PINs that underlie species-specific traits that would result from the contrasting ecological and metabolic characteristics of these two species: difference in growth temperature [61], in carbon source prefer-ence [62] and in alcohol metabolism [23]. The tools we developed here could first be used to identify these species-specific networks and then be harnessed to specifically address these questions.
Methods
Adaptation of the DHFR-PCA method toS. paradoxus,S. kudriavzevii, andS. uvarum
The DHFR-PCA method was developed forScerstrains BY4741
and BY4742 [13]. Haploid strains of other species used or constructed in this study are detailed in Table S3 and were constructed as described in Text S1, using oligonucleotides described in Table S4. In order to optimize PCA conditions for Spar, Skud and Suva and allow comparisons with Scer, we tested different growth conditions using control diploid strains able to produce a strong signal and with the same molecular interactions for the four species (Figure S1C). In each species, we transformed
the MATa and MATa strains with plasmids p41-ZL-DHFR[1,2]
and p41-ZL-DHFR[3]respectively (construction detailed in Text S1). These plasmids express interacting leucine zipper moieties that strongly dimerize and thus lead to a strong signal in PCA. Negative controls consisted of plasmids expressing the linkers and
DHFR fragments alone (p41-Linker-DHFR[1,2] and
p41-Linker-DHFR[3]) [13] (Figure S1C). We then tested different PCA conditions (temperature and methotrexate concentration) using spot dilution assays. Transformations, crosses, diploid selection and PCA were performed as described in Text S1. Plates were manually analyzed with Adobe Photoshop from digital images and cell growth was estimated from pixel intensities of spot dilutions after six days of incubation (Figure S12).
Construction of strains for the DHFR-PCA in the NPC and RNApII complexes
AllSkud MATa(FM1109) andSkud MATa(FM1110) strains for PPI screening (RNApII, 9 proteins; NPC, 15 proteins; see Figure S1A and Text S1 for details of constructions) were constructed by homologous recombination, by using primers described in Table
S5. We completed the DHFR collection forScer[13] since some
strains were missing for these complexes and/or incorrectly tagged (Table S1). We confirmed all strains by PCR-sequencing across the 39end of the coding region of the genes and the fragment of the DHFR-PCA cassette encompassing the entire linker and the 59 region of the DHFR fragments. All strains were reconfirmed by PCR a second time before screening and those that did not show PCR amplification were discarded.
Screening of PPIs in the NPC and RNApII complexes
We performed all possible crosses among the 24MATa-DHFR
F[1,2] and 24 MATa-DHFR F[3] strains constructed and
confirmed for the NPC and the RNApII for a maximum of 576 pairwise combinations per species. We additionally made all possible hybrid crosses betweenScerandSkud, given two types of hybrid diploids per combination: hybrid 1 (MATa Scercrossed with MATaSkud) and hybrid 2 (MATa Skudcrossed withMATaScer). Each possible combination was independently repeated three times (triplicates) on the same plate at random positions (Figure S13). Haploid strains were crossed on solid YPD medium and resulting diploid strains were selected two successive times on YPD with antibiotics using a robot-handled pin tool (see Text S1 and
Figure S13). Diploid cells were transferred onto 1536-array plates
of solid synthetic medium with methotrexate 200mg/mL and
incubated for five days at 30uC. Digital image analyses were performed using a custom script implemented in the software ImageJ 1.45 m (http://rsbweb.nih.gov/ij/).
Correction of SI values and regression analysis
Uncorrected SI values measured in species were highly correlated to those measured in hybrids (r = 0.87 to 0.91, p,0.001; Figures S4, S5, S6, S7). However, SI values associated to a particular protein in a species were sometimes biased between
MATa and MATastrains. For instance, SI values associated to
proteins Rpb8 and Nsp1 ofScertagged inMATawere always lower
than SI measured in MATa (Figures S4 and S6), whereas we
observed the reverse for protein Rpb10 (Figures S5 and S7). In most of regressions tested, SI values associated to a protein tagged in a mating-type remained significantly correlated between species and hybrid, while differing from SI values associated to the opposed mating-type. We thus performed a correction of SI values by considering independently each protein tagged in a particular strain (Figure S2B–S2F). For each set of SI values associated to a haploid strain, we performed a correction only if the correlation species/hybrid was significant (Figure S2C), which was not the case for only two comparisons (Figure S7A). Then, we fitted the regression so that mean SI was equal in species and hybrid (Figure S2D). Corrections could be realized in two different ways: by increasing SI for biased strains, with the risk to increase the signal background, or by decreasing SI for unbiased strains, with the risk to lose PPI signals in the background. We choose the second way, which was the most conservative one. Then we grouped all
corrected SI values together (Figure S2E) and obtained a
significant increase of correlations quality for comparisons between species and hybrids (r = 0.94 to 0.97,p,0.001; Figures S4, S5, S6, S7). For downstream analysis, we considered that a SI value was different between species and hybrid or among species when the associated residual value significantly deviate from the distribution of all residual values grouped together (Figure S2F).
Supporting Information
Dataset S1 Contains raw SI values forScer,Skud, hybrids 1 (Scer MATa6Skud MATa) and hybrid 2 (Skud MATa6Scer MATa). (XLSX)
Dataset S2 Contains SI values corrected for comparisons A)Scer vs.Hybrid 2 (protein of interest tagged inMATa); B)Scer vs.Hybrid 1 (protein of interest tagged in MATa); C) Skud vs. Hybrid 1 (protein of interest tagged inMATa); D)Skud vs.Hybrid 2 (protein of interest tagged inMATa); E)Scer vs. Skud.
(XLSX)
Figure S1 Principle of the PCA in yeasts. The DHFR-PCA screen is based on the resistance of strains to methotrexate (MTX) provided by an engineered mouse dihydrofolate reductase enzyme (DHFR). The DHFR consists of two complementary protein fragments DHFR[1,2] and DHFR[3], reconstituting the
DHFR enzyme that is insensitive to MTX. (A) Construction of
haploid MATa and MATa strains to fuse two genes Gene1 and
Gene2 with, respectively, cassettes DHFR[1,2]-NatMX4 and DHFR[3]-HPH. Cassettes were amplified by PCR from plasmids pAG25-DHFR[1,2]andpAG32-DHFR[3]with forward primers G1-59 and G2-59 and reverse primers G1-39 and G2-39, and were incorporated at the 39 end of the targeted gene by homologous recombination. The resulting fusion proteins, P1 and P2, were
respectively fused to the DHFR[1,2] (MATa) or the DHFR[3]
(MATa) protein fragment via a flexible linker. (B) In diploid cells, the DHFR activity is recovered if P1 and P2 interact, so that the interaction could be detected according to strain growth on medium with MTX. (C) Construction of control diploid strains for
DHFR-PCA optimization in different Saccharomyces species.
Haploid MATa and MATa strains were transformed with,
respectively, plasmid p41-linker-DHFR[1,2] and
p41-linker-DHFR[3]and crossed to produce a negative control diploid strain in which DHFR fragments were unable to complement (top); or with, respectively, plasmids p41-zipper-linker-DHFR[1,2] ( p41-ZL-DHFR[1,2]) and p41-zipper-linker-DHFR[3] (p41-ZL-DHFR[3]) allowing the complementation of DHFR fragments via the strong interaction between two GCN4 parallel coiled-coil leucine zipper fragments, restituting the cell resistance to MTX (bottom). (PDF)
Figure S2 Regression analysis of SI signals measured in Scer, Skud, hybrid 1 (Scer MATacrossed withSkud MATa) and hybrid 2 (Skud MATacrossed withScer MATa): example of PPIs screening between four hypothetical proteins. (A) Comparisons of SI values between species and two hybrids measured for four hypothetical proteins (P1 to P4). Circles and squares represent respectively the protein tagged inMATa(with DHFR F[1,2] fragment) or inMATa (with DHFR F[3] fragment). In order to evaluate the conservation of a PPI betweenScerand hybrids, the SI value measured inScer was compared with that measured (1) in hybrid 2 (protein of interest tagged in MATa) or (2) in hybrid 1 (protein of interest tagged inMATa). In order to evaluate the conservation of a PPI
between Skud and hybrids, the SI value measured in Skud was
compared with that measured (3) in hybrid 1 (protein of interest tagged inMATa) or (4) in hybrid 2 (protein of interest tagged in MATa). (B) Raw SI data in four types of comparisons are poorly correlated mostly because of (C) variation in SI intensities when the protein of interest is tagged in theMATa (1–3) or in theMATa strain (2–4), while SI values forMATaandMATataken alone are highly correlated between species and hybrids. (D) Correction of SI values according to the regression between species and hybrids if the correlation is significant for the protein of interest. (E) Corrected SI values are pooled together. Divergent interactions
appear as outliers (orange arrows) and (F) could be tested
according to the distribution of all residual SI values pooled together.
(PDF)
Figure S3 Comparisons of normalized colony size (log10) measured from 1536-arrays after 5 days of growth on methotrex-ate medium. For each array (Scer: red;Skud: blue; hybrids: green), replicates 1 and 2 (left), 1 and 3 (center) and 2 and 3 (right) were compared. Correlations were tested using a Pearson’s correlation test (p,0.001).
(PDF)
Figure S4 Regression analysis of SI values between Scer and hybrid 2 (protein of interest tagged inMATa). Black circles indicate
raw SI values. Red points indicate corrected SI values. (A)
Comparison of SI values in each protein of NPC taken independently. (B) Comparison of SI values in each protein of RNApII taken independently. (C) Comparison of all SI values pooled together. Correlations were tested before (black) and after correction (red) using a Pearson’s correlation test (p,0.001). (PDF)
Figure S5 Regression analysis of SI values between Scer and hybrid 1 (protein of interest tagged in MATa). Black circles indicate raw SI values. Red points indicate corrected SI values. (A) Comparison of SI values in each protein of NPC taken
independently. (B) Comparison of SI values in each protein of RNApII taken independently. (C) Comparison of all SI values pooled together. Correlations were tested before (black) and after correction (red) using a Pearson’s correlation test (p,0.001). Unavailable strains are indicated in grey.
(PDF)
Figure S6 Regression analysis of SI values between Skud and hybrid 1 (protein of interest tagged inMATa). Black circles indicate raw SI values. Blue points indicate corrected SI values. (A) Comparison of SI values in each protein of NPC taken independently. (B) Comparison of SI values in each protein of RNApII taken independently. (C) Comparison of all SI values pooled together. Correlations were tested before (black) and after correction (blue) using a Pearson’s correlation test (p,0.001). (PDF)
Figure S7 Regression analysis of SI values between Skud and hybrid 2 (protein of interest tagged in MATa). Black circles indicate raw SI values. Blue points indicate corrected SI values. (A) Comparison of SI values in each protein of NPC taken independently. (B) Comparison of SI values in each protein of RNApII taken independently. (C) Comparison of all SI values pooled together. Correlations were tested before (black) and after correction (blue) using a Pearson’s correlation test (p,0.001). Unavailable strains are indicated in grey.
(PDF)
Figure S8 Comparison of SI values after correction by regression analysis between Scer and hybrid 2 (left) or hybrid 1 (right). (A) Estimation of the SI threshold value (t) for the detection of PPIs inScer. (B) Estimation of the SI threshold value (t) for the detection of PPIs in hybrids. In each figure, distribution of SI values (log10) is showed with solid lines representing SI values measured within complexes (SW values) and dotted lines representing SI values measured among complexes (SA values). Thetvalue corresponds to the maximal SA value measured in the diploid. Grey frames indicate background growth (SI,t). (C)
Overlapped networks of Scer and hybrids Only SI above t and
comparable interactions are represented. Line width is propor-tional to SI values measured between proteins inScer (red) and hybrids (green) in the NPC (left) and the RNApII (right).
Interactions appear in brown when Scer and hybrid SI values
overlap. Different degrees of brown depend on whether the interaction could be tested in reciprocal ways or not.
(PDF)
Figure S9 Comparison of SI values after correction by regression analysis between Skudand hybrid 1 (left) or hybrid 2 (right). (A) Estimation of the SI threshold value (t) for the detection of PPIs inSkud. (B) Estimation of the SI threshold value (t) for the detection of PPIs in hybrids. In each figure, distribution of SI values (log10) is shown with solid lines representing SI measured within complexes (SW values) and dotted lines representing SI
measured among complexes (SA values). Thetvalue corresponds
to the maximal SA value measured in the diploid. Grey frames indicate background growth (SI,t). (C) Overlapped networks of Skudand hybrids Only SI abovetand comparable interactions are represented. Line width is proportional to SI values measured between proteins inSkud (blue) and hybrids (green) in the NPC (left) and the RNApII (right). Interactions appear in turquoise
when Skud and hybrid SI values overlap. Different degrees of
turquoise depend in whether the interaction could be tested in reciprocal ways or not.
Figure S10 (A) Venn diagram showing the overlap of PPIs inScer for NPC and RNApII identified by other physical methods than
PCA (BioGRID). (B) Plot of 82 SW values corresponding to 54
PPIs we identified by PCA in Scer, against the number of
occurrences of the PPI in BioGRID (Pearson’s correlation; p,0.001). (C) Schematic representation of the RNApII complex based on crystal structure [35]. Protein names are located at the approximate position of the C-terminal of each protein. Lines indicate interactions detected only inScer(red), only inSkud(blue) or in both species (purple). Dotted lines indicate interactions only detected inScerbecause the information was not available inSkud. Bold lines indicate PPIs that were identified in reciprocal
combinations. Only PPIs with SW.t are showed. The Rpc10
C-terminal is hidden by other proteins and Rpb9 is located at the opposite side of the complex, which was in agreement of the absence of PPIs for these proteins. (D) Schematic representation or the NPC organization based on structural data [34].
(PDF)
Figure S11 Amino acid (aa) divergence between Scer, Skudand Suvafor the Nup145C protein. (A) Distribution of aa changes along the Nup145C protein (proportion of aa changes in a window of 9 aa). Changes filled in blue are unique toSkud. Domains I, II and III involved in the Nup145C-Nup120 interaction are indicated by brackets. Red, blue and yellow bars indicated disordered regions of the protein in respectively Scer, Skud and Suva, predicted by DISOPRED2 [63]. Grey and purple arrows indicate locations of respectively a high concentration of aa changes proper toSkudin domain I and a 8 aa insertion proper to Scerin domain III. (B) Detail of the aa divergence between three species in domains I, II and III with Sceras reference sequence. Dashes indicate no aa change; asterisks indicate deletions. Changes proper to Skud are indicated in blue. Green and orange positions indicate respectively positive and negative aa polarity changes inSkud. Phosphorylation sites are indicated by circled P. Grey and purple frames indicate locations of respectively the high concentration of aa changes specific toSkudin domain I and the 8 aa insertion proper toScerin domain III. Predicted disordered regions are also indicated. (PDF)
Figure S12 Optimization of the DHFR-PCA in four Saccharo-mycesspecies. Difference in growth among positive (zipper-linker) and negative (linker) controls on methotrexate (MTX) tested in each species and each condition: MTX concentration (columns),
incubation temperature and culture OD600 (rows). Each box
represents a combination of conditions within a species (three replicates for each combination). The grey scale is proportional to the difference in relative spot growth (averaged among three replicates) between positive and negative controls (scale on bottom). In each condition, differences were tested using a t-test (***:p,0.001; **:p,0.01; *:p,0.05; n.s.:p.0.05).
(PDF)
Figure S13 Design of the DFHR-PCA screen for the NPC and
RNApII complexes. For each species and hybrids, MATa
-DHFR[1,2] strains (top left) were incubated to saturation in
96-position pre-culture plates and divided in three parts (dotted lines),
each containing one replicate of one of 24 MATa-DHFR[1,2]
strains positioned at random. Cultures were printed four times with a 96-pin tool on a 866128 mm plate (omnitray) filled with
35 ml of solid YPD medium with nourseothricin (100 mg/L), to obtain a 384-positions array. For eachMATa-DHFR[3] strain (top right), an empty omnitray was filled with 20 ml of a fresh saturated liquid YPD culture and cells were transferred with a 96-position pin-tool on a plate with 35 ml of solid YPD and hygromycin B (250 mg/L). FourMATastrains were positioned per omnitray in order to obtain an interlaced array of 384 positions. 384-plates of MATaandMATastrains were crossed using a 384-pin tool on an omnitray with 35 ml of solid YPD. After incubation, colonies were transferred onto a 1536-array omnitray with 35 ml on solid YPD with nourseothricin and hygromycin B to allow diploid selection. Then, cells were transferred onto an omnitray filled with 35 ml of solid synthetic medium without adenine and with 2% methotrex-ate.
(PDF)
Table S1 List of DHFR-PCA strains used in this study. (DOCX)
Table S2 Summary of testable PPIs in Scer, Skud and their hybrids. Details of calculation are given under the table. Codes for different testable combinations of PPIs: S: homomeric interactions (P1-P1); NR: non-reciprocal interactions (only P1-P2 or P2-P1 is testable); R: reciprocal interactions (both P1-P2 and P2-P1 are testable).
(DOCX)
Table S3 Original strains used in this study. (DOCX)
Table S4 List of oligonucleotides used in this study. (DOCX)
Table S5 List of oligonucleotides used for the DHFR-PCA strain construction.
(DOCX)
Text S1 Supplementary methods. (DOCX)
Acknowledgments
We thank M. Giroux for constructing strains MG030 and MG032; C. Bertin for performing spot assays; O. Zill, G. Lang, and C. Hittinger for providing strains; S. Michnick for plasmids; E. Levy for advice on the optimization of the selection media for the PCA screen; and M. Thaler, N. Aubin-Horth, the Landry lab members, and three anonymous reviewers for helpful comments.
Author Contributions
Conceived and designed the experiments: CRL J-BL. Performed the experiments: J-BL GC AKD IG-A. Analyzed the data: J-BL CRL. Contributed reagents/materials/analysis tools: GD. Wrote the paper: J-BL CRL.
References
1. Darwin C (1859) On the origin of species by means of natural selection. London: J. Murray. ix, 1, 502 p.
2. Muller HJ, Pontecorvo G (1940) Recombinants between Drosophila species the F-1 hybrids of which are sterile. Nature 146: 199–200.
3. Bateson (1909) Discussion on the Influence of Heredity on Disease, with special Reference to Tuberculosis, Cancer, and Diseases of the Nervous System: Introductory Address. Proc R Soc Med 2: 22–30.
4. Dobzhansky T (1940) Speciation as a stage in evolutionary divergence. American Naturalist 74: 312–321.
5. Gourbiere S, Mallet J (2010) Are species real? The shape of the species boundary with exponential failure, reinforcement, and the ‘‘missing snowball’’. Evolution 64: 1–24.
6. Orr HA, Turelli M (2001) The evolution of postzygotic isolation: Accumulating Dobzhansky-Muller incompatibilities. Evolution 55: 1085–1094.
7. Araripe LO, Montenegro H, Lemos B, Hartl DL (2010) Fine-scale genetic mapping of a hybrid sterility factor between Drosophila simulans and D. mauritiana: the varied and elusive functions of ‘‘speciation genes’’. BMC Evol Biol 10: 385.
8. Barbash DA (2007) Nup96-dependent hybrid lethality occurs in a subset of species from the simulans clade ofDrosophila. Genetics 176: 543–552. 9. Brideau NJ, Flores HA, Wang J, Maheshwari S, Wang X, et al. (2006) Two
Dobzhansky-Muller genes interact to cause hybrid lethality inDrosophila. Science 314: 1292–1295.
10. Lee HY, Chou JY, Cheong L, Chang NH, Yang SY, et al. (2008) Incompatibility of nuclear and mitochondrial genomes causes hybrid sterility between two yeast species. Cell 135: 1065–1073.
11. Arabidopsis-Interactome-Mapping-Consortium (2011) Evidence for network evolution in anArabidopsisinteractome map. Science 333: 601–607. 12. Guruharsha KG, Rual JF, Zhai B, Mintseris J, Vaidya P, et al. (2011) A protein
complex network ofDrosophila melanogaster. Cell 147: 690–703.
13. Tarassov K, Messier V, Landry CR, Radinovic S, Serna Molina MM, et al. (2008) An in vivo map of the yeast protein interactome. Science 320: 1465–1470. 14. Choudhary C, Kumar C, Gnad F, Nielsen ML, Rehman M, et al. (2009) Lysine acetylation targets protein complexes and co-regulates major cellular functions. Science 325: 834–840.
15. Collins SR, Miller KM, Maas NL, Roguev A, Fillingham J, et al. (2007) Functional dissection of protein complexes involved in yeast chromosome biology using a genetic interaction map. Nature 446: 806–810.
16. Guo W, Sacher M, Barrowman J, Ferro-Novick S, Novick P (2000) Protein complexes in transport vesicle targeting. Trends Cell Biol 10: 251–255. 17. Lemmon MA, Schlessinger J (2010) Cell signaling by receptor tyrosine kinases.
Cell 141: 1117–1134.
18. Lovell SC, Robertson DL (2010) An integrated view of molecular coevolution in protein-protein interactions. Mol Biol Evol 27: 2567–2575.
19. Pazos F, Valencia A (2008) Protein co-evolution, co-adaptation and interactions. Embo J 27: 2648–2655.
20. Ramani AK, Marcotte EM (2003) Exploiting the co-evolution of interacting proteins to discover interaction specificity. J Mol Biol 327: 273–284. 21. Harrison JS, Burton RS (2006) Tracing hybrid incompatibilities to single amino
acid substitutions. Mol Biol Evol 23: 559–564.
22. Dujon B (2006) Yeasts illustrate the molecular mechanisms of eukaryotic genome evolution. Trends Genet 22: 375–387.
23. Scannell DR, Zill OA, Rokas A, Payen C, Dunham MJ, et al. (2011) The Awesome Power of Yeast Evolutionary Genetics: New Genome Sequences and Strain Resources for the Saccharomyces sensu stricto Genus. Genes Genomes Genetics 1: 11–25.
24. Stark C, Breitkreutz BJ, Chatr-Aryamontri A, Boucher L, Oughtred R, et al. (2011) The BioGRID Interaction Database: 2011 update. Nucleic Acids Res 39: D698–704.
25. Gonzalez SS, Gallo L, Climent MA, Barrio E, Querol A (2007) Enological characterization of natural hybrids fromSaccharomyces cerevisiaeandS. kudriavzevii. Int J Food Microbiol 116: 11–18.
26. Sniegowski PD, Dombrowski PG, Fingerman E (2002)Saccharomyces cerevisiaeand Saccharomyces paradoxuscoexist in a natural woodland site in North America and display different levels of reproductive isolation from European conspecifics. FEMS Yeast Res 1: 299–306.
27. Greig D, Borts RH, Louis EJ, Travisano M (2002) Epistasis and hybrid sterility inSaccharomyces. P R Soc B 269: 1167–1171.
28. Xu M, He X (2011) Genetic incompatibility dampens hybrid fertility more than hybrid viability: yeast as a case study. PLoS ONE 6: e18341. doi:10.1371/ journal.pone.0018341.
29. Michnick SW, Ear PH, Landry C, Malleshaiah MK, Messier V (2010) A toolkit of protein-fragment complementation assays for studying and dissecting large-scale and dynamic protein-protein interactions in living cells. Methods in Enzymology 470: 335–368.
30. Freschi L, Torres-Quiroz F, Dube´ AK, Landry CR (2012) qPCA: a scalable assay to measure the perturbation of protein-protein interactions in living cells. Molecular BioSystems DOI: 10.1039/C2MB25265A.
31. Neumann N, Lundin D, Poole AM (2010) Comparative genomic evidence for a complete nuclear pore complex in the last eukaryotic common ancestor. PLoS ONE 5: e13241. doi:10.1371/journal.pone.0013241.
32. Bapteste E, Charlebois RL, MacLeod D, Brochier C (2005) The two tempos of nuclear pore complex evolution: highly adapting proteins in an ancient frozen structure. Genome Biol 6: R85.
33. Woychik NA (1998) Fractions to functions: RNA polymerase II thirty years later. Cold Spring Harb Symp Quant Biol 63: 311–317.
34. Alber F, Dokudovskaya S, Veenhoff LM, Zhang W, Kipper J, et al. (2007) The molecular architecture of the nuclear pore complex. Nature 450: 695–701. 35. Cramer P, Bushnell DA, Fu J, Gnatt AL, Maier-Davis B, et al. (2000)
Architecture of RNA polymerase II and implications for the transcription mechanism. Science 288: 640–649.
36. Fraser HB, Hirsh AE, Steinmetz LM, Scharfe C, Feldman MW (2002) Evolutionary rate in the protein interaction network. Science 296: 750–752.
37. Winzeler EA, Shoemaker DD, Astromoff A, Liang H, Anderson K, et al. (1999) Functional characterization of theS. cerevisiaegenome by gene deletion and parallel analysis. Science 285: 901–906.
38. Kellis M, Birren BW, Lander ES (2004) Proof and evolutionary analysis of ancient genome duplication in the yeastSaccharomyces cerevisiae. Nature 428: 617– 624.
39. Ear PH, Michnick SW (2009) A general life-death selection strategy for dissecting protein functions. Nat Methods 6: 813–816.
40. Hittinger CT, Goncalves P, Sampaio JP, Dover J, Johnston M, et al. (2010) Remarkably ancient balanced polymorphisms in a multi-locus gene network. Nature 464: 54–58.
41. Hoelz A, Debler EW, Blobel G (2011) The structure of the nuclear pore complex. Annu Rev Biochem 80: 613–643.
42. Zamir L, Zaretsky M, Fridman Y, Ner-Gaon H, Rubin E, et al. (2012) Tight coevolution of proliferating cell nuclear antigen (PCNA)-partner interaction networks in fungi leads to interspecies network incompatibility. Proc Natl Acad Sci U S A 109: E406–414.
43. Fernandez-Martinez J, Phillips J, Sekedat MD, Diaz-Avalos R, Velazquez-Muriel J, et al. (2012) Structure-function mapping of a heptameric module in the nuclear pore complex. J Cell Biol 196: 419–434.
44. Emtage JL, Bucci M, Watkins JL, Wente SR (1997) Defining the essential functional regions of the nucleoporin Nup145p. J Cell Sci 110 (Pt 7): 911–925. 45. Teixeira MT, Fabre E, Dujon B (1999) Self-catalyzed cleavage of the yeast
nucleoporin Nup145p precursor. J Biol Chem 274: 32439–32444.
46. Ficarro SB, McCleland ML, Stukenberg PT, Burke DJ, Ross MM, et al. (2002) Phosphoproteome analysis by mass spectrometry and its application to Saccharomyces cerevisiae. Nat Biotechnol 20: 301–305.
47. Smolka MB, Albuquerque CP, Chen SH, Zhou H (2007) Proteome-wide identification of in vivo targets of DNA damage checkpoint kinases. Proc Natl Acad Sci U S A 104: 10364–10369.
48. Malmstrom L, Riffle M, Strauss CE, Chivian D, Davis TN, et al. (2007) Superfamily assignments for the yeast proteome through integration of structure prediction with the gene ontology. PLoS Biol 5: e76. doi:10.1371/journal.pbio.0050076. 49. Rout MP, Aitchison JD, Suprapto A, Hjertaas K, Zhao Y, et al. (2000) The yeast
nuclear pore complex: composition, architecture, and transport mechanism. J Cell Biol 148: 635–651.
50. Levy ED (2010) A simple definition of structural regions in proteins and its use in analyzing interface evolution. J Mol Biol 403: 660–670.
51. Melcak I, Hoelz A, Blobel G (2007) Structure of Nup58/45 suggests flexible nuclear pore diameter by intermolecular sliding. Science 315: 1729–1732. 52. Boehmer T, Jeudy S, Berke IC, Schwartz TU (2008) Structural and functional
studies of Nup107/Nup133 interaction and its implications for the architecture of the nuclear pore complex. Mol Cell 30: 721–731.
53. Yoshida K, Seo HS, Debler EW, Blobel G, Hoelz A (2011) Structural and functional analysis of an essential nucleoporin heterotrimer on the cytoplasmic face of the nuclear pore complex. Proc Natl Acad Sci U S A 108: 16571–16576. 54. Qian W, He X, Chan E, Xu H, Zhang J (2011) Measuring the evolutionary rate
of protein-protein interaction. Proc Natl Acad Sci U S A 108: 8725–8730. 55. Presgraves DC, Balagopalan L, Abmayr SM, Orr HA (2003) Adaptive evolution
drives divergence of a hybrid inviability gene between two species ofDrosophila. Nature 423: 715–719.
56. Presgraves DC, Stephan W (2007) Pervasive adaptive evolution among interactors of theDrosophilahybrid inviability gene, Nup96. Mol Biol Evol 24: 306–314.
57. Greig D (2007) A screen for recessive speciation genes expressed in the gametes of F1 hybrid yeast. PLoS Genet 3: e21. doi:10.1371/journal.pgen.0030021. 58. Kao KC, Schwartz K, Sherlock G (2010) A genome-wide analysis reveals no
nuclear dobzhansky-muller pairs of determinants of speciation between S. cerevisiaeandS. paradoxus, but suggests more complex incompatibilities. PLoS Genet 6: e1001038. doi:10.1371/journal.pgen.1001038.
59. Heck JA, Argueso JL, Gemici Z, Reeves RG, Bernard A, et al. (2006) Negative epistasis between natural variants of theSaccharomyces cerevisiaeMLH1 and PMS1 genes results in a defect in mismatch repair. Proc Natl Acad Sci U S A 103: 3256–3261.
60. Liti G, Haricharan S, Cubillos FA, Tierney AL, Sharp S, et al. (2009) Segregating YKU80 and TLC1 alleles underlying natural variation in telomere properties in wild yeast. PLoS Genet 5: e1000659. doi:10.1371/journal. pgen.1000659.
61. Arroyo-Lopez FN, Orlic S, Querol A, Barrio E (2009) Effects of temperature, pH and sugar concentration on the growth parameters ofSaccharomyces cerevisiae, S. kudriavzeviiand their interspecific hybrid. Int J Food Microbiol 131: 120–127. 62. Hittinger CT, Rokas A, Carroll SB (2004) Parallel inactivation of multiple GAL pathway genes and ecological diversification in yeasts. Proc Natl Acad Sci U S A 101: 14144–14149.