Crop Breeding and Applied Biotechnology 8: 47-55, 2008
Brazilian Society of Plant Breeding. Printed in Brazil
Received 03 May 2007
Accepted 18 September 2007
Analysis of direct and indirect selection and indices in
Analysis of direct and indirect selection and indices in
Analysis of direct and indirect selection and indices in
Analysis of direct and indirect selection and indices in
Analysis of direct and indirect selection and indices in
soybean segregating populations
soybean segregating populations
soybean segregating populations
soybean segregating populations
soybean segregating populations
Marcelo Marchi Costa1*, Antonio Orlando Di Mauro2, Sandra Helena Unêda-Trevisoli3, Nair Helena Castro Arriel4, Ivana Marino Bárbaro4, Gustavo Dias da Silveira6, and Franco Romero Silva Muniz2
1 Departamento de Produção Vegetal, Faculdade de Ciências Agrárias e Veterinárias (FCAV), Universidade do Estado de São Paulo (UNESP), Campus de Jaboticabal. Via de Acesso Prof. Paulo Donato Castellane, s/no, 14.884-900, Jaboticabal, SP, Brasil. *Email: mmarchi@hotmail.com
2 Departamento de Produção Vegetal, UNESP, Campus de Jaboticabal
3 APTA Regional Centro Leste, C.P. 271, 14.001-970, Ribeirão Preto, SP, Brasil 4 Embrapa Algodão, C.P. 174, 58.107-720, Campina Grande, PB, Brasil 5 APTA Regional Alta Mogiana, C.P. 35, 14.770-000, Colina, SP, Brasil 6 Monsanto do Brasil, Rodovia BR-163, km 758, 78.890-000, Sorriso, MT, Brasil
ABSTRACT – Estimates of gain with selection are very useful in breeding programs to predict the success of selection. Index-based simultaneous selection makes breeding more successful. The objective of this report was to estimate and compare the genetic gain obtained by direct and indirect selection and using the classical and based on desired gain indices. The experiment was set up in the design of families with intercalated checks with 293 F3 soybean genotypes, distributed in 32 families derived from five crosses. Individual gains obtained with direct selection among and within families and mass selection were similar and in most cases higher than selection by indices. On the other hand, the highest total gains were obtained with selection indices and distributed across all traits. The classical index obtained the highest genetic gains.
Key words: Glycine max, selection indices, expected gain, selection among and within families.
INTRODUCTION
One of the main achievements of quantitative genetics is that it enables breeders to estimate the expected progress with selection before carrying it out. This information gives improvement programs a clearer orientation and helps predict the success of the adopted selection method and choose the technically most effective option on a scientific base (Ramalho et al. 1993, Cruz and Regazzi 1997).
The selection of superior progenies is a labor-intensive process, once the traits of importance are strongly influenced by the environment and often
correlated, so that a selection in one provokes effects in the others. Therefore, selection to develop superior genotypes based on only one or a few traits might be little effective, since a genotype may be obtained that performs superior in relation to the selected traits only (Cruz and Regazzi 1997, Cruz 2001).
Some comparisons of the indices with direct selection allow the conclusion that the use of indices as selection criterion achieves relatively superior results. In general, the direct gain for the trait is reduced; on the other hand, this reduction is compensated by a better distribution of favorable gains over the other traits. Different indices represent different options of selection and, consequently, of gains, which identify the most adequate genotypes for the breeder’s objectives quickly and effectively (Cruz and Regazzi 1997). Several authors confirmed the efficacy of selection indices, among them Barbosa and Pinto (1998), Oliveira et al. (1999), Granate et al. (2002), Paula et al. (2002), and Costa et al. (2004).
This study aimed to estimate and compare the predicted genetic gains with direct and indirect selection, by the classical and the based on desired gains indices, for the selection of more promising soybean genotypes.
MATERIAL AND METHODS
The experiment was conducted on an experimental area of the Faculdade de Ciências Agrárias e Veterinárias, UNESP – Campus de Jaboticabal. The genotypes were distributed on the field according to the family design with intercalated checks, with the control cultivars Renascença and Liderança. The technical recommendations for soybean cultivation were observed throughout the trial.
The plants of 293 genotypes of the F3 generation were used, representing 32 families derived from five crosses, and were evaluated in the R8 stage (Fehr and Caviness 1977) for the traits number of days to maturation (NDM); plant height at maturity (PHM) in cm; insertion height of the first pod (IHP) in cm; lodging (Lo), grade scale varying from 1 (upright/erect plant) to 5 (lodged plant); agronomic value (AV), grade scale varying from 1 (poor plant) to 5 (excellent plant); number of pods per plant (NP); number of seeds per plant (NS); and grain yield per plant (GY), in gram.
The variances of each trait for each control and for the segregating generation were analyzed according to the following statistical model: Yij=m+fi +ei+pij+δij, where Yij is an observation of the jth plant of the ith family; m is a general mean of the generation (control or family); fi is the genetic effect attributed to the ith family, with i = 1,2...32; is the environmental effect between rows (of the control or of families); pij is the genetic
effect ascribed to the jth plant of the ith family, with j = 1,2...293; δij is the environmental effect between plants within rows (of the control or of families).
The statistical analyses were performed using software Genes (Cruz 2001). The original data of Lo and AV and of NP and NS were transformed in x+0.5 and
x, respectively, in order to adjust the data better to the normal distribution curve. The heritability coefficients were estimated by the parent-offspring regression, by the ratio of the covariance of parent (F2) and progeny (F3) generations by the variance of the parent generation, corrected by the inbreeding coefficient.
The selection gains were estimated by the following methods:
Direct and indirect selection
The aim is to obtain selection gains in the target trait. The responses in the traits of secondary importance can be favorable or unfavorable and are not considered in the selection process, depending on the correlation between them.
Selection among and within families
The expected gains among and within families through direct selection in trait x can be estimated by SGx=iephxSDex+idphxSDdx, where SGx is the expected gain by direct selection among and within families in trait x; ie is the selection intensity obtained considering a selection of 50% among families; p is the parental control (considered equal to 1.0); hx is the square root of the heritability of the parent-offspring regression of trait x; SDex is the genetic standard deviation among families of trait x; id is the selection intensity obtained considering a selection of 25% within families; SDdx is the genetic standard deviation of trait x within families. The indirect gain among and within families in trait y by selection for trait x (SGy(x)) is given by SGy ( x )= iep hxreSDe y+ idp hxrdSDd y, where re is the genetic correlation between traits x and y, among families; SDey is the genetic standard deviation among families of trait y; rd is the genetic correlation between traits x and y, within families; SDdy is the genetic standard deviation within families for trait y.
Mass selection
the selection intensity obtained considering a selection of 20% of the plants; hx is the square root of the heritability of the parent-offspring regression of trait x; SDgx is the genetic standard deviation of trait x. In mass selection, indirect gains are also obtained by SGy(x)=iphxrgSDgy, where SGy(x) is the gain obtained in trait y when selecting for trait x; rg is the genetic correlation between x and y; SDgy is the genetic standard deviation of trait y.
Classical index of Smith (1936) and Hazel (1943)
The Classical index consists of the linear combination of several traits of economic importance whose weighting coefficients are estimated in order to maximize the correlation between the index and the genotypic aggregate. This aggregate is established by another linear combination, involving the genetic values, which are weighted for their respective economic values.
Let the selection index (I) and the genotypic aggregate (H) be described by I bx bx b x bx bx
n i i i n n ' ... 1 2 2 1
1 + + + = =
=
å
= and g a g a g a g a g a H n i i i n n ' ... 1 2 2 11 + + + = =
=
å
=
, where n is the number of evaluated traits; b' is the vector (1 x n) of the weighting coefficients of the selection index to be estimated; is the matrix (n x p) of trait means; a' ,is the vector (1 x n) of previously established economic weights; and g is the matrix (n x p) of unknown genetic values of the n traits considered.
To estimate the selection index of each family the estimation of vector b is necessary, which is obtained so that the correlation between I and H is maximized. So, bP=Ga, where b is the estimator of vector (n x 1) of the weighting coefficients of the selection index; P is the matrix (n x n) of phenotypic variances and covariances of the traits; and G is the matrix (n x n) of genetic variances and covariances of the traits.
The expected gain for trait j in index-based selection is expressed by
) ( ' ) ( I V i G b
gjI = j
D , where Dgj(I)
is the gain for trait j, with selection based on index I; b’ is the vector of weighting coefficients of the traits in the selection index; Gj is the jth row of matrix G; i is the selection intensity for 20%; and V(I) is the index variance.
Index based on the desired gains (Pesek and Baker, 1969)
In view of the difficulty of establishing the economic weights, an index was proposed where the
weights were replaced by the desired gains for each trait, of easier determination.
The construction of the index is based on the expected gain of the traits, given by
I i b G g sˆ ˆ =
D , where
Dg is the gain estimated by the index; G is the matrix (n x n) of genetic variances and covariances among the traits; b is the vector (1 x n) of the weighting coefficients of the selection index to be estimated; i is the selection differential in units of standard deviation from index I; σ^I is the standard deviation from index I.
If Dg is replaced by Dgd, which is the vector of the desired gains, and eliminating
I
i
sˆ , which does not affect the proportion of the b coefficients, b can be estimated by the expression b^=G-1Dg
d. The estimated
' i
b coefficients allow the maximization of gains in each trait, according to the importance established by the breeder.
When using the classical index the genetic variation coefficient (CVg) and genetic standard deviation (SD) of each trait were considered as economic weights. SD was also used as desired gain with the Pesek and Baker index, as recommended by Cruz and Regazzi (1997). Furthermore, a negative selection for NDM and Lo was considered, to permit the development of earlier and less lodged genotypes. The traits AV, NP, NS, and GY were considered primary and NDM, PHM, IHP, and Lo secondary, with both indices.
Aiming at a standardized number of plants for each method, to obtain the estimates of gain prediction, selection intensities of 50 and 25% were adopted in the selection among and within families, respectively, and of 20% of the progenies for mass selection and the indices.
RESULTS AND DISCUSSION
Table 1. Estimates of the heritability coefficients based on the parent-offspring regression for eight evaluated traits in five soybean crosses
Crosses NDM PHM IHP Lo1 AV1 NP2 NS2 GY
1 0.81 0.76 0.39 0.30 0.40 0.82 0.65 0.41
2 0.72 0.68 0.41 0.55 0.59 0.81 0.91 0.88
3 0.47 0.86 0.81 0.86 0.60 0.92 0.92 0.76
4 0.93 0.77 0.75 0.90 0.81 0.74 0.88 0.84
5 0.87 0.69 0.53 0.73 0.83 0.72 0.70 0.86
1 = data transformed by
5 . 0
+
x ; 2 = data transformed by x
* NDM: number of days to maturity; PHM: plant height at maturity; IHP: insertion height of the first pod; Lo: lodging; AV: agronomic value; NP: number of pods; NS: number of seeds; GY: grain yield
Estimates of selection gains
Tables 2 to 6 show the estimates of the gains with selection for the eight evaluated traits in the five crosses by direct and indirect selection and by the indices of Smith and Hazel (SH) and of Pesek and Baker (PB), using the previously described economic weights. Selection among and within families and mass were considered in the direct and indirect selection.
The highest direct gains were observed for the traits NP, NS and GY, in direct selection as well as by the indices (Tables 2 to 6). This fact had already been expected, since the selection was conducted prioritizing these traits with the highest heritability coefficients and high variation considered most important. Besides, it was stated that the individual gains obtained by direct selection among and within families and mass were similar, with a slight superiority of mass selection in the crosses 1 and 3 (Tables 2 and 4) for all traits, whereas selection among and within surpassed mass selection in the crosses 2, 4 and 5 (Tables 3, 5 and 6) in all traits as well, which were both superior to the SH and PB indices.
It must be emphasized that in some situations higher indirect than direct gains were observed in all five crosses, for the traits NP, NS and GY. This result is possible, according to Falconer (1987), if the heritability of the auxiliary trait is higher than of the main trait under selection and when the genetic correlation between both is of high magnitude.
Considering the total gains obtained by each selection criterion, a superiority of the SH index was observed, although with values close to those obtained by direct and indirect selection for the traits NP, NS and GY and the PB index in most situations, and with the exception of direct and indirect selection of NP in cross 1 (Table 2) and of the PB index in cross 2 (Table 3). The same fact was reported by Costa et al. (2004).
For trait NDM, where selection was performed for earliness, the direct gains obtained by selection among and within families and mass were very close. The former were superior in three of the five crosses (Tables 3, 5 and 6), and both outmatched the indirect gains and indices.
For PHM, the direct mass selection obtained slightly superior direct gains to those by selection among and within families in two crosses (Tables 2 and 4), with quite significant values in relation to those of indirect selection and by indices, except in some cases where the SH index obtained similar gains, especially with standard deviation as economic weight.
Likewise, the direct gains with mass selection exceeded selection among and within families in only two crosses for trait IHP (Tables 2 and 4), with marked superiority over the gains obtained by indirect selection and the indices, with exception of the SH index with standard deviation as weight in cross 3 (Table 4).
For the trait Lo, as in the case of NDM, selection was performed for the lowest values, to develop more erect plants. In this case, the direct gains by selection among and within families were a little superior to those of mass selection in three of the five crosses (Tables 3, 5 and 6) and both surpassed the indirect gains and indices by far.
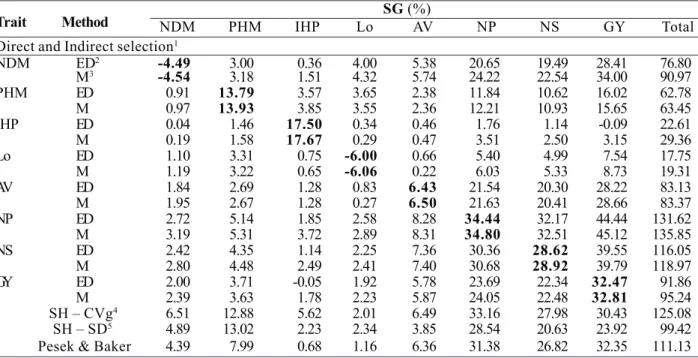
Table 2. Estimates of the selection gains (SG %) by the methods: direct and indirect selection, classical selection index of Smith & Hazel and selection index of Pesek & Baker, in the soybean cross 1 (MGBR 95-20937 x IAC Foscarin 31)
Trait Method SG (%)
NDM PHM IHP Lo AV NP NS GY Total
Direct and Indirect selection1
NDM ED2 -4.49 3.00 0.36 4.00 5.38 20.65 19.49 28.41 76.80
M3 -4.54 3.18 1.51 4.32 5.74 24.22 22.54 34.00 90.97
PHM ED 0.91 13.79 3.57 3.65 2.38 11.84 10.62 16.02 62.78
M 0.97 13.93 3.85 3.55 2.36 12.21 10.93 15.65 63.45
IHP ED 0.04 1.46 17.50 0.34 0.46 1.76 1.14 -0.09 22.61
M 0.19 1.58 17.67 0.29 0.47 3.51 2.50 3.15 29.36
Lo ED 1.10 3.31 0.75 -6.00 0.66 5.40 4.99 7.54 17.75
M 1.19 3.22 0.65 -6.06 0.22 6.03 5.33 8.73 19.31
AV ED 1.84 2.69 1.28 0.83 6.43 21.54 20.30 28.22 83.13
M 1.95 2.67 1.28 0.27 6.50 21.63 20.41 28.66 83.37
NP ED 2.72 5.14 1.85 2.58 8.28 34.44 32.17 44.44 131.62
M 3.19 5.31 3.72 2.89 8.31 34.80 32.51 45.12 135.85
NS ED 2.42 4.35 1.14 2.25 7.36 30.36 28.62 39.55 116.05
M 2.80 4.48 2.49 2.41 7.40 30.68 28.92 39.79 118.97
GY ED 2.00 3.71 -0.05 1.92 5.78 23.69 22.34 32.47 91.86
M 2.39 3.63 1.78 2.23 5.87 24.05 22.48 32.81 95.24
SH – CVg4 6.51 12.88 5.62 2.01 6.49 33.16 27.98 30.43 125.08
SH – SD5 4.89 13.02 2.23 2.34 3.85 28.54 20.63 23.92 99.42
Pesek & Baker 4.39 7.99 0.68 1.16 6.36 31.38 26.82 32.35 111.13
1 Values in bold correspond to the direct selection gains for the target trait 2 ED: selection among and within families. 3 M: mass selection
4 SH – CVg: selection by the classical index, using the genetic variation coefficient (CVg) as economic weight. 5 SH – SD: selection by the
classical index, genetic standard deviation (SD) as economic weight * NDM: number of days to maturity; PHM: plant height at maturity; IHP: insertion height of the first pod; Lo: lodging; AV: agronomic value; NP: number of pods; NS: number of seeds; GY: grain yield
Table 3. Estimates of selection gains (SG %) by the methods: direct and indirect selection, classical selection index of Smith & Hazel and Pesek & Baker selection index, in the soybean cross 2 (MGBR 95-20937 x BR-16)
Trait Method SG (%)
NDM PHM IHP Lo AV NP NS GY Total
Direct and Indirect selection1
NDM ED2 -2.78 1.20 -2.18 2.66 -1.16 0.28 -0.39 -3.18 -5.55
M3 -2.70 1.18 -2.09 2.21 -1.08 0.11 -0.63 -3.23 -6.23
PHM ED 0.27 11.85 6.88 2.63 -0.46 1.82 3.83 3.18 30.00
M 0.26 11.50 6.74 2.46 -0.69 0.20 1.80 1.27 23.54
IHP ED -0.24 3.48 14.28 0.25 -2.80 -8.56 -8.17 -13.50 -15.26
M -0.23 3.41 13.86 0.28 -2.68 -8.42 -8.12 -13.10 -15.00
Lo ED 0.87 3.86 0.73 -6.54 -2.84 -1.60 -1.95 -6.65 -14.12
M 0.72 3.63 0.82 -6.35 -2.68 -1.48 -1.80 -5.97 -13.11
AV ED -0.30 -0.54 -6.55 -2.27 8.72 19.66 21.77 36.05 76.54
M -0.28 -0.81 -6.27 -2.14 8.46 19.16 21.15 35.23 74.50
NP ED 0.03 0.92 -8.53 -0.55 8.39 27.98 30.59 50.10 108.93
M 0.01 0.10 -8.40 -0.50 8.17 27.16 29.76 48.66 104.96
NS ED -0.04 1.82 -7.69 -0.63 8.77 28.89 33.58 52.95 117.65
M -0.07 0.86 -7.64 -0.58 8.52 28.10 32.60 52.40 114.19
GY ED -0.19 0.88 -7.35 -1.24 8.40 27.37 31.21 55.90 114.98
M -0.20 0.35 -7.13 -1.11 8.21 26.58 30.30 54.26 111.26
SH – CVg4 -0.06 3.46 -2.38 -1.74 8.23 26.60 32.85 52.86 119.82
SH – SD5 -0.09 4.67 -1.11 -1.50 7.98 26.03 32.26 51.65 119.89
Pesek & Baker -0.03 1.64 -4.79 -1.18 8.71 27.12 33.12 54.90 119.49
1 Values in bold correspond to the direct selection gains for the target trait. 2 ED: selection among and within families. 3 M: mass selection.
4 SH – CVg: selection by the classical index, using the genetic variation coefficient (CVg) as economic weight. 5 SH – SD: selection by the classical
For trait NP, the direct gains obtained by mass selection and among and within families was also very close to those of the indices SH and PB and to the indirect gains for AV, NS and GY, also owing to the high correlations. The presence of some indirect that surpassed the direct gains (Tables 3, 5 and 6) was also observed, based on the explanations of Falconer (1987) as well, and indirect gains of considerable magnitude in the selection for NDM in cross 1 (Table 2). With exception of the SH index with standard deviation as weight in cross 3 (Table 4), the gains obtained with the use of the indices were close to those of direct selection throughout.
As for NP, the direct gains obtained by selection among and within families and mass for trait NS were close to the indirect gains with selection for AV, NP and GY, due to their high correlations and to the gains obtained with the indices, except for the SH index with standard deviation as economic weight in cross 3 (Table 4). The presence of higher indirect than direct gains was also observed (Tables 2 and 6), and considerable values in the selection for NDM in cross 1 (Table 2).
When analyzing trait GY, the most important from the economic point of view, mass selection resulted in
higher direct gains than those of selection among and within families in two crosses (Tables 2 and 4). These values were close, mainly, to the indirect gains obtained with selection for AV, NP and NS, and even achieved higher indirect gains in some cases (Tables 2, 4 and 5), which can be explained by the high correlations and heritabilities (Falconer, 1987). Furthermore, the high values of indirect gains in the selection for NDM in cross 1 (Table 2) are worth mentioning. The gains obtained by the indices were quite closes to the direct gains, with a slight inferiority of the SH index with the standard deviation as weight in the crosses 1, 3 and 4 (Table 2, 4 and 5).
It is noteworthy that the closeness of the gains obtained with direct selection, by the mass method as much as among and within families, to those obtained by the SH and PB indices, especially for the traits AV, NP, NS and GY, is very likely due to the fact that these traits were considered primary in the estimates of the indices, so the selection was mainly based on these traits.
In a comparison of our results to those of Oliveira et al. (1999), the direct gains of this experiment were similar for NP and NS and inferior for GY. The indirect gains for
Table 4. Estimates of the selection gains (SG %) by the methods: direct and indirect selection, classical selection index of Smith & Hazel and Pesek & Baker selection index, in the soybean cross 3 (Renascença x IAC Foscarin 31)
Trait Method SG (%)
NDM PHM IHP Lo AV NP NS GY Total
Direct and Indirect selection1
NDM ED2 -2.58 -5.77 -7.67 -4.38 1.36 9.41 8.73 12.16 11.26
M3 -2.66 -5.49 -7.08 -4.16 0.68 8.85 7.70 8.83 6.67
PHM ED -1.57 17.22 10.44 7.86 0.12 -5.33 -4.93 -4.68 19.13
M -1.50 17.74 11.46 8.04 0.11 -8.64 -7.35 -5.58 14.28
IHP ED -1.22 6.10 27.78 -4.05 0.08 -7.87 -7.59 -7.85 5.38
M -1.13 6.69 28.61 -4.16 0.17 -9.43 -8.63 -7.71 4.41
Lo ED -1.23 8.09 -7.14 -16.76 -3.79 -5.75 -5.91 -10.41 -42.90
M -1.17 8.27 -7.33 -17.27 -3.69 -6.36 -6.14 -9.56 -43.25
AV ED 0.52 0.16 0.19 -5.14 8.55 21.72 21.97 35.04 83.01
M 0.26 0.15 0.41 -5.00 8.80 22.12 22.47 35.84 85.05
NP ED 1.40 -2.89 -7.31 -3.03 8.44 33.99 33.38 49.78 113.76
M 1.31 -4.68 -8.75 -3.53 8.59 35.01 34.38 50.92 113.25
NS ED 1.30 -2.69 -7.08 -3.13 8.58 33.57 33.54 50.41 114.50
M 1.14 -4.01 -8.05 -3.25 -8.78 34.58 34.55 51.72 97.90
GY ED 1.07 -1.51 -4.33 -3.26 8.03 29.54 29.74 47.34 106.62
M 0.77 -1.79 -4.25 -2.99 8.26 30.21 30.52 48.76 109.49
SH – CVg4 0.13 3.21 13.50 -4.55 8.08 31.78 31.24 41.64 125.03
SH – SD5 -0.73 14.78 28.05 1.69 5.66 17.03 18.18 37.35 122.01
Pesek & Baker 0.80 0.15 -7.91 -2.93 8.60 33.97 33.63 47.84 114.15
1 Values in bold correspond to the direct selection gains for the target trait. 2 ED: selection among and within families. 3 M: mass selection
4 SH – CVg: selection by the classical index, using the genetic variation coefficient (CVg) as economic weight. 5 SH – SD: selection by classical
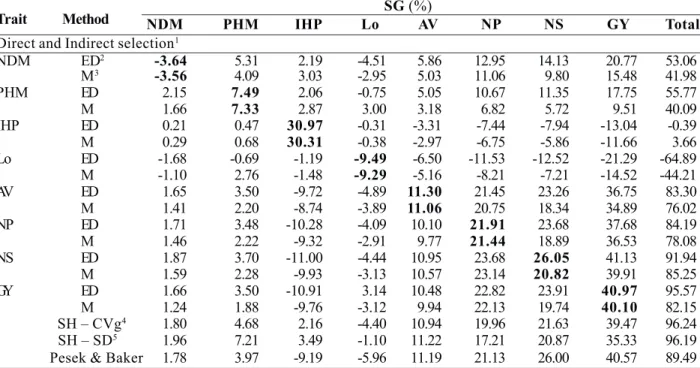
Table 5. Estimates of the selection gains (SG %) by the methods: direct and indirect selection, classical selection index of Smith & Hazel and Pesek & Baker selection index, in the soybean cross 4 (Renascença x IAC-17)
Trait Method SG (%)
NDM PHM IHP Lo AV NP NS GY Total
Direct and Indirect selection1
NDM ED2 -3.64 5.31 2.19 -4.51 5.86 12.95 14.13 20.77 53.06
M3 -3.56 4.09 3.03 -2.95 5.03 11.06 9.80 15.48 41.98
PHM ED 2.15 7.49 2.06 -0.75 5.05 10.67 11.35 17.75 55.77
M 1.66 7.33 2.87 3.00 3.18 6.82 5.72 9.51 40.09
IHP ED 0.21 0.47 30.97 -0.31 -3.31 -7.44 -7.94 -13.04 -0.39
M 0.29 0.68 30.31 -0.38 -2.97 -6.75 -5.86 -11.66 3.66
Lo ED -1.68 -0.69 -1.19 -9.49 -6.50 -11.53 -12.52 -21.29 -64.89
M -1.10 2.76 -1.48 -9.29 -5.16 -8.21 -7.21 -14.52 -44.21
AV ED 1.65 3.50 -9.72 -4.89 11.30 21.45 23.26 36.75 83.30
M 1.41 2.20 -8.74 -3.89 11.06 20.75 18.34 34.89 76.02
NP ED 1.71 3.48 -10.28 -4.09 10.10 21.91 23.68 37.68 84.19
M 1.46 2.22 -9.32 -2.91 9.77 21.44 18.89 36.53 78.08
NS ED 1.87 3.70 -11.00 -4.44 10.95 23.68 26.05 41.13 91.94
M 1.59 2.28 -9.93 -3.13 10.57 23.14 20.82 39.91 85.25
GY ED 1.66 3.50 -10.91 3.14 10.48 22.82 23.91 40.97 95.57
M 1.24 1.88 -9.76 -3.12 9.94 22.13 19.74 40.10 82.15
SH – CVg4 1.80 4.68 2.16 -4.40 10.94 19.96 21.63 39.47 96.24
SH – SD5 1.96 7.21 3.49 -1.10 11.22 17.21 20.87 35.33 96.19
Pesek & Baker 1.78 3.97 -9.19 -5.96 11.19 21.13 26.00 40.57 89.49
1 Values in bold correspond to the direct selection gains for the target trait. 2 ED: selection among and within families. 3 M: mass selection.
4 SH – CVg: selection by the classical index, using the genetic variation coefficient (CVg) as economic weight. 5 SH – SD: selection by the classical
index, genetic standard deviation (SD) as economic weight. * NDM: number of days to maturity; PHM: plant height at maturity; IHP: insertion height of the first pod; Lo: lodging; AV: agronomic value; NP: number of pods; NS: number of seeds; GY: grain yield
NP obtained here were similar to the selection for NS and inferior to the selection for GY, as much as with NS, with similar gains in the selection for NP and lower ones in the selection for GY. The indirect gains for GY with selection for NP and NS obtained here were lower though, and the gains by the PB index were higher for NP, similar for NS and lower for GY.
Similar amplitudes of gains were obtained by Reis et al. (2002), in the selection among and within families as much as in the mass selection for NDM, PHM and NP. For the latter two, the authors obtained some superior gains. Lower gains were observed by Reis et al. (2002) regarding trait GY.
The indirect gains for NDM and PHM, as well as the direct and indirect gains for NP and GY, were lower than the ones obtained by Backes et al. (2003) with selection for NP and GY, in most situations. With regard to the gains obtained by the Pesek and Baker index, the results of this experiment were somewhat inferior to those obtained by Backes et al. (2003) for NP and GY, and quite different for PHM, once the authors performed negative selection for this trait.
The direct gains for IHP, NP, NS and GY were moreover similar to those obtained by Costa et al. (2004), but inferior for PHM, Lo and AV. The indirect gains obtained here by selection for the other traits were similar for PHM, IHP, and Lo, while for AV, NP and NS some values were similar and others lower, and for GY some were similar and others higher. In respect of the gains obtained by the SH index, the results observed here were similar for all traits, while with the PB index, the gains for NP and NS observed by Costa et al. (2004) were lower, but similar for PHM, IHP, Lo, AV, and GY.
Based on our results of estimated gains, the crosses 3, based on the total gains, and 5, considering direct gains for GY, appear to be the most promising crosses. Cross 4 was the least promising for total gains and cross 1 for direct gains in GY.
Table 6. Estimates of the selection gains (SG %) by the methods: direct and indirect selection, selection index of Smith & Hazel and Pesek & Baker selection index, in the soybean cross 5 (Liderança x IAC-17)
Trait Method SG (%)
NDM PHM IHP Lo AV NP NS GY Total
Direct and Indirect selection1
NDM ED2 -4.48 9.04 -0.16 -0.15 3.49 6.18 4.86 6.98 25.76
M3 -4.33 8.83 -0.04 0.91 3.39 6.04 4.80 7.10 26.70
PHM ED 2.60 12.37 -4.58 3.88 4.93 11.09 9.36 16.93 56.58
M 2.54 11.96 -3.75 3.48 4.67 11.60 9.31 18.03 57.84
IHP ED -0.03 -3.27 13.40 -1.91 -3.25 -10.87 -9.36 -21.30 -36.59
M -0.01 -2.67 12.96 -0.76 -2.98 -11.03 -9.10 -21.36 -34.95
Lo ED -0.06 5.78 -3.99 -8.84 1.23 7.19 5.44 10.47 17.22
M 0.39 5.19 -1.58 -8.55 0.40 5.36 3.56 6.58 11.35
AV ED 1.32 6.49 -6.00 1.09 11.38 24.39 21.37 49.55 109.59
M 1.28 6.15 -5.51 0.36 11.01 23.64 20.81 47.85 105.59
NP ED 0.90 5.56 -7.63 2.42 9.28 25.90 22.62 53.76 112.81
M 0.87 5.81 -7.75 1.80 9.00 25.06 21.91 52.17 108.87
NS ED 0.76 5.18 -7.25 2.02 8.97 24.96 22.83 53.68 111.15
M 0.76 5.15 -7.06 1.32 8.74 24.18 22.09 51.79 106.97
GY ED 0.50 4.22 -7.43 1.75 9.37 26.72 24.17 59.82 119.12
M 0.51 4.49 -7.46 1.10 9.05 25.93 23.32 59.80 116.74
SH – CVg4 0.90 5.70 -7.26 1.91 11.12 24.97 22.36 59.84 119.54
SH – SD5 1.03 6.58 -7.73 2.33 11.01 24.92 22.17 59.30 119.61
Pesek & Baker 0.77 2.64 -5.33 -0.61 11.38 22.89 22.40 59.84 113.98
1 Values in bold correspond to the direct selection gains for the target trait. 2 ED: selection among and within families. 3 M: mass selection
4 SH – CVg: selection by the classical index, using the genetic variation coefficient (CVg) as economic weight. 5 SH – SD: selection by the classical
index, genetic standard deviation (SD) as economic weight. * NDM: number of days to maturity; PHM: plant height at maturity; IHP: insertion height of the first pod; Lo: lodging; AV: agronomic value; NP: number of pods; NS: number of seeds; GY: grain yield
without a significant loss in the main trait, giving the classical index of Smith and Hazel a slight advantage. The efficacy of the use of the selection indices was observed by Barbosa and Pinto (1998), Oliveira et al. (1999), Granate et al. (2002), Paula et al. (2002), as well as Costa et al. (2004).
Análise da seleção direta, indireta e por índices em
Análise da seleção direta, indireta e por índices em
Análise da seleção direta, indireta e por índices em
Análise da seleção direta, indireta e por índices em
Análise da seleção direta, indireta e por índices em
populações segregantes de soja
populações segregantes de soja
populações segregantes de soja
populações segregantes de soja
populações segregantes de soja
RESUMO- As estimativas de ganho com a seleção auxiliam no direcionamento dos programas de melhoramento e predição de sucesso no processo seletivo, sendo a seleção simultânea, através de índices de seleção, responsável pelo incremento no êxito do melhorista. Assim, o objetivo do presente trabalho foi estimar e comparar os ganhos genéticos obtidos pela seleção direta e indireta e pelos índices clássico e baseado nos ganhos desejados. Utilizou-se o delineamento de famílias com testemunhas intercalares, com 293 genótipos da geração F3, distribuídos em 32 famílias oriundas de cinco cruzamentos. Os ganhos individuais pela seleção direta entre e dentro de famílias e massal foram próximos e superiores aos índices, na maioria das situações. Por sua vez, os maiores ganhos totais ocorreram nos índices de seleção, os quais foram distribuídos entre todos os caracteres, destacando-se o índice clássico com os maiores ganhos genéticos.
Palavras-chave: Glycine max, índices de seleção, ganho esperado, seleção entre e dentro de famílias. ACKNOWLEDGEMENTS
REFERENCES
Backes RL, Reis MS, Cruz CD, Sediyama T and Sediyama CS (2003) Correlation estimates and assessment of selection strategies in five soybean populations. Crop Breeding and Applied Biotechnology 3: 107-116.
Barbosa MHP and Pinto CABP (1998) Eficiência de índices de seleção na identificação de clones superiores de batata. Pes-quisa Agropecuária Brasileira 33: 149-156.
Costa MM, Mauro AO, Unêda-Trevisoli SH, Arriel NHC, Bár-baro IM and Muniz FRS (2004) Ganho genético por diferen-tes critérios de seleção em populações segregandiferen-tes de soja.
Pesquisa Agropecuária Brasileira 39: 1095-1102.
Cruz CD and Regazzi AJ (1997) Modelos biométricos aplica-dos ao melhoramento genético.2nd ed., Editora UFV,
Vi-çosa, 390p.
Cruz CD (2001) Programa genes: versão Windows; aplicativo computacional em genética e estatística. Editora UFV, Viço-sa, 648p.
Falconer DS (1987) Introdução à genética quantitativa. Tradução de Martinho de Almeida e Silva e José Carlos Silva. UFV-Imprensa Universitária, Viçosa, 279p.
Fehr W R a n d C a v i n e s s J A ( 1 9 7 7 ) St a g e s o f s o y b e a n development. Iowa State University, Aimes, 11p. (Special Report 80)
Granate MJ, Cruz CD and Pacheco CAP (2002) Predição de ganho genético com diferentes índices de seleção no milho pipoca CMS-43. Pesquisa Agropecuária Brasileira 37: 1001-1008.
Hazel LN (1943) The genetic basis for constructing selection indexes. Genetics 28: 476-490.
Oliveira ACB, Sediyama CS and Cruz CD (1999) Selection for later flowering in soybean (Glycine max L. Merrill) F2 populations cultivated under short day conditions. Genetics and Molecular Biology 22: 243-247.
Paula RC, Pires IE, Borges RCG and Cruz CD (2002) Predição de ganhos genéticos em melhoramento florestal. Pesquisa Agropecuária Brasileira 37: 159-165.
Pesek J and Baker RJ (1969) Desired improvement in relation to selected indices. Canadian Journal of Plant Science 49: 803-804.
Ramalho MAP, Santos JB and Zimmermann MJO (1993)
Ge-nética quantitativa em plantas autógamas: aplicações ao melhoramento do feijoeiro. Editora UFG, Goiânia, 271p.
Reis EF, Reis MS, Cruz CD, Sediyama T and Teixeira RC (2002) Predicted and realized gains of different selection strategies in soybean populations: a comparative study. Crop Breeding and Applied Biotechnology 2: 61-70.
Smith HF (1936) A discriminant function for plant selection.