The Cryosphere, 10, 2589–2602, 2016 www.the-cryosphere.net/10/2589/2016/ doi:10.5194/tc-10-2589-2016
© Author(s) 2016. CC Attribution 3.0 License.
Frequency and distribution of winter melt events from passive
microwave satellite data in the pan-Arctic, 1988–2013
Libo Wang1, Peter Toose1, Ross Brown2, and Chris Derksen1
1Climate Processes Section, Climate Research Division, Environment and Climate Change Canada, Toronto, Ontario, Canada 2Climate Processes Section, Climate Research Division, Environment and Climate Change Canada@Ouranos, Montreal, Québec, Canada
Correspondence to:Libo Wang ([email protected])
Received: 19 May 2016 – Published in The Cryosphere Discuss.: 17 June 2016
Revised: 19 September 2016 – Accepted: 28 September 2016 – Published: 3 November 2016
Abstract. This study presents an algorithm for detecting winter melt events in seasonal snow cover based on tem-poral variations in the brightness temperature difference be-tween 19 and 37 GHz from satellite passive microwave mea-surements. An advantage of the passive microwave approach is that it is based on the physical presence of liquid wa-ter in the snowpack, which may not be the case with melt events inferred from surface air temperature data. The algo-rithm is validated using in situ observations from weather stations, snow pit measurements, and a surface-based pas-sive microwave radiometer. The validation results indicate the algorithm has a high success rate for melt durations last-ing multiple hours/days and where the melt event is preceded by warm air temperatures. The algorithm does not reliably identify short-duration events or events that occur immedi-ately after or before periods with extremely cold air tem-peratures due to the thermal inertia of the snowpack and/or overpass and resolution limitations of the satellite data. The results of running the algorithm over the pan-Arctic region (north of 50◦
N) for the 1988–2013 period show that winter melt events are relatively rare, totaling less than 1 week per winter over most areas, with higher numbers of melt days (around two weeks per winter) occurring in more temper-ate regions of the Arctic (e.g., central Québec and Labrador, southern Alaska and Scandinavia). The observed spatial pat-tern is similar to winter melt events inferred with surface air temperatures from the ERA-Interim (ERA-I) and Modern Era-Retrospective Analysis for Research and Applications (MERRA) reanalysis datasets. There was little evidence of trends in winter melt event frequency over 1988–2013 with the exception of negative trends over northern Europe
at-tributed to a shortening of the duration of the winter period. The frequency of winter melt events is shown to be strongly correlated to the duration of winter period. This must be taken into account when analyzing trends to avoid generat-ing false positive trends from shifts in the timgenerat-ing of the snow cover season.
1 Introduction
Snow cover is important in Arctic climate and ecological systems and has decreased in areal extent and duration es-pecially during the spring period in response to rapid Arc-tic warming in recent decades (Brown and Robinson, 2011; Callaghan et al., 2011; Derksen and Brown, 2012). The con-ventional wisdom is that Arctic warming will result in an in-crease in the frequency and duration of winter melt events, which may also include rain-on-snow (ROS) events. These winter melt–refreeze events modify the physical properties of snow (albedo, density, grain size, thermal conductivity), generate winter runoff (Bulygina et al., 2010; Johansson et al., 2011) and can result in potentially significant impacts on the surface energy budget, hydrology and soil thermal regime (Boon et al., 2003; Hay and McCabe, 2010; Rennert et al., 2009). The refreezing of melt water can also create ice lay-ers that advlay-ersely impact the ability of ungulate travel and foraging (Hansen et al., 2011; Grenfell and Putkonen, 2008), and exert uncertainties in snow mass retrieval from passive microwave satellite data (Derksen et al., 2014; Rees et al., 2010). Winter warming and melt events may also damage shrub species and tree roots, affecting plant phenology and
to larger modes of atmospheric circulation.
Microwave remote sensing measurements are very sensi-tive to the presence of liquid water in snow. Dry snow is a mixture of air and ice. Because the permittivity of water is much higher than air and ice at microwave frequencies, the introduction of even a small amount of liquid water (0.5 %) in snow can increase the permittivity of snow by over an order of magnitude (Ulaby et al., 1986). This increases absorption and reduces the penetration depth, which in turn results in a large increase in brightness temperature (TB) and decrease in radar backscatter. Satellite active and passive microwave measurements have been widely used for snowmelt detec-tion over various components of the Arctic cryosphere dur-ing the sprdur-ing melt period (e.g., Kim et al., 2011; Markus et al., 2009; Tedesco, 2007; Wang et al., 2011). Only a few satellite studies have focused on winter melt or ROS detec-tion, and are mainly for specific regions or limited time peri-ods (Bartsch, 2010; Bartsch et al., 2010; Dolant et al., 2016; Grenfell and Putkonen, 2008; Semmens et al., 2013; Wilson et al., 2013). Here we develop an algorithm to detect winter melt from satellite passive microwave (PMW) data over pan-Arctic snow-covered land areas north of 50◦N for the period 1988–2013.
Winter melt and ROS events can also be inferred from sur-face weather observations (Groisman et al., 2003; McBean et al., 2005; Pedersen et al., 2015), reanalyses (Cohen et al., 2015; Rennert et al., 2009), or reanalysis-driven snowpack models (Liston and Hiemstra, 2011). In most of these stud-ies, winter melt events are assumed to occur when the daily surface air temperature exceeds a certain threshold. For ex-ample, Groisman et al. (2003) defined a thaw day as a day with snow on the ground when the daily mean surface air temperature is above−2◦
C. Inferring thaw events from sur-face air temperatures in this way does not consider the energy balance of the snowpack. In addition, reanalysis datasets can contain important biases and inhomogeneities over the Arctic (e.g., Rapaic et al., 2015) that will impact the spatial and tem-poral frequency of the inferred winter thaw events. The ad-vantage of the passive microwave approach described above is that melt events are directly linked to the appearance of liq-uid water in snow which drives changes in snowpack prop-erties relevant to Arctic ecosystems. The brightness temper-ature time series is also considered to be consistent over the 1988–2013 period as it is derived from near-identical space-borne sensors.
Previous studies have linked field observations of ice layer formation from ROS events with satellite measurements (Bartsch et al., 2010; Grenfell and Putkonen, 2008), but few studies have showed links between satellite measurements and in situ observations of changes in snow properties from melt–refreeze events (Langlois et al., 2012; Nghiem et al., 2014). Passive microwave satellite data have two important limitations for detecting melt–refreeze events: the relatively coarse resolution (10–25 km) and the twice-daily overpasses. Thus, melt events of short duration or limited spatial distri-bution may not be detectable. The objectives of this study are to (1) develop an algorithm for winter melt detection from PMW data and (2) to characterize winter melt events detectable by PMW at the satellite scale using weather sta-tion observasta-tions, surface-based PMW radiometer measure-ments, and snow pit surveys observed during multiple field campaigns. These PMW results are compared to winter melt detection results inferred from near surface air temperature fields from two commonly used reanalysis datasets. Trends in PMW-derived winter melt frequency over the period 1988– 2013 are presented along with a demonstration of the impact on trend results of using a fixed winter period for defining the snow season.
2 Data and methods
2.1 Satellite passive microwave data
L.
W
ang
et
al.:
Fr
equency
and
distrib
ution
of
winter
melt
ev
ents
2591
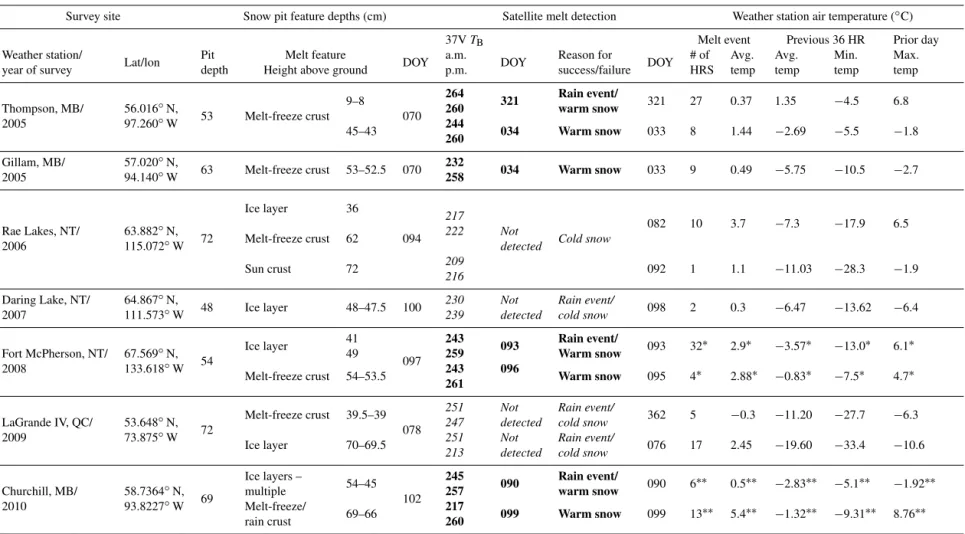
Table 2.Performance summary of the satellite melt detection using the winterTBD algorithm at snow pit survey sites across Canada, characterized with coincident nearby weather
station air temperatures. The performance of the winterTBD algorithm is highlighted in bold for a successful melt detection and in italic for a failed detection.
Survey site Snow pit feature depths (cm) Satellite melt detection Weather station air temperature (◦C)
37VTB Melt event Previous 36 HR Prior day
Weather station/
Lat/lon Pit Melt feature DOY a.m. DOY Reason for DOY # of Avg. Avg. Min. Max.
year of survey depth Height above ground p.m. success/failure HRS temp temp temp temp
53 Melt-freeze crust
9–8
070
264
321 Rain event/ 321 27 0.37 1.35 −4.5 6.8
Thompson, MB/ 56.016◦N, 260 warm snow
2005 97.260◦W
45–43 244 034 Warm snow 033 8 1.44 −2.69 −5.5 −1.8
260
Gillam, MB/ 57.020◦N,
63 Melt-freeze crust 53–52.5 070 232 034 Warm snow 033 9 0.49 −5.75 −10.5 −2.7
2005 94.140◦W 258
Ice layer 36
217
082 10 3.7 −7.3 −17.9 6.5
Rae Lakes, NT/ 63.882◦N,
72 Melt-freeze crust 62 094 222 Not Cold snow
2006 115.072◦W detected
Sun crust 72 209 092 1 1.1 −11.03 −28.3 −1.9
216
Daring Lake, NT/ 64.867◦N,
48 Ice layer 48–47.5 100 230 Not Rain event/ 098 2 0.3 −6.47 −13.62 −6.4
2007 111.573◦W 239 detected cold snow
54
Ice layer 41
097
243
093 Rain event/ 093 32∗ 2.9∗
−3.57∗
−13.0∗ 6.1∗
Fort McPherson, NT/ 67.569◦N, 49 259 Warm snow
2008 133.618◦W
Melt-freeze crust 54–53.5 243 096 Warm snow 095 4∗ 2.88∗ −0.83∗ −7.5∗ 4.7∗
261
72
Melt-freeze crust 39.5–39
078
251 Not Rain event/
362 5 −0.3 −11.20 −27.7 −6.3
LaGrande IV, QC/ 53.648◦N, 247 detected cold snow
2009 73.875◦W
Ice layer 70–69.5 251 Not Rain event/ 076 17 2.45 −19.60 −33.4 −10.6
213 detected cold snow
69
Ice layers –
54–45 102
245
090 Rain event/ 090 6∗∗ 0.5∗∗ −2.83∗∗ −5.1∗∗ −1.92∗∗
Churchill, MB/ 58.7364◦N, multiple 257 warm snow
2010 93.8227◦W Melt-freeze/
69–66 217 099 Warm snow 099 13∗∗ 5.4∗∗ −1.32∗∗ −9.31∗∗ 8.76∗∗
rain crust 260
∗Indicates that the weather station data are available only during airport business hours (recorded by observer), thus average values are not comparable to other 24 HR stations. ∗∗Indicates that air temperatures from a local meteorological station were used instead of the Churchill Climate Station (local met station was closer to the snow pit).
www
.the-cry
ospher
e.net/10/2589/2016/
The
Cry
ospher
e,
10,
2589–
2602
,
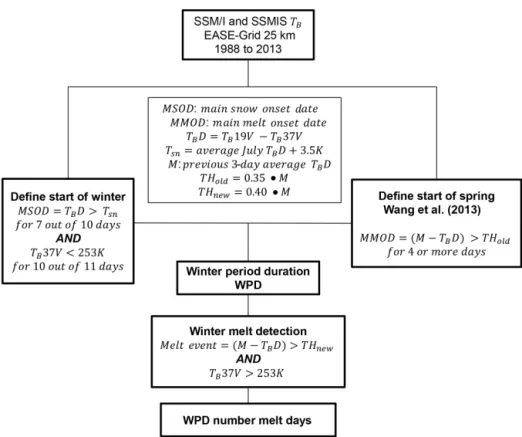
Figure 1.Schematic flow chart of the winterTBD melt detection method for PMW satellite data.
likelihood of observing melt events. Due to large temporal gaps in the early SSM/I record, the time series used begin in the fall of 1988 and extend to 2014 (Table 1). Although horizontal polarized measurements are more sensitive to ice lenses within the snowpack (Derksen et al., 2009; Rees et al., 2010), there is not much difference between the two po-larizations for melt detection and we use vertically polarized measurements to be consistent with Wang et al. (2013).
2.2 Winter melt detection method for PMW
As the purpose of this study is to detect winter melt events, the winter period duration (WPD) is defined as occurring be-tween the main snow onset date (MSOD) in the fall (begin-ning of continuous dry snow cover on the ground) and the main melt onset date (MMOD) in the spring (i.e., the begin-ning of the period with frequent melt–refreeze diurnal cycles) at each pixel. Figure 1 illustrates the steps involved in detect-ing melt events for the WPD, based on the temporal varia-tions in the difference of the brightness temperature (TBD) between 19 and 37 GHz and a 37 GHzTBthreshold. For dry snow conditions, as snow accumulatesTBD increases due to the larger scattering effect of the microwave signal by snow grains at 37 vs. 19 GHz (Chang et al., 1987). Upon the ap-pearance of liquid water in snow, TB increases at both fre-quencies and results in a sharp drop inTBD to similar mag-nitudes seen in snow-free conditions, but will quickly revert
back to dry snowTBD levels once the snow refreezes, allow-ing for the detection of melt–refreeze events (Fig. 2).
The purpose of determining MSOD is to capture the earli-est start date of the continuous dry snowpack. The MSOD is determined as the first date when (1)TBD≥Tsn (a thresh-old=mean July TBD+3.5 K) for 7 out of 10 days and (2)TB37v < 253 K for 10 out of 11 days (Fig. 1). The thresh-olds and conditions were optimized by comparing the PMW determined MSOD to daily snow depth observations from the Global Surface Summary of the Day dataset archived at the National Climate Data Center (http://www.ncdc.noaa. gov). TheTB criterion in (2) is applied to exclude periods withTBD fluctuations related to early season freeze/thaw cy-cles rather than winter melt events (see below for its deriva-tion).
L. Wang et al.: Frequency and distribution of winter melt events 2593 190 200 210 220 230 240 250 260 270 280 -10 -5 0 5 10 15 20 25 30 28 0 28 5 29 0 29 5 30 0 30 5 31 0 31 5 32 0 32 5 33 0 33 5 34 0 34 5 35 0 35 5 36 0 36
5 5 10 15 20 25 30 35 40 45 50 55 60 65 70 75 80 85 90 95
10 0 10 5 11 0 11 5 12 0 12 5 13 0 Tb ( K ) T b 19 -T b 37 ( K )
Day of year 2013 2014
Tb difference 37 GHz Tb
-30 -20 -10 0 10 20 30 40 50 60 70 28 0 28 5 29 0 29 5 30 0 30 5 31 0 31 5 32 0 32 5 33 0 33 5 34 0 34 5 35 0 35 5 36 0 36
5 5 10 15 20 25 30 35 40 45 50 55 60 65 70 75 80 85 90 95
10 0 10 5 11 0 11 5 12 0 12 5 13 0 A ir t emp ( ºC )/ sn ow de pt h ( cm )
Day of year in 2013 –2014 – Snow depth
Tmax Tmin
MSOD MMOD
–
–
Figure 2.Example of time series of SSM/ITBD(a)and daily surface air temperature (◦C)/snow depth (cm)(b)at Pudasjarvi, Finland (65.4◦N, 26.97◦E) during the 2013–2014 winter. The vertical grey lines/bars in(a)represent melt events detected by satellite.
study), and secondly, a TB37v threshold condition is added following Semmens et al. (2013) to mitigate false detection due to TBD changes not related to melt (e.g., from noise or artifacts from data gap filling). The resulting expression for winter melt event conditions is (M−TBD) > THnewand
TB37v≥253 K for one day (Fig. 1), referred to as the winter
TBD algorithm hereafter. TheTB37v≥253 K condition was obtained by evaluating a range ofTB37v values from 250 to 255 K, at 1 K increments to identify the threshold most sensi-tive to the presence/absence of liquid water in snow. This was inferred from histograms of daily maximum (Tmax), mean (Tm), and minimum (Tmin) air temperatures for days detected as melting at all available weather stations during 2000– 2007 (see locations in Fig. 5b, ∼5100 observations in to-tal). The results show that forTB37v=253 K,Tmaxis≥0◦C for nearly 96 % of cases,Tminis < 0◦C for 94 %, andTmis
≥0◦C for 80 %. This suggests that the PMW-detected winter melt events are consistent with diurnal positive air tempera-ture events, while most of the events (80 %) probably last multiple hours, thus corresponding to days with Tm≥0◦C. If a melt event is detected within 10 days of the MMOD, then it is not considered a mid-winter melt event but rather a preliminary melt event to the MMOD, and is excluded from the analysis.
An example of the performance of the winterTBD algo-rithm is shown in Fig. 2 for a case at Pudasjarvi, Finland (65.4◦
N, 26.97◦
E), during the 2013–2014 winter. At Pudas-jarvi station, the snow depth first became greater than 0 cm on day of year (DOY) 291 of 2013. The snow depth was mostly less than 10 cm for days 291 to 332, with two periods of no snow on the ground whileTmaxfluctuated around 0◦C. The PMW detected MSOD was on DOY332, corresponding within one week of the date of continuous snow cover above
10 cm observed at the station (Fig. 2b). MMOD was detected on DOY64 of 2014; however, there was still snow on the ground until DOY108, typical of high-latitude snow cover where melt onset is followed by the spring thaw, which is a sustained period with high diurnal air temperature variation where the snowpack is melting during the day and refreezing at night. At the end of this melt–refreeze period, the snow-pack may be actively melting both day and night until snow disappearance, which can take several weeks (Semmens et al., 2013). During winter 2013–2014, 20 melt days in total were detected at Pudasjarvi, all corresponding to days with
Tmax≥0◦C. However, not all days withTmax≥0◦C are de-tected by PMW as melting, for example DOY351–352, for reasons which will be explained further in the validation sec-tion.
The winterTBD algorithm is applied to time series ofTB for each winter over the period 1988–2013. Melt events may last from one to several days and in some cases the algo-rithm may split events. For this reason we use the annual number of melt days (rather than number of events) in pre-senting and analyzing the results. The WPD varies at each pixel and is determined by MSOD and MMOD as described above. This approach is referred to as “PMW-varying” in the following analysis. Since we focus on melt events dur-ing the winter period, theTBD algorithm is only applied to pixels with MSOD detected before the end of December and with MMOD later than 1 March, i.e., with WPD > 60 days. The PMW-varying approach is internally consistent in that it takes account of annual variations in winter temperature and snow cover. This is not the case for analysis using a fixed “winter” window where spurious trends can be created from changing seasonality (i.e., earlier snow melt). To highlight this, a fixed window approach is also applied (“PMW-fixed”)
Figure 3. (a)Time series of hourly air temperature and daily snow depth andTBat the Thompson, Manitoba Meteorological Station from September 2004 to May 2005; the shaded grey bars highlight the timing of the melt events detected by the PMW satellite data.(b)Snow stratigraphy from the KM050 snow pit site surveyed on DOY097. Note that both the early season and recent melt crusts observed in the snow pit agree reasonably well with the timing of two winter melt events recorded at the Thompson airport and detected by the PMW satellite data.
where theTBD algorithm is applied to time series ofTBfrom November to April. The results presented in the following sections are from the PMW-varying method unless explicitly indicated otherwise. Since the microwave response of melt on permanent snow and ice is different from seasonal terres-trial snow cover, we mask out the Greenland ice sheet and glaciers in our analyses.
2.3 Winter melt detection for reanalysis datasets
Winter melt event information from the 0.75◦×0.75◦ lati-tude/longitude European Centre for Medium-Range Weather Forecasts Re-Analysis Interim (ERA-I) (Dee et al., 2011) and the 1/2◦
latitude by 2/3◦
longitude Modern Era-Retrospective Analysis for Research and Applications (MERRA) (Rienecker et al., 2011) reanalyses were used to evaluate the melt event climatology generated by the PMW method. Melt events in the reanalyses are inferred from 6-hourly air temperatures over the same period as the satellite data. For the comparison, a winter thaw event is defined as a period of above-freezing daily mean air temperature occur-ring duoccur-ring the winter period dominated by below-freezing air temperatures. Here the winter period is defined by 0◦
C crossing dates (between fall and spring) obtained with a cen-tered 30-day moving average of daily mean air temperature, which is analogous to the “PMW-varying” method described above. An additional condition is imposed of a surface snow cover of at least 10 cm depth for ERA-I and 4 mm SWE (snow water equivalent) for MERRA to obtain results com-parable to the PMW method of detection over snow-covered ground. The mean daily air temperature is the average of the 00:00, 06:00, 12:00 and 18:00 UTC values. Snow depths for ERA-I are taken from the daily snow depth reconstruction described in Brown and Derksen (2013) to avoid various in-consistencies with the snow depths in the reanalysis.
-8 -6 -4 -2 0 2 4 6 8 10 170 180 190 200 210 220 230 240 250 260 270 9: 57 :46 10 :2 7: 45 10 :5 7: 46 11 :2 7: 46 11 :5 7: 49 12 :2 7: 52 12 :5 7: 42 13 :2 7: 46 13 :5 7: 54 14 :2 8: 03 14 :5 8: 10 15 :2 8: 15 15 :5 8: 19 16 :2 8: 24 16 :5 8: 31 17 :2 8: 37 17 :5 8: 44 18 :2 8: 54 18 :5 9: 02 19 :2 9: 11 19 :5 9: 24 20 :2 9: 35 20 :5 9: 36 21 :2 9: 48 22 :0 0: 00 22 :3 0: 01 23 :0 0: 03 23 :3 3: 14 0: 03 :02 0: 32 :52 1: 02 :43 1: 32 :37 2: 02 :31 2: 32 :25 3: 02 :19 3: 32 :14 4: 02 :10 4: 32 :06 Temp er a tu re ( 0C) B ri g h tn e ss te m p e ra tu re ( K ) Local time T19V T37V Melt Tair +200 cm Tair +11 cm Tair +7 cm Tair +3 cm Tsnow -1 cm Tsnow -5 cm
253K
Figure 4. Time series of the surface-based radiometer TB and the air/snow temperature measurements recorded during 12– 13 April 2010 at Churchill MB (58.74◦N, 93.82◦W). The green shaded region highlights the period when the winterTBD algorithm successfully detected a winter melt event, the onset of which coin-cides very closely with the 2 m air temperature sensor.
2.4 In situ field observations and methods
The satellite-based winterTBD algorithm is validated with surface-based PMW radiometer measurements and near-surface air/snow temperature observations recorded on 12– 13 April 2010 during a field campaign near Churchill, Man-itoba, Canada (Derksen et al., 2012). A modified version of the winterTBD algorithm is applied to the surface-based ra-diometer measurements due to the continuous nature of the data. We simply used the averageTBvalues from the stable pre-melt period as our reference frozenTBD value instead of a previous 3-day average.
L. Wang et al.: Frequency and distribution of winter melt events 2595
recorded during multiple PMW snow measurement cam-paigns conducted between 2005 and 2010 in both the bo-real forest and tundra environments of Canada (Table 2). The number of satellite-detected melt events for the specific EASE-Grid pixels surrounding the snow pit locations are compared to the number of melt forms/ice formations iden-tified within the snowpack. A melt feature ideniden-tified lower (closer to the ground) is consider an early winter event, while those melt features identified closer to the surface of the snow are considered more recent events. An example of the coin-cident satellite, air temperature and snow pit information for a survey site near Thompson, Manitoba, is shown in Fig. 3. Hourly air temperatures from weather stations in the vicinity of the snow pits (within 70 km) are examined to identify if and when a melt event occurred in the region; how long the melt event lasted; what the average temperature was for the duration of the event and what the minimum, maximum and average 36 h air temperatures were preceding the melt event. Results of the field evaluation are presented in Sect. 3.1 2.5 Other data and analysis methods
Gridded (5◦
×5◦
) monthly surface air temperature over land areas during the study period are obtained from the Climatic Research Unit (University of East Anglia) CRUTem4 dataset (Jones et al., 2012). Seasonal air temperature trends for the fall (September–November), winter (December–February) and spring (March–May) periods are computed to assist the interpretation of trends in winter melt events. The Mann– Kendall method is used for trend analysis taking into account serial correlation following Zhang et al. (2000). Trends are only computed at grid cells with melt events detected in at least 12 winters, and grid cells with trends statistically sig-nificant at 90 % level are shown. Correlations between the winter melt-related variables are computed using the Pear-son correlation method with significance levels determined from the two-tailed Student’sttest.
3 Results
3.1 Field evaluation of the winterTBD algorithm
Figure 4 illustrates the time series of the surface-based radiometer TB and air/snow temperature measurements recorded during the 12–13 April melt event near Churchill. The area shaded in green highlights the period for which the modified TBD algorithm identified the melt event. As the near-surface air temperatures approached 0◦
C, TB in-creased rapidly at both 19 and 37 GHz. The detected melt onset occurred ∼40 min after the 11 cm and 7 cm air tem-peratures crossed the 0◦
C threshold and 25 min before the 2 m air temperature exceeded 0◦
C, likely due to radiant heat-ing from the sun to the snow surface and the boundary layer air temperature probe. The−1 cm snow temperature did not reach 0◦
C until 3 h after the detected melt onset, suggesting
that the rapid increases inTBhere were responses to the ap-pearance of liquid water in the snow surface. The influence of radiant heating is evident during the late afternoon/early evening as the incoming solar radiation lessens as the sun begins to set (∼19:00 LT), at which point the snowpack and boundary layer air temperatures all drop below 0◦
C, coincid-ing with a decrease inTBeven while the 2 m air temperatures are still positive. Compared to the rapid increase inTBduring the melt onset, the more gradual decrease inTBis likely due to the mixed effects of uneven refreezing of the snow surface and delayed freezing of subsurface liquid water.
The validation results from the seven snow pit survey sites and 12 melt events are summarized in Table 2. The perfor-mance of the winter TBD algorithm is highlighted in bold for a successful melt detection and in italic for a failed de-tection. The results suggest that a successful detection is likely when the melt duration lasts for periods longer than 6 h and/or the melt event has been preceded by warm air temper-atures that have warmed the snowpack to near melting con-ditions (previous day’sTmax>−3◦C). In these situations, it is common for melt features to form within the snowpack. The algorithm does not reliably identify short duration melt events or events that occur immediately after extremely cold air/snowpack temperatures (previous 36 h minimum air tem-perature <−13◦
C). In these instances, the snowpack likely has enough thermal inertia to remain within a frozen state for the whole duration of the melt event, or very quickly re-turn to a frozen state and thus liquid water is not detectable with satelliteTB. Out of all 12 melt events investigated, 6 events coincided with observed ROS. Of the six ROS events, half were associated with successful satellite melt detection. Those ROS events that were successfully detected were fol-lowed by a continued warming of air temperatures that likely delayed the refreezing of the liquid water in the snow. Those ROS events that were not detected fall under the category of a short-duration melt event as described above.
The winterTBD algorithm is very sensitive to liquid water within the snow, but does not necessarily capture all events that can create melt features within the snowpack, largely due to the fact that liquid water from both melt and ROS events tends to re-freeze quickly during the winter months. Unless these events occur very close to the timing of the satellite overpass (ascending∼18:30 LT and descending 06:30 LT), they may remain undetected. In addition, widespread, spa-tially expansive melt or ROS events are rare (Bartsch, 2010; Cohen et al., 2015), and as such may be missed by the coarse-resolution (25 km) PMW data. These limitations are common to other melt detection techniques that utilize current space-borne passive microwave sensors.
3.2 The spatial distribution of winter melt events Figure 5 shows the PMW-derived MSOD, MMOD and WPD during the 1988–2013 period. On average, continuous snow cover starts in the Canadian Arctic islands and high-elevation
Figure 5.The mean main snow onset date in fall(a), main melt onset date in spring(b), and mean winter period duration (days)(c)during the period 1988–2013. The black dots in(b)represent WMO weather stations used for algorithm development and evaluation.
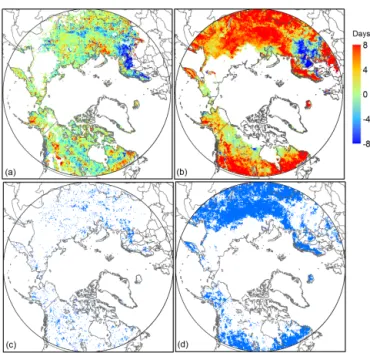
Figure 6. The average annual number of melt days over 1988– 2013 from(a)PMW using a varying winter period;(b)PMW using a fixed winter period (November to April);(c)ERA-Interim; and (d)MERRA.
regions of the Arctic in September and progresses to the open tundra in October (Fig. 5a). By November, most of the areas north of 50◦
N are covered by snow except for some tem-perate maritime and lower-latitude regions where continuous snow cover sets in December. The spring main melt onset starts at lower latitudes in March, progresses to the boreal forests and tundra in April/May, and reaches the high Arc-tic in June (Fig. 5b), giving rise to spatial variability in the duration of the winter period from one to seven months on average (Fig. 5c). A pixel-wise definition of winter period for melt detection is required to account for this spatial vari-ability as well as the temporal varivari-ability from year-to-year fluctuations in snow cover.
During the 26 winters covered by this study, melt occurred at least once everywhere north of 50◦
N using the PMW-varying window method (Fig. 6a). However, the average
cu-mulative number of melt days is less than one week per win-ter for most areas, with more melt days (around two weeks per winter) occurring in areas with a relatively long snow sea-son and more temperate winter climates (e.g., central Québec and Labrador, southern Alaska and Scandinavia). The spatial distribution patterns of NMD (number of melt days) from ERA-I (Fig. 6c) and MERRA (Fig. 6d) generally agree with that from PMW. However, ERA-I detects about one week more melt days on average in most areas, while MERRA de-tects fewer melt days in Québec and central Canada relative to PMW. Both ERA-I and MERRA detect more melt days in southern Alaska and western North America (NA). These are relatively deep snowpack regions where melt may not occur in short periods of freezing air temperatures due to the ther-mal inertia of the snowpack. Compared to the PMW-varying window method (Fig. 6a), there are many more melt days de-tected using the PMW-fixed window method (Fig. 6b), espe-cially in the relatively temperate climate regions (e.g., north-ern Europe and lower latitudes of NA and Russia) where the WPD is relatively short and thus limits the possible number of melt days to be detected.
Figure 7 shows the monthly mean NMD from October to June during the period 1988–2013. Winter melt events mainly occur in the fall (October–November) and spring (April–June) months at high latitudes (> 60◦N) where con-tinuous snow starts early and melts late (Fig. 5). During November to March for the period 1988–2013, no winter melt events are detected across large areas of Siberia and the Canadian and Alaskan tundra where the monthly surface air temperature is usually lower than−20◦
C (not shown). On average, April has the maximum extent and duration of win-ter melt events (Fig. 7).
L. Wang et al.: Frequency and distribution of winter melt events 2597
Figure 7.Monthly mean number of melting days from PMW during the period 1988–2013.
Figure 8.Mann-Kendall trends (days/26 years) over the period 1988–2013 in(a)MSOD,(b)MMOD,(c)WPD. Grid cells with trends statistically significant at the 90 % level are shown in(d)MSOD,(e)MMOD, and(f)WPD.
earlier melt over most of the Arctic except for northern Eu-rope and western NA (Fig. 8b, e). The net effect is signif-icant negative trends in winter duration period that exceed
−10 days decade−1over large regions of the Arctic (Fig. 8c, f).
Figure 9. Mann-Kendall trends (days/26 years) over the period 1988–2013 in the number of winter melt days from (a) PMW; (b)PMW-fixed;(c)and(d)show grid cells with trends statistically significant at the 90 % level in(a)and(b)respectively.
Over the study period, there are few significant trends in NMD over the Arctic (Fig. 9a, c), and where there are sig-nificant trends, these are dominated by decreases over north-ern Europe. The spatial distribution pattnorth-erns of NMD trends contrast markedly between the varying and the PMW-fixed results (Fig. 9b, d). Trends from PMW-PMW-fixed are dom-inated by increasing trends in NMD over most of the Arc-tic except for northern Europe. Corresponding trends from the reanalyses are not shown because the annual winter thaw frequency series from ERA-I and MERRA are not always consistent over the 1988–2013 period in some regions. For example over northern Québec (not shown) the two series are well correlated over the period from 1980 to 2001 (r=0.75,
p< 0.001) but diverge markedly after 2001, when numerous changes in data assimilation streams occurred in both reanal-ysis datasets (Rapaic et al., 2015). This underscores the ad-vantage of the PMW melt detection approach, which is based on a consistentTBtime series.
4 Discussion and conclusions
An algorithm for detecting terrestrial winter melt events us-ing satellite PMW measurements is developed and evaluated using in situ observations at weather stations and field sur-veys. The winter TBD algorithm is able to successfully de-tect winter melt events lasting for more than 6 h in different environments but is less successful for short duration melt and ROS events due to the thermal inertia of the snowpack and/or the overpass and resolution limitation of the PMW
Figure 10.The correlation coefficient between number of melt days and the duration of winter period from PMW during 1988–2013. Correlations greater than 0.35 are statistically significant at 90 % confidence level.
Figure 11. (a)Surface air temperature trends (◦C/26 years) dur-ing the winter season (DJF) for north of 50◦N land areas from CRUTem4 over the period 1988–2013,(b) grid cells with trends statistically significant at the 90 % level in(a).
data. The algorithm should also be able to detect subsurface melt events although this aspect is not evaluated in this paper. Similar channel difference approaches have also been used for melt onset detection over the Arctic sea ice (e.g., Drobot and Anderson, 2001). However, the emissivities of first-year sea ice are different than that of multi-year sea ice, and the emissivities over multi-year sea ice can have a large range due to the varied histories of the ice floes. These complicate the detection of melt over sea ice, so we do not recommend the use of the algorithm developed in this study for melt tection over sea ice. A multiple indicators approach was de-veloped in Markus et al. (2009) for melt–refreeze detection over the Arctic sea ice.
During the period 1988–2013, winter melt occurred at least once everywhere north of 50◦
L. Wang et al.: Frequency and distribution of winter melt events 2599
Figure 12.Mann-Kendall trends (days/26 years) in the number of melt days derived by PMW-fixed from November to April during the period 1988–2013.
lower than−20◦
C. The spatial distribution patterns of NMD are in general consistent with results inferred from surface air temperature data in the reanalysis datasets (ERA-I and MERRA) and PMW, and also with the spatial patterns of refreeze events derived from QuikSCAT for north of 60◦
N (Bartsch, 2010; Bartsch et al., 2010).
Over the period 1988–2013, large regions of the Arc-tic exhibit trends toward later snow onset in fall and ear-lier melt onset in spring, resulting in significant negative trends in winter period duration. The number of melt days was observed to be significantly positively correlated with the duration of winter period over most of the Arctic, par-ticularly in regions where interannual variability in snow cover is higher (Fig. 10). However, there are few areas of the Arctic with locally significant trends in NMD except for northern Europe, where there is evidence of significant negative NMD trends consistent with the positive correla-tions between WPD and NMD over this area (as shown in Fig. 10). The lack of significant trends in winter melt events observed in this study is considered to be related to the relatively short period of data available for analysis and the dynamic mechanisms generating winter melt and ROS events that produce more random and chaotic environmen-tal response patterns (Trenberth et al., 2015; Cohen et al., 2015). This is underscored by trend analysis of annual num-bers of winter melt events in ERA-I and MERRA over a longer 1980–2014 period (not shown) where locally signif-icant increasing trends were only observed at 1 % of snow-covered land points in MERRA and 2 % in ERA-I. Cohen et al. (2015) also found that the frequency of ROS events was correlated to large-scale modes of atmospheric
circu-lation that contributes to regional-scale variability in ROS trends. The absence of positive winter melt trends observed in this study may also be linked to the seasonal pattern of warming over Arctic land areas during 1988–2013, which is dominated by warming in the snow cover onset fall period (trend=0.67◦
C decade−1, p< 0.001) with comparatively little warming in the winter (trend= −0.15◦
C decade−1,
p=0.47) and spring (trend=0.20◦
C decade−1, p=0.22) period. The spatial character of winter warming over the pe-riod (Fig. 11) also shows little warming or cooling over the regions experiencing the largest NMD frequencies. This con-clusion is consistent with the findings of Cohen et al. (2012). There is field evidence of changes in snowpack density and ice layers from a number of locations in the Arctic that is supported by an increased frequency of winter thaw events (Chen et al., 2013; Groisman et al., 2003; McBean et al., 2005; Johansson et al., 2011). However, winter thaw events in some of these studies were inferred from air temperature observations (Groisman et al., 2003; McBean et al., 2005), which are different from results detected by PMW measure-ments.
As previously pointed out in Fig. 9b, the frequency of win-ter melt events is strongly influenced by the method used to define WPD. A spatially and temporally varying definition of WPD is required as the use of a fixed window generates artificial NMD trends from changes in the timing of the snow cover season. This is further demonstrated in Fig. 12, where monthly NMD trends are computed using a fixed WPD of November–April. The results clearly demonstrate that in-creases in NMD are being driven by trends during the snow cover shoulder seasons of November–December and March–
is also consistent over time unlike some reanalysis datasets. Several studies have focused on the development of ROS de-tection methods using PMW data and encouraging results were obtained at some field sites (e.g., Dolant et al., 2016; Grenfell and Putkonen, 2008; Langlois et al., 2016). Future work will focus on the detection of pan-Arctic ice lenses (from both melt–refreeze and ROS events) by integrating PMW techniques. Additional work is also needed to evaluate the performance of the winter melt algorithm in areas with deep snow and complex terrain where the range inTBD for dry snow vs. wet snow is likely to be much smaller (Tong et al., 2010).
5 Data availability
PMW: Armstrong, R. L., Knowles, K. W., Brodzik, M. J., and Hardman, M. A.: http://nsidc.org/data/NSIDC-0032.
ERA-Interim: Dee, D. P., Uppala, S. M., Simmons, A. J., Berrisford, P., Poli, P., Kobayashi, S., Vitart, F., http://apps. ecmwf.int/datasets/data/interim-full-daily/levtype=sfc/.
MERRA: Rienecker, M. M., Suarez, M. J., Gelaro, R., Todling, R., Bacmeister, J., Liu, E., Bosilovich, M. G., Schu-bert, S. G., Takacs, L., Kim, G.-K., Bloom, S., Chen, J., Collins, D., Conaty, A., Silva, A., Gu, W., Joiner, J., Koster, R. D., Lucchesi, R., Molod, A., Owens, T., Pawson, S., Pegion, P., Redder, C. R., Reichle, R., Robertson, F. R., Ruddick, A. G., Sienkiewicz, M., and Woollen, J.: https: //climatedataguide.ucar.edu/climate-data/nasa-merra.
Weather Station Data Global Surface Summary of the Day dataset archived at the National Cli-mate Data Center https://data.noaa.gov/dataset/ global-surface-summary-of-the-day-gsod.
CRUTem4: Jones, P. D., Lister, D. H., Osborn, T. J., Harpham, C., Salmon, M. and Morice, C. P.: http://www. metoffice.gov.uk/hadobs/crutem4/.
Surface-based Radiometer: it will be published in Environ-ment Canada Data Catalogue, http://donnees-data.intranet. ec.gc.ca/geonetwork/home/eng.
If readers want a copy of the data before it is published, please contact the authors. The snow pit data used in the pa-per are included in Table 2.
Hydro, the Northwest Territories Power Corporation and Indian and Northern Affairs Canada. The following data centers are acknowledged for providing data: The National Snow and Ice Data Center for passive microwave satellite data, the National Climate Data Center for the Global Summary of the Day dataset, the Climatic Research Unit – University of East Anglia for the CRUtem4v gridded air temperature data, the European Centre for Medium-Range Weather Forecasts (ECMWF) for the ERA-Interim data, and the Global Modeling and Assimilation Office (GMAO) at NASA Goddard Space Flight Center for MERRA data. The authors would like to thank Anne Walker for providing helpful comments regarding an early version of the manuscript. Helpful comments from three anonymous referees are gratefully acknowledged.
Edited by: C. Duguay
Reviewed by: three anonymous referees
References
Abdalati, W., Steffen, K., Otto, C., and Jezek, K. C.: Com-parison of brightness temperatures from SSM/I instruments on the DMSP F8 and F11 satellites for Antarctica and the Greenland ice sheet, Int. J. Remote Sens., 16, 1223–1229, doi:10.1080/01431169508954473, 1995.
AMAP: Snow, Water, Ice and Permafrost in the Arctic (SWIPA): Climate Change and the Cryosphere, Arctic Monitoring and As-sessment Programme (AMAP), Oslo, Norway, xii+ 538 pp., 2011.
Armstrong, R. L., Knowles, K. W., Brodzik, M. J., and Hardman, M. A.: DMSP SSM/I Pathfinder Daily EASE-Grid Brightness Temperatures, Version 2, (1988–2013), Boulder, Colorado, USA, National Snow and Ice Data Center, 10.5067/3EX2U1DV3434, 1994.
Bartsch, A.: Ten Years of SeaWinds on QuikSCAT for Snow Ap-plications, Remote Sens., 2, 1142–1156, doi:10.3390/rs2041142, 2010.
Bartsch, A., Kumpula, T., Forbes, B. C., and Stammler, F.: De-tection of snow surface thawing and refreezing in the Eurasian Arctic with QuikSCAT: implications for reindeer herding, Ecol. Appl., 20, 2346–2358, 2010.
Bokhorst, S. F., Bjerke, J. W., Tømmervik, H., Callaghan, T. V, and Phoenix, G. K.: Winter warming events damage sub-Arctic veg-etation: Consistent evidence from an experimental manipulation and a natural event, J. Ecol., 97, 1408–1415, 2009.
L. Wang et al.: Frequency and distribution of winter melt events 2601
Brown, R. D. and Robinson, D. A.: Northern Hemisphere spring snow cover variability and change over 1922–2010 including an assessment of uncertainty, The Cryosphere, 5, 219–229, doi:10.5194/tc-5-219-2011, 2011.
Brown, R. D. and Derksen, C.: Is Eurasian October snow cover extent increasing?, Environ. Res. Lett., 8, 024006, doi:10.1088/1748-9326/8/2/024006, 2013.
Bulygina, O. N., Groisman, P. Y., Razuvaev, V. N., and Radionov, V. F.: Snow cover basal ice layer changes over Northern Eurasia since 1966, Environ. Res. Lett., 5, 015004, doi:10.1088/1748-9326/5/1/015004, 2010.
Callaghan, T. V., Johansson, M., Brown, R. D., Groisman, P. Y., Labba, N., Radionov, V., Barry, R. G., Bulygina, O. N., Essery, R. L., Frolov, D. M., and Golubev, V. N.: The changing face of Arc-tic snow cover: A synthesis of observed and projected changes, Ambio, 40, 17–31, 2011.
Cavalieri, D. J., Parkinson, C., DiGirolamo, N., and Ivanoff, A.: Intersensor Calibration Between F13 SSMI and F17 SSMIS for Global Sea Ice Data Records, NASA technical report, 13 pp., 2012.
Chang, A., Foster, J., and Hall, D.: Nimbus-7 SMMR derived global snow cover parameters, Ann. Glaciol., 9, 39–44, 1987.
Chen, W., Russell, D. E., Gunn, A., Croft, B., Chen, W. R., Fernan-des, R., Zhao H., Li, J., Zhang, Y., Koehler, K., Olthof, I., Fraser, R. H., Leblanc, S. G., Henry, G. R., White, R. G., and Finstad, G. L.: Monitoring habitat condition changes during winter and pre-calving migration for Bathurst Caribou in northern Canada, Biodivers., 14, 36–44, 2013.
Cohen, J., Furtado, J., Barlow, M., Alexeev, V., and Cherry, J.: Asymmetric seasonal temperature trends, Geophys. Res. Lett., 39, L04705, doi:10.1029/2011GL050582, 2012.
Cohen, J., Ye, H., and Jones, J.: Trends and variability in rain-on-snow events, Geophys. Res. Lett., 42, 7115–7122, 2015. Dee, D. P., Uppala, S. M., Simmons, A. J., Berrisford, P., Poli, P.,
Kobayashi, S., and Vitart, F.: The ERA-Interim reanalysis: Con-figuration and performance of the data assimilation system, Q. J. Roy. Meteor. Soc., 137, 553–597, doi:10.1002/qj.828, 2011. Derksen, C. and Brown, R.: Spring snow cover extent reductions
in the 2008–2012 period exceeding climate model projections, Geophys. Res. Lett., 39, L19504, doi:10.1029/2012GL053387, 2012.
Derksen, C., Sturm, M., Liston, G., Holmgren, J., Huntington, H., Silis, A., and Solie, D.: Northwest Territories and Nunavut snow characteristics from a sub-Arctic traverse: Implications for pas-sive microwave remote sensing, J. Hydrometeorol., 10, 448–463, 2009.
Derksen, C., Toose, P., Lemmetyinen, J., Pulliainen, J., Langlois, A., Rutter, N., and Fuller, M. C.: Evaluation of passive mi-crowave brightness temperature simulations and snow water equivalent retrievals through a winter season, Remote Sens. En-viron., 117, 236–248, 2012.
Derksen, C., Lemmetyinen, J., Toose, P., Silis, A., Pulliainen, J., and Sturm, M.: Physical properties of Arctic versus subarctic snow: Implications for high latitude passive microwave snow water equivalent retrievals, J. Geophys. Res., 119, 7254–7270, doi:10.1002/2013JD021264, 2014.
Dolant, C., Langlois, A., Montpetit, B., Brucker, L., Roy, A., and Royer, A.: Development of a rain-on-snow detection algorithm
using passive microwave radiometry, Hydrol. Process., 30, 3184– 3196. doi:10.1002/hyp.10828, 2016.
Drobot, S. D. and Anderson, M. R.: An improved method for de-termining snowmelt onset dates over Arctic sea ice using scan-ning multichannel microwave radiometer and Special Sensor Microwave/Imager data, J. Geophys. Res., 106, 24033–24049, doi:10.1029/2000JD000171, 2001.
Grenfell, T. C. and Putkonen, J.: A method for the detection of the severe rain-on-snow event on Banks Island, October 2003, us-ing passive microwave remote sensus-ing, Water Resour. Res., 44, W03425, doi:10.1029/2007WR005929, 2008.
Groisman, P. Y., Sun, B., Vose, R. S., Lawrimore, J. H., Whitfield, P. H., Førland, E., Hanssen-Bauer, I., Serreze, M. C., Razuvaev, V. N., and Alekseev, G. V.: Contemporary climate changes in high latitudes of the Northern Hemisphere: daily time resolution, Proc. 14th AMS Symp. on Global Change and Climate, 1–10, Long Beach, CA, 2003.
Hansen, B. B., Aanes, R., Herfindal, I., Kohler, J., and Saether, B. E.: Climate, icing, and wild arctic reindeer: past relationships and future prospects, Ecology, 92, 1917–1923, 2011.
Hay, L. E. and McCabe, G. J.: Hydrologic effects of climate change in the Yukon River Basin, Clim. Chang., 100, 509–523, 2010. Johansson, C., Pohjola, V. A., Jonasson, C., and Callaghan, T.
V.: Multi-decadal changes in snow characteristics in sub-Arctic Sweden, Ambio, 40, 566–574, 2011.
Jones, P. D., Lister, D. H., Osborn, T. J., Harpham, C., Salmon, M., and Morice, C. P.: Hemispheric and large-scale land surface air temperature variations: an extensive revi-sion and an update to 2010, J. Geophys. Res., 117, D05127, doi:10.1029/2011JD017139, 2012.
Kim, Y., Kimball, J. S., McDonald, K. C., and Glassy, J.: Developing a global data record of daily landscape freeze/thaw status using satellite passive microwave remote sensing, IEEE Trans. Geosci. Remote Sens., 49, 949–960, doi:10.1109/TGRS.2010.2070515, 2011.
Langlois, A., Royer, A., Derksen, C., Montpetit, B., Dupont, F., and Goïta K.: Coupling the snow thermodynamic model SNOW-PACK with the microwave emission model of layered snowpacks for subarctic and arctic snow water equivalent retrievals, Water Resour. Res., 48, W12524, doi:10.1029/2012WR012133, 2012. Langlois, A., Johnson, C. A., Montpetit, B., Royer, A.,
Blukacz-Richards, E. A., Neave, E., Dolant, C., Roy, A., Arhonditsis, G., Kim, D.-K. F., Kaluskar, S., and Brucker, L.: Detection of rain-on-snow (ROS) events and ice layer formation using passive mi-crowave radiometry: A context for Peary caribou habitat in the Canadian Arctic, Remote Sens. Environ., in review, 2016. Liston, G. E. and Hiemstra, C. A.: The Changing Cryosphere:
Pan-Arctic Snow Trends (1979–2009), J. Climate, 24, 5691–5712, doi:10.1175/JCLI-D-11-00081.1, 2011.
Markus, T., Stroeve, J. C., and Miller, J.: Recent changes in Arctic sea ice melt onset, freeze-up, and melt season length, J. Geophys. Res., 114, C12024, doi:10.1029/2009JC005436, 2009.
McBean, G., Alexeev, G., Chen, D., Førland, E., Fyfe, J., Groisman, P. Y., King, R., Melling, H., Vose, R., and Whitfield, P. H.: Arc-tic climate: past and present, ArcArc-tic Climate Impact Assessment, Cambridge, Cambridge University Press, 2, 21–60, 2005. Nghiem, S. V., D. K. Hall, T. L. Mote, M. Tedesco, M. R. Albert, K.
Keegan, C. A. Shuman, N. E. DiGirolamo, and G. Neumann: The
M.: Observed and modeled effects of ice lens formation on pas-sive microwave brightness temperatures over snow covered tun-dra, Remote Sens. Environ., 114, 116–26, 2010.
Rennert, K. J., Roe, G., Putkonen, J., and Bitz, C. M.: Soil thermal and ecological impacts of rain on snow events in the circumpolar Arctic, J. Climate, 22, 2302–2315, 2009.
Rienecker, M. M., Suarez, M. J., Gelaro, R., Todling, R., Bacmeis-ter, J., Liu, E., Bosilovich, M. G., Schubert, S. G., Takacs, L., Kim, G.-K., Bloom, S., Chen, J., Collins, D., Conaty, A., Silva, A., Gu, W., Joiner, J., Koster, R. D., Lucchesi, R., Molod, A., Owens, T., Pawson, S., Pegion, P., Redder, C. R., Reichle, R., Robertson, F. R., Ruddick, A. G., Sienkiewicz, M., and Woollen, J.: MERRA: NASA’s Modern-Era Retrospective Anal-ysis for Research and Applications, J. Climate, 24, 3624–3648, doi:10.1175/JCLI-D-11-00015.1, 2011.
Semmens, K. A., Ramage, J., Bartsch, A., and Liston, G. E.: Early snowmelt events: detection, distribution, and significance in a major sub-arctic watershed, Environ. Res. Lett., 8, 1–11, doi:10.1088/1748-9326/8/1/014020, 2013.
Stroeve, J., Maslanik, J., and Li, X.: An intercomparison of DMSP F11- and F13-derived sea ice products, Remote Sens. Environ., 64, 132–152, doi:10.1016/S0034-4257(97)00174-0, 1998.
Brown, R., Markus, T., and Cole, J.: Integrated pan-Arctic melt onset detection from satellite active/passive microwave measurements, 2000–2009, J. Geophys. Res., 116, D22103, doi:10.1029/2011JD016256, 2011.
Wang, L., Derksen, C., and Brown, R., and Markus, T.: Re-cent changes in pan-Arctic melt onset from satellite passive microwave measurements, Geophys. Res. Lett., 40, 522–528, doi:10.1002/grl.50098, 2013.
Wilson, R. R., Bartsch, A., Joly, K., Reynolds, J. H., Orlando, A., and Loya, W. M.: Frequency, timing, extent, and size of winter thaw-refreeze events in Alaska 2001–2008 detected by remotely sensed microwave backscatter data, Polar Biol., 36, 419–426, doi:10.1007/s00300-012-1272-6, 2013.
Ulaby, F., Moore, R., and Fung, A.: Microwave Remote Sensing: Active and Passive, Vol. 2, Norwood, Massachusetts, Artech House, 816–920, 1986.