Human Brain from an Electrophysiological Perspective
Using Magnetoencephalography
Seung-Hyun Jin1,2,3, Woorim Jeong1, Jaeho Seol1, Jiyeon Kwon1,5, Chun Kee Chung1,2,3,4*
1MEG center, Department of Neurosurgery, Seoul National University Hospital, Seoul, Korea,2Department of Neurosurgery, Seoul National University Hospital, Seoul, Korea,3Neuroscience Research Institute, Seoul National University Medical Research Center, Seoul, Korea,4Department of Neurosurgery, Seoul National University College of Medicine, Seoul, Korea,5Seoul National University College of Medicine, Seoul, Korea
Abstract
It is not clear whether specific brain areas act as hubs in the eyes-closed (EC) resting state, which is an unconstrained state free from any passive or active tasks. Here, we used electrophysiological magnetoencephalography (MEG) signals to study functional cortical hubs in 88 participants. We identified several multispectral cortical hubs. Although cortical hubs vary slightly with different applied measures and frequency bands, the most consistent hubs were observed in the medial and posterior cingulate cortex, the left dorsolateral superior frontal cortex, and the left pole of the middle temporal cortex. Hubs were characterized as connector nodes integrating EC resting state functional networks. Hubs in the gamma band were more likely to include midline structures. Our results confirm the existence of multispectral cortical cores in EC resting state functional networks based on MEG and imply the existence of optimized functional networks in the resting brain.
Citation:Jin S-H, Jeong W, Seol J, Kwon J, Chung CK (2013) Functional Cortical Hubs in the Eyes-Closed Resting Human Brain from an Electrophysiological Perspective Using Magnetoencephalography. PLoS ONE 8(7): e68192. doi:10.1371/journal.pone.0068192
Editor:Yong He, Beijing Normal University, Beijing, China
ReceivedMarch 17, 2013;AcceptedMay 27, 2013;PublishedJuly 9, 2013
Copyright:ß2013 Jin et al. This is an open-access article distributed under the terms of the Creative Commons Attribution License, which permits unrestricted use, distribution, and reproduction in any medium, provided the original author and source are credited.
Funding:This study was supported by the Basic Science Research Program through the National Research Foundation of Korea (NRF) funded by the Ministry of Education, Science and Technology (MEST) (No. 2012R1A13007555). The funders had no role in study design, data collection and analysis, decision to publish or preparation of the manuscript.
Competing Interests:The authors have declared that no competing interests exist. * E-mail: [email protected]
Introduction
Recently, spontaneous brain activity in the resting state, defined as the absence of a task, has been investigated as a means to observe intrinsic brain activity. In functional magnetic resonance imaging (fMRI) studies, several resting state networks (RSNs) have been consistently observed across time and subjects [1–3], and the reliability of the intrinsic functional connectivity of the resting state has been confirmed [4]. Studies using electrophysiological modalities, including magnetoencephalography (MEG) [5–8] and electrocorticography [9,10], have permitted the study of the dynamic integration of functional networks in the resting human brain with high temporal resolution.
Whole-brain functional networks can be investigated with MEG because of the wide coverage associated with this technique. Many MEG-based studies have focused on sensory-level functional networks in the resting state or during a task [11–14]. Recently, functional connectivity studies using MEG at the source space have been reported [5–8,15]. Source-level connectivity analysis with MEG is recommended to reduce the well-known field spread effect [16], thus facilitating great advances in understanding RSNs from an electrophysiological perspective.
One of the advantages of investigating human brain networks is that it enables an examination of functional integration, one of the emergent properties of the brain. Human brain networks can be modeled as a number of nodes interconnected by a set of edges [17] and as a complex network of local and long-range connections [18], spurring efforts to identify ‘‘cortical core
regions’’ or hubs in functional brain networks. Hubs ensure information integration in system-wide communication and contribute to brain economy as specialized ‘‘integrators’’ [19]. Among nodes composing the well-known default-mode network (DMN), the posterior cingulate cortex (PCIN) has been identified as a functional hub [8], and several other candidates have been suggested, depending on the frequency bands observed [15]. However, the greatest drawback of these previous studies involving spontaneous MEG activity is that the MEG signals were recorded in the eyes-open (EO) resting state with fixation. The resting state can be considered a behavioral state characterized by quiet repose with the eyes closed (EC) or EO with or without visual fixation [2]. However, the EO resting state with fixation can also be regarded as a passive fixation task. In fact, significantly higher functional connectivity and regional amplitude of low frequency fluctuations have been reported in both the EO with or without fixation conditions compared to the EC condition [20]. Moreover, we previously demonstrated that the EO resting state was associated with greater reproducibility in functional networks at sensor level than the EC resting state [14] because the EO resting state is associated with nonspecific or non-goal-directed visual information gathering and evaluation [20].
EC resting state at different frequency bands using several known hub identification measures and to compare the results between subjects to determine whether there are cortical core regions across participants and frequency bands in a large population of 88 subjects.
To this end, we recorded MEG signals from 88 subjects in the EC resting state. We extracted the source activities at the 72 nodes (Table 1) covering the whole cortex on the basis of the automated anatomical labeling (AAL)-atlas [21]. Mutual information (MI), which quantifies the shared information between 2 time series based on information theory, was calculated to obtain the functional connectivity association matrix for each of 4 frequency bands corresponding to the classical EEG bands: theta (4–7 Hz), alpha (8–12 Hz), beta (13–30 Hz), and gamma (31–45 Hz). We
characterized the functional cortical hubs by estimating graph-theory-based network measures, such as nodal degree (Dnodal), nodal efficiency (Enodal), normalized betweenness centrality (normBC), and modularity analysis, followed by hub classification. For Dnodal, Enodal, and normBC measures, a node larger than 2 SD was chosen as a hub after z score transformation. For modularity analysis, a hub node was classified by partitioning the network into modules and calculating the contribution of each node to inter- and intramodule connections represented in a z-P parameter plot (denoted as z-P).
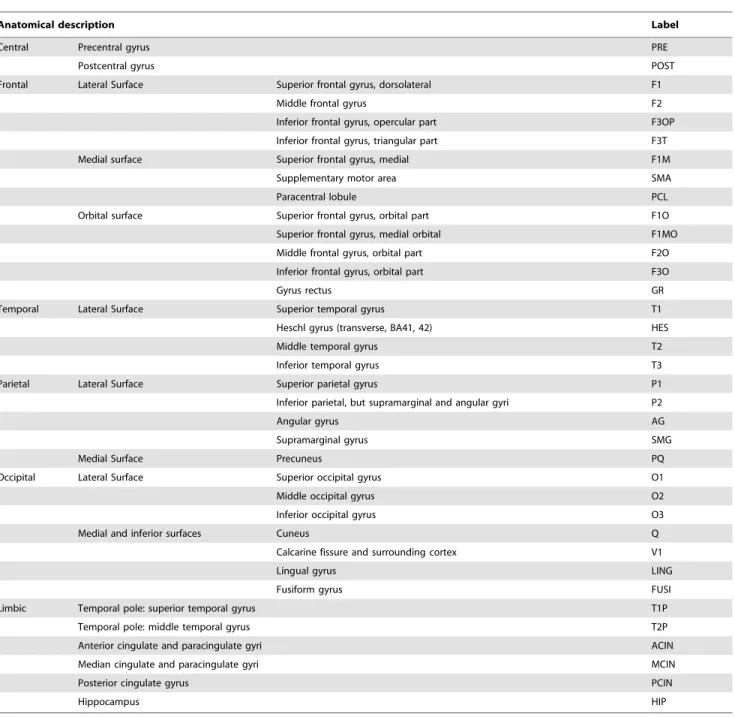
Table 1.List of the anatomical regions of interest.
Anatomical description Label
Central Precentral gyrus PRE
Postcentral gyrus POST
Frontal Lateral Surface Superior frontal gyrus, dorsolateral F1
Middle frontal gyrus F2
Inferior frontal gyrus, opercular part F3OP
Inferior frontal gyrus, triangular part F3T
Medial surface Superior frontal gyrus, medial F1M
Supplementary motor area SMA
Paracentral lobule PCL
Orbital surface Superior frontal gyrus, orbital part F1O
Superior frontal gyrus, medial orbital F1MO
Middle frontal gyrus, orbital part F2O
Inferior frontal gyrus, orbital part F3O
Gyrus rectus GR
Temporal Lateral Surface Superior temporal gyrus T1
Heschl gyrus (transverse, BA41, 42) HES
Middle temporal gyrus T2
Inferior temporal gyrus T3
Parietal Lateral Surface Superior parietal gyrus P1
Inferior parietal, but supramarginal and angular gyri P2
Angular gyrus AG
Supramarginal gyrus SMG
Medial Surface Precuneus PQ
Occipital Lateral Surface Superior occipital gyrus O1
Middle occipital gyrus O2
Inferior occipital gyrus O3
Medial and inferior surfaces Cuneus Q
Calcarine fissure and surrounding cortex V1
Lingual gyrus LING
Fusiform gyrus FUSI
Limbic Temporal pole: superior temporal gyrus T1P
Temporal pole: middle temporal gyrus T2P
Anterior cingulate and paracingulate gyri ACIN
Median cingulate and paracingulate gyri MCIN
Posterior cingulate gyrus PCIN
Hippocampus HIP
Materials and Methods
Ethics Statement
The study protocol was approved by the local Institutional Review Board at Seoul National University Hospital (IRB no. H-0607-029-178). Written informed consent was given by all participants.
Subjects
A total of 88 right-handed healthy subjects (mean 6 SD: 24.2864.03 years [range from 18 to 35], 54 males) voluntarily enrolled, and no participants had neurological problems. Hand-edness was tested using the Edinburgh HandHand-edness Inventory [22].
MEG Signal Acquisition and Preprocessing
We recorded MEG signals in the EC resting state (average duration, approximately 120 s). Magnetic fields (filter 0.1–200 Hz, 600 Hz sampling rate) were recorded inside a magnetically shielded room using a 306-channel whole-head MEG system (VectorView, Elekta Neuromag Oy, Finland). Head position relative to the sensor array was tracked with 4 additional head position indicator coils attached to the scalp. Signals were analog-filtered between 0.1 and 200 Hz and digitally sampled with a frequency of 600 Hz (when a different sampling frequency was used, a resampling process was applied to set the same frequency for all data). In addition to MEG, electrooculograms (EOG) and electrocardiograms (ECG) were simultaneously recorded. It should be noted that resting-state data were collected from participants who were engaged in several different studies; thus, the tasks that they participated in were different. However, the resting-state recordings in the eyes-closed state were conducted before the tasks. As a preprocessing step, environmental and movement noise were removed with the temporal signal space separation (tSSS) method [23], which is a required and effective artifact removal preprocessing step for data recorded with the Elekta-MEG system [24]. Besides tSSS, no additional computerized corrections for eye-blinking and muscle movement were applied. Instead, the MEG signals having no excessive eye-blinking or eye-movement to minimize the artifacts were visually inspected, especially with the EOG signals. Epoching was done with Graph software (Elekta Neuromag Oy, Helsinki, Finland) after applying the tSSS method. We manually selected five 10-sec epochs each out of the continuous signal.
Anatomical Segmentation and Extracting Source Waveforms from MEG Signals
The anatomical locations of 72 nodes (36 nodes in each hemisphere) are listed in Table 1, and corresponding MNI coordinates are shown in the Supplemental Information (Table S1). These 72 nodes were selected based on the AAL-atlas, which is used for anatomical parcellation of the brain [21]. We tried to include many nodes covered by the MEG recording among the AAL-atlas based nodes; thus, several sub cortical regions were excluded. The AAL-atlas has been used in studies that defined brain network nodes using fMRI [25–28].
Source waveforms were extracted from a set of 72 nodes covering the whole brain with BESAH2000 software (MEGIS Software GmbH, Germany). A template head implemented in BESA software was used when determining the source location instead of an individual MRI. MEG-MRI coregistration is possible using a template head under conditions that assure accurate digitization of individual head shape and with careful visual inspection [29]. We tried to follow this recommendation as much as possible. Note that it is not source imaging but reconstruction of source waveforms at 72 nodes in a simultaneous 72 dipole time-series extraction procedure.
Estimation of Functional Connectivity
Various types of measures can be used for functional connectivity estimation, which include linear measures such as correlation and coherence, and nonlinear measures such as phase leg index and nonlinear synchronization [30]. Here, we choose MI which quantifies the shared information between two time series based on information theory. The main advantage of MI is that it can capture both linear and nonlinear relationships between time series.
From the extracted source waveform, we estimated MI values of the bandpass filtered waveforms to create an association matrix between the 72 nodes for each of 4 frequency bands corresponding to the classical EEG bands: theta (4–7 Hz), alpha (8–12 Hz), beta (13–30 Hz), and gamma (31–45 Hz). MI was calculated using the following equation:
MI~MIXY~MIYX~MI(X(t),Y(t))
~ { X
X(t),Y(t)
p(X(t),Y(t) ) log p(X(t),Y(t))
p(X(t))p(Y(t))
wherep(X(t),Y(t))is the joint probability density function (PDF) between the 2 time seriesX(t)and Y(t). Thirty-two bins for the construction of the approximated PDF were adopted for 4096 samples like our previous study [31]. A corrective term was added Table 2.Summary of most dominant hubs and hub identification measures in each frequency band.
Dnodal Enodal normBC z-P
h a b c h a b c h a b c h a b c
F1_L ! ! ! ! ! ! ! ! ! ! ! ! ! ! ! !
T2P_L ! ! ! ! ! ! ! ! ! ! ! ! ! ! !
MCIN_L ! ! ! ! ! !
MCIN_R ! ! ! ! !
PCIN_L ! ! ! ! ! ! ! ! ! ! ! ! ! ! ! !
when calculating MI to compensate for the effect of finite data and quantization on the PDF as proposed by Roulston [32]. MI matrices of each epoch and frequency band were calculated, and 5 MI matrices were averaged for the subsequent estimation of graph-theoretic measures [33]. MI is a relatively sensitive way to identify frequency-specific functional connectivity compared to cross-correlation, generalized synchronization, and phase synchro-nization [34]. To construct more accurate models of the complex brain networks, weighted graphs (MI matrices) were used for further graph-theoretic analyses. Because spurious correlations between MEG signals could occur because of the low spatial resolution of source-space MEG [8,35] and the effect of spatial spread functions when multiple sources are estimated [36], pairs of nodes closer than 40 mm [37] were excluded in the present study. Grand averaged functional networks projected onto the cortex at each frequency are shown in Figure S1 (Supporting information).
Nodal Network Metrics to Assess Nodal Centrality
The centrality of a node expresses its functional importance. Highly central nodes may serve as centers of information integration [38].Nis the set of all nodes, andnis the number of nodes. The total number of nodes was 72, corresponding to the number of source locations. The links between 2 nodesiandjare associated with the connection weight wij. The weights were
normalized by the maximum value of the MI matrix so as to produce 0# wij #1 for all nodes. The shortest weighted path
length of the path from nodeito nodej, the so calleddi,j w, was calculated asP
wst[gw
i?jf(wst), wherefis the inverse of the weight to length andgi?jwis the shortest weighted path between the 2
nodes,iandj[39].
To identify cortical hubs from the functional network, 3 centrality measures were employed: Dnodal, Enodal, and normBC. Dnodal indicates the total weight connected to a node, which refers to how strong the connection represented at a node is. Dnodal was calculated at each node i as P
j[Nwij with the normalized connection weightwij.
Enodal is regarded as a measure of communication efficiency [40] and is derived from the following equation.
Enodal (i)~ 1
n{1 X
j[N,j=i
1
di,jw
Betweenness centrality (BC) measures how often nodes occur on the shortest paths between other nodes [41,42]. It is defined as the following equation:
BC~P h,j[N
h=j,h=i,j=i ghj(i)
ghj, where ghj is the number of
shortest paths between node h and j andghj(i)is the number of shortest paths between nodehand j passing throughi. BC was normalized by the mean value of BCs in a network [43,44], and thus, we denoted it as normBC.
These analyses were performed with the Brain Connectivity Toolbox (http://www.brain-connectivity-toolbox.net/). When necessary, the scripts were modified. Each nodal network metric was standardized by conversion tozscores as follows:
zi~
metric(i)-mean(metric)
SD(metric) ,
where ‘metric’ indicates each nodal network metric applied such as the Dnodal, Enodal, and normBC; metric (i) denotes the nodal
network metric at node i. Mean (metric) is the mean nodal network metric across all nodes in the network, and SD (metric) is the standard deviation of the network. The conversion tozscores does cause the values in each subject map to be comparably scaled [41]. The nodes withzscores larger than 2 SD were chosen as a hub for each nodal network metric.
The conversion tozscores does cause the values in each subject map to be comparably scaled [41]. The nodes with zscores of larger than 2 SD were chosen as a hub for each nodal network metric.
Community Detection with Modularity and Hub Classification
Modularity analysis was performed to identify hubs based on the network community structure. In accordance with previous studies [35,39], the modularity of brain networks suggests that the nodes in any module will be more densely connected to each other than to nodes in other modules, as defined by.
QW~lW1
P
i,j[N wij{kiWkjWlW
h i
dmi,mj, where
kiw~Pj[Nwij is a weighted degree of node i and l w~Pi,j[Nwijis a sum of all weights in the network.
Hub locations were classified from the modularity analysis. The within-module degreezscore, which indicates how well-connected the nodeiis to other nodes within module, and the participation coefficient PC, which assesses the diversity of intermodular interconnections of individual nodes [35,39], were used for hub classification as follows:
ziW~kiw(smikW){(mikwk)(mi),
wheremiis the module containing nodei,kiw(mi) is the
within-module degree ofi(the number of links betweeniand all other nodes inmi ), andkkw(mi)and skW(mi)are the respective mean
and standard deviation of the within-module mi degree
distribu-tion.
PCi~1{ X
m[M
kiw(m)
kiw
2,
whereMis the set of modules andkiw(mi)is the number of links betweeniand all nodes in modulem.
With those measures, we adopted a conservative hub classifi-cation method using the z-P parameter space proposed by Guimera and Amaral [45]. According to the within-module degree, we classified nodes withz$2.5 as module hubs and nodes withz ,2.5 as nonhubs. More specific roles of each node were characterized with the values of the participation coefficient [45]. Provincial (PC #0.30), connector (0.30,PC #0.75), and kinless (PC.0.75) hubs were classified at each condition and frequency band.
Results
Functional Cortical Hubs with High Degree
We first identified hubs by identifying nodes with a high degree of connectivity using Dnodal.
contrast, the gamma band hubs were somewhat different from the hub distributions in the other frequency bands.
Specifically, in the theta band, the left dorsolateral superior frontal gyrus (F1_L), the left pole of the middle temporal gyrus
(T2P_L), the left hippocampus (HIP_L), the left posterior cingulate gyrus (PCIN_L), and the left inferior frontal gyrus (F3OP_L) were identified as the top 5 hubs (Figure 1A and 1B). The most prominent hub was found at F1_L, where a hub was identified in
Figure 1. Hubs with high degree.Hubs based on the aggregated ranking percent of each node across 88 participants and their topological maps projected into a cortical surface at the theta (A and B), alpha (C and D), beta (E and F), and gamma (G and H) bands obtained from Dnodal estimation. The ranked distribution of aggregated ranking percent included only nonzero percent nodes, and the numbers in the topological maps denote the top 5 hub locations. Abbreviated notations for each node can be found in Table 1, and ‘_L’ and ‘_R’ denote the left and right hemisphere, respectively, at each node. The horizontal axes in A, C, E, and G indicate percentage (%).
93% of the 88 subjects. In the alpha band, the top 5 hubs were located at the same locations as the theta band: F1_L, HIP_L, T2P_L, PCIN_L,, and F3OP_L. However, the number of subjects was different; approximately 81% of all subjects peaked at F1_L (Figure 1C and 1D). In the beta band, nodes at F1_L, PCIN_L, T2P_L, and HIP_L were again observed, and the right posterior cingulate gyrus (PCIN_R) appeared as a hub (Figure 1E and 1F). The most prominent hub location was also the same as in the theta and alpha bands (F1_L), with 92% of all subjects peaking at this location. The dominant role of F1_L was supported by its appearance as the top hub over the entire theta to beta frequency range (4–30 Hz). The commonly found hubs, such as the PCIN_L, T2P_L, and HIP_L might be important hubs over the theta to beta bands as well. In the gamma band, the bilateral median cingulate gyri (MCIN_L & MCIN_R) were among the top 5 hubs. Notably, hub locations in the gamma band were different from previous bands, but F1_L, T2P_L, and PCIN_L still remained in the top 5 nodes (Figure 1G and 1H). PCIN_L was the most prominent hub node in 71% of subjects.
Functional Cortical Hubs with High Efficiency
Efficiency in brain networks, defined as the inverse of the harmonic mean of the shortest path length between one node and all other nodes, is regarded as a measure of the communication efficiency in the network [46]. Therefore, a hub with high efficiency can be regarded as the main location of information processing.
Ranked distributions of hubs based on the aggregate ranking percent across 88 subjects and their topological maps character-ized by Enodal are shown in Figure 2. As in the Dnodal analysis, the hubs from the theta to beta bands were similar. By contrast, hubs in the gamma band network were distributed mainly over midline structures.
In the theta (Figure 2A and 2B) and alpha (Figure 2C and 2D) bands, F1_L, T2P_L, PCIN_L, HIP_L, and T2P_L were the top 5 hubs. In the beta band, the top 5 hubs were located at F1_L, PCIN_L, T2P_L, HIP_L, and PCIN_R. F1_L was again the most prominent hub and was found in 91% of subjects (Figure 2E and 2F). In the gamma band, cortical midline structures appeared as hubs, including the cingulate cortex, PCIN_L, MCIN_L, and MCIN_R. T2P_L was the major hub (Figure 2G and 2H). PCIN_L was identified as a hub in 60 subjects.
Functional Cortical Hubs with High Centrality
Betweenness centrality is defined as the fraction of the shortest paths in the network that pass through a given node [39]. A region with high betweenness centrality represents a position that frequently becomes a shortcut between nodes within the network. Ranked distributions of hubs based on aggregated ranking percent across all subjects and their topological maps character-ized by normBC are shown in Figure 3.
In the theta band, F1_L, T2P_L, HIP_L, PCIN_L, and F3OP_L were the top 5 hubs in order, and F1_L was a hub in 80 of 88 subjects (91%), making it the most prominent hub (Figure 3A and 3B). In the alpha band, F1_L, HIP_L, PCIN_L, T2P_L, and F3OP_L were the top 5 hubs. The most prominent hub location was the same as in the theta band (F1_L) but occurred in a slightly low percentage of subjects, 81% (Figure 3C and 3D). In the beta band, F1_L, PCIN_L, T2P_L, HIP_L, and PCIN_R were the top 5 hubs (Figure 3E and 3F). In the gamma band, the top 5 hubs were PCIN_L, F1_L, MCIN_L, MCIN_R, and T2P_L (Figure 3G and 3H). The most prominent hub location was PCIN_L, which was identified in 71% of subjects.
Again, the main hubs in the gamma band appeared to be located in the vicinity of midline structures.
Functional Cortical Hubs with a High Degree and Centrality
Modularity analysis was also performed to identify hubs based on the network community structure. The modularity measure and the hub classification within a module [45] provide useful tools for understanding network structure [13,35,47]. We accepted a conservative hub classification criteria using the z-P with the within-module degreezscore and the participation coefficient (PC) determining the universal role of a node within a module based on the method introduced by Guimera and Amaral [45]. Using this method, it is possible to derive hubs with high degree and centrality.
Figure 4A displays the z-P of a subject, in which several hubs can be observed. Interestingly, all identified hubs across subjects were connector hubs that have high degree and centrality, but, by definition, their connections run between 2 or more modules. Overall, the number of subjects with identified hubs using the z-P method was less than previous hub identification measures, which may be due to the strict definition of a hub by azscore larger than 2.5 within a module. In fact, no hubs were identified in many subjects (Figure 4B).
In the theta band, the top 5 hubs were F1_L, PCIN_L, T2P_L, MCIN_R, and MCIN_L (Figure 4C and 4D). The most prominent hub was F1_L, identified in 45% of subjects. In the alpha band, the top 5 hubs were F1_L, the left superior temporal pole (T1P_L), MCIN_L, MCIN_R, and PCIN_L (Figure 4E and 4F). Even the most prominent hub (F1_L) was found in only 19 of 88 subjects (22%). In the beta band, F1_L, PCIN_L, MCIN_L, T1_R, and T2P_L appeared as hubs (Figure 4G and 4H). Again, the most prominent hub was F1_L, which was found in 36% of subjects. In the gamma band, PCIN_L, F1_L, MCIN_L, T2P_L, and MCIN_R were the top 5 hubs (Figure 4I and 4J). Among them, PCIN_L was found in the greatest number of subjects, approximately 47%. If we eliminated the subjects who had zero hubs, PICN_L was identified in all subjects (41/41).
Consistent Hubs across Hub Identification Measures
The above analyses focused on identifying functional hubs in different frequency bands using multiple hub identification methods. To identify dominant hubs based on the hub identifi-cation measurements, we investigated the ranked distribution of all nodes irrespective of frequency bands. F1_L in the theta (Dnodal, Enodal and normBC) band was the most prominent hub (Figure 5A, 5C, and 5E). PCIN_L in the gamma band was the top hub in z-P (Figure 5A). The most consistent hubs across hub identification methods were PCIN_L, F1_L, MCIN, and T2P_L (Figure 5B, 5D, 5F, and 5H). As seen above, hubs in the gamma band were more likely to include midline structures such as the median and posterior cingulate regions.
Discussion
Here, we demonstrated the existence of multispectral cortical hubs integrating the EC resting state functional networks by electrophysiological methods. Cortical hubs varied slightly with
different hub identification measures and frequency bands. The most consistent hubs across hub identification measures were observed in the medial and PCIN and the left dorsolateral superior frontal and middle temporal pole regions. They were character-ized as connector hubs that play an important role in promoting
Figure 2. Hubs with high efficiency.Hubs based on the aggregated ranking percent of each node across 88 participants and their topological maps projected into a cortical surface at the theta (A and B), alpha (C and D), beta (E and F), and gamma (G and H) bands obtained from Enodal estimation. The ranked distribution of aggregated ranking percent included only nonzero percent nodes, and the numbers in the topological maps denote the top 5 hub locations. Abbreviated notations for each node can be found in Table 1, and ‘_L’ and ‘_R’ denote the left and right hemispheres, respectively, at each node. The horizontal axes in A, C, E, and G indicate percentage (%).
information flow between otherwise segregated brain regions. In the gamma band, midline structures such as the median cingulate cortices were predominantly involved. The functional hubs that we identified could be the cores of the electrophysiological self, representing embedded self-referential or self-regulatory processes
and the manifestation of optimized multispectral functional networks ready to react to unexpected external stimuli. A system of brain oscillators allows brain operations to be performed simultaneously at multiple temporal and spatial scales [48,49]. Electrophysiological approaches such as those used in our study
Figure 3. Hubs with high centrality.Hubs based on the aggregated ranking percent of each node across 88 participants and their topological maps projected into a cortical surface at the theta (A and B), alpha (C and D), beta (E and F), and gamma (G and H) bands obtained from normBC estimation. The ranked distribution of aggregated ranking percent included only nonzero percent nodes, and the numbers in the topological maps denote the top 5 hub locations. Abbreviated notations of each node can be found in Table 1, and ‘_L’ and ‘_R’ denote the left and right hemispheres, respectively, at each node. The horizontal axes in A, C, E, and G indicate percentage (%).
have a distinct advantage over fMRI, which measures hemody-namic responses and may be insufficient to capture complex brain systems.
Functional Cortical Hubs in the EC Resting State
We identified several functional cortical hubs in the EC resting state, an unconstrained state free from any given passive task, based on MEG analysis of 88 participants. A close relationship between the RSNs identified by fMRI and the electrophysiological resting state obtained from MEG was confirmed previously [6–8], and frequency-specific hub candidates were suggested [15] in the EO resting state with fixation. However, the literature confirms that the network features in the EO condition are different from the EC condition, even though the physiological principles
underlying these differences have yet to be established. In fact, in the EO with or without fixation condition, significantly higher functional connectivity [50] and a robust estimation of functional connectivity compared with the EC condition were demonstrated [20]. The EO state also exhibits greater reproducibility compared to the EC state [14]. In the present study, to overcome the lack of robustness in the EC resting state, we analyzed MEG signals obtained from a large population of 88 participants. Our results provide several missing pieces of information about spontaneous brain activity by confirming the existence of dominant functional cortical hubs in the EC resting state by electrophysiological methods.
Although our results included similarities and dissimilarities with previously reported structural and functional hubs, we presume
Figure 4. Functional cartography of a subject using the within-modulezscore and participation coefficient (PC) of each node, and hubs with high degree and centrality derived from modular structure.Seven hubs were characterized as connector hubs (red box) in this subject. Nodes were classified as hubs according to z-P cartography for all subjects (A). Because all subjects presented hubs, Figure 4B displays the number of subjects who had hubs (first bar and figure) and the number of subjects who had each predominant hub depending on frequency bands (second bar and figure). Hubs were characterized in 71, 49, 78, and 80 of 88 subjects depending on frequency bands, and among them, 40, 19, 32, and 41 subjects demonstrated each predominant hub at each frequency band. Hubs based on the aggregated ranking percent of each node across 88 participants and their topological maps projected into a cortical surface at the theta (C and D), alpha (E and F), beta (G and H), and gamma (I and J) bands obtained from the modularity-based hub identification method are shown. The ranked distribution of the aggregated ranking percent included only nonzero percent nodes, and the numbers in the topological maps denote the top 5 hub locations. Abbreviated notations for each node can be found in Table 1, and ‘_L’ and ‘_R’ denote the left and right hemispheres, respectively, at each node. The horizontal axes in A, C, E, and G indicate percentage (%), not corrected by the number of subjects who had hubs in Figure 4B.
that the hubs we identified are the manifestation of characteristic features of the EC resting state that differ from those of the EO resting state. In a previous study, global hubs in the EO resting state were identified in the medial temporal lobe in the theta band, in lateral parietal areas in the alpha to beta bands and in sensorimotor areas for higher frequencies [15]. By contrast, the hubs identified in our study were located mainly in the cingulate cortex (PCIN, MCIN), the left dorsolateral superior frontal cortex (F1_L), and the left middle temporal pole (T2P_L). Hubs appeared over almost all frequency bands, with the exception of the preference of MCIN for the gamma band. PCIN and F1_L largely overlapped with core regions identified by structural connectivity [38,41,51,52], which implies a close relationship between func-tional hubs in the EC resting state and structural hub regions. In addition, PCIN was also identified as a hub in the EO resting state [8]. Even in the same EO resting state, the main hubs are not identical [8,15], possibly due to differences in node selection, i.e., seed-based [8] versus the whole brain [15]. In fact, the seed-ROIs used by de Pasquale and colleagues [8] were selected based on the RSN components identified using fMRI, while more dense nodes covering the entire cortex were used by Hipp and colleagues [15]. Since we do not know about the physiological principles underlying differences between the EC and EO resting states as of yet, the investigation of the physiological principles in the EC and EO resting states would be the next research topic.
Potential Functional Roles of Hubs and their Contribution to the Resting State Brain Network
Because spontaneous brain activity reflects endogenous network activity in the brain, which is metabolically costly [53], and cortical connectivity plays a crucial role in shaping resting state neural dynamics [19], cortical hubs in the resting state may have functional significance. One of the most important goals of this study was to identify hubs and their characteristics. Thus, it is interesting that the hubs we identified are connector hubs, which reflect the hub’s contribution to facilitating functional integration and their important role in system-wide information integration. According to the definition, hub nodes can be naturally categorized into 3 different roles: provincial, connector, and kinless hubs [45]. Connector hubs are hubs with many links to most of the other modules. Because hub nodes have high values of within-module connectivity by definition, a connector hub node is a well-connected node within a module and is simultaneously responsible for many between-module connections.
PCIN stands out as a hub over almost all frequency bands and hub identification measures, indicating its global influence in maintaining resting state functional networks regardless of spectral characterization with high degree, centrality and efficiency. There is a large body of work on PCIN in the resting state, which is characterized by high metabolic activity [54–57], structural connectivity [38,41,51,52], functional connectivity [8,41], and
Figure 5. Ranked distribution of Dnodal (A, B), Enodal (C, D), normBC (E, F), and z-P (G, H).Shown are the top 20 hubs based on the aggregated ranking percent of each node across 88 participants and their topological maps projected into a cortical surface derived from Dnodal (A and B), Enodal (C and D), normBC (E and F), and z-P (G and H) measures irrespective of frequency bands. The most consistent hubs, F1, T2P, MCIN, and PCIN, are marked in each topological map. Horizontal axes in A, C, E, and G indicate percentage (%). The size of the filled circles is proportional to the corresponding percent, and the color indicates each frequency band (Theta: red, alpha: green, beta: yellow, gamma: blue).
even a developmental role [58]. The presence of PCIN as a hub is agreement with previous findings on PCIN as a cortical site that allows communication between different cortical modules previ-ously described in a MEG study [8], and PCIN as extremely robust functional cores at rest that represent a convergence site for both intra- and inter-network interactions described in a recent fMRI study [59]. Of course, PCIN overlapped with the region constituting DMN [56,60], which might support the role of DMN allowing the off-line internally focused processes [59].
F1_L was another dominant functional hub. Again, the dorsolateral superior frontal cortex is one of the components of the DMN [1,59,61]. As mentioned above, PCIN and F1_L may be associated with structural connectivity. In addition, dense long-range connections between the superior frontal cortex and PCIN are more prevalent in adults compared to children [58], which emphasizes an important developmental role of long-range connections between the F1_L and the PCIN regions. Our results suggest that F1_L and PCIN contribute to information integration within the cerebral cortex.
The temporal pole (BA = 38) has been positively correlated with PCIN during rest [62]. The temporal pole is one of the components involved in ‘‘mentalizing’’, the ability to represent the mental state of both oneself and other people [63]. There is general agreement among many studies about the role of the temporal pole in the theory of mind [64], in line with the mentalizing concept. Thus, the appearance of T2P_L over almost all frequency bands reflects the manifestation of self during EC rest.
MCIN involvement (ventral anterior cingulate cortex, Table 1; BA = 24, Table 1S) in self-referential or self-awareness processing with PCIN has been reported [60,65–67], constituting the cortical midline structure, the potential core of the ‘‘self’’. Therefore, like T2P_L, MCIN seems to represent self-referential processing. Unlike other hubs, the MCIN hubs were only identified in the gamma band with high degree, and efficiency, which might indicate an association of the gamma frequency with self-referential mental processing mediated by the MCIN. Hubs in the gamma band are likely to reside in the vicinity of midline structures, which could be a manifestation of spectral character-izations in self-referential processes. Thus, the functional hubs we identified might be associated with the cores of the electrophys-iological self, representing embedded referential or self-regulatory processes. In addition, because midline structures are associated with the DMN [59], the presence of MCIN as a cortical hub can be regarded as another presentation of the default state of the brain at rest.
In addition to the self-related processes corresponding to the internal world, the brain must also be sensitive to the external world during rest. In contrast to a recent study [15], our study identified cortical hubs over all frequency bands rather than within specific frequency bands. We believe that this implies that the optimized functional networks are ready for unexpected external stimuli. Because our brain networks should be able to rapidly adapt and consequently reorganize in response to sensory input, each frequency band should be prepared to adapt the brain to external stimuli. Extensive nested frequencies, in which the phase of lower frequencies modulates the amplitude of higher frequen-cies, have been reported [68]. The feature of nested frequencies would be one of the manifestations of an optimized multispectral brain network that would facilitate brain function in various environments. Reorganization of brain functional networks has been reported in motor tasks [69,70], and abnormal reactivity to a task was reported with schizophrenia and focal hand dystonia, suggesting the lack of ability to adapt to the task [12,33,71]. Thus,
the strategy for optimizing brain networks to environmental changes employs multispectral functional networks and cortical connector hubs.
In our study, hubs were primarily identified in the left hemisphere in many cases, potentially due to the influence of the handedness of the participants; it was recently reported that hemispheric asymmetry of functional connectivity depends on handedness [72]. Further studies comparing hubs with different hand preference groups are warranted.
Methodological Considerations
The fundamental reason for the similarities or dissimilarities in the hub locations identified in our study and previous studies is a matter of debate. As we emphasized above, the first possible reason would be the difference between the EO with fixation and EC resting states. However, because even hubs in the same EO condition were not identical, other factors should be considered, such as the method of node selection (seed-based vs. whole brain segmentation) and functional connectivity estimation (power envelop correlation vs. MI). Because different methods yielded different results [5], the different methods likely represent different aspects of the brain network.
The second issue involves the absence of an individual anatomical MRI. However, MEG-MRI coregistration is possible using a template head under conditions that assure the accurate digitization of the individual head shape, with careful visual inspection [16]. We tried to follow this recommendation as much as possible. Moreover, because the nodes were based on the AAL-atlas, we minimized the possibility of placing nodes on the wrong representative brain regions.
The third issue is related to node selection. The number of source nodes used in the present study was 72, 36 for each hemisphere. There is no clear answer to the question of how many nodes would most accurately represent the brain functional network. Finer segmentation may be beneficial to obtain a more localized focus; however, the well-known field spread effect of MEG increases with increasing node number. Thus, the trade-off between finer segmentation and the field-spread effect should be considered. We supposed that our nodes were numerous enough to represent each brain region while avoiding the field spread effect. Because there is no guarantee that source-level connectivity is free from field spread effects, MI connectivity between nodes located less than 40 mm apart was discarded as a second means of ensuring minimal field spread effects [8,35].
A final issue is the limited ability to cover the deep structures of the brain with MEG. Deep structures such as the brainstem may be key to understanding the human conscious state. Impaired neural synchronization between the brainstem and the cerebral cortex was observed in patients with lock-in-syndrome, a typical conscious state with brainstem damage [73]. Thus, despite its importance, the contribution of the brainstem to resting state functional networks is impossible to examine with MEG, as is also the case for fMRI. PET can capture brainstem activity, but it measures metabolic changes rather than direct electrical activity and consequently has a limited temporal scope. Therefore, despite a lack of coverage of deep structures, MEG is a good method to investigate the spectral characteristics of functional networks.
Implications for Future Study and Conclusions
background of functional cortical hubs, the substrate of the EC resting state, diverse applications can be envisioned. Identification of the causal relationships among cortical hubs during specific tasks or brain diseases could provide new insights into brain function. Because of the dependency of cortical networks on specific tasks given to the brain, attacks to break the networks, or pathological states, examining the brain during a given task or comparing healthy and diseased brains would be useful to understand what happens in the brain. Moreover, it is even possible to examine a patient who has difficulty maintaining the EO fixation state. It would be interesting to determine which spectral responses emerge from the multispectral functional networks to adopt them to a given situation.
In conclusion, the investigation of functional networks has an impact on understanding how cortical areas form a configured structure and cooperatively interact each other. Examination of hubs in functional brain networks in multispectral ranges is possible with MEG by virtue of its high temporal resolution. We emphasized the existence of functional cortical hubs and their
spatial and spectral characteristics in the EC state. Moreover, we showed their features as connector hubs that play an important role integrating functional networks across frequency bands with high degree, efficiency, and centrality.
Supporting Information
Figure S1 Grand averaged functional networks project-ed onto the cortex at each frequency band.
(DOCX)
Table S1 MNI coordinates and BA of each region.
(DOCX)
Author Contributions
Conceived and designed the experiments: SHJ CKC. Performed the experiments: SHJ. Analyzed the data: SHJ WJ JS JK. Contributed reagents/materials/analysis tools: SHJ JS. Wrote the paper: SHJ CKC.
References
1. Ding JR, Liao W, Zhang Z, Mantini D, Xu Q, et al. (2011) Topological fractionation of resting-state networks. PLoS One 6: e26596.
2. Raichle ME (2010) Two views of brain function. Trends Cogn Sci 14: 180–190. 3. Biswal BB, Van Kylen J, Hyde JS (1997) Simultaneous assessment of flow and BOLD signals in resting-state functional connectivity maps. NMR in Biomedicine 10: 165–170.
4. Shehzad Z, Kelly AM, Reiss PT, Gee DG, Gotimer K, et al. (2009) The resting brain: unconstrained yet reliable. Cerebral Cortex 19: 2209–2229.
5. Brookes MJ, Hale JR, Zumer JM, Stevenson CM, Francis ST, et al. (2011) Measuring functional connectivity using MEG: methodology and comparison with fcMRI. Neuroimage 56: 1082–1104.
6. Brookes MJ, Woolrich M, Luckhoo H, Price D, Hale JR, et al. (2011) Investigating the electrophysiological basis of resting state networks using magnetoencephalography. Proceedings of the National Academy of Sciences of the United States of America 108: 16783–16788.
7. de Pasquale F, Della Penna S, Snyder AZ, Lewis C, Mantini D, et al. (2010) Temporal dynamics of spontaneous MEG activity in brain networks. Proceedings of the National Academy of Sciences of the United States of America 107: 6040–6045.
8. de Pasquale F, Della Penna S, Snyder AZ, Marzetti L, Pizzella V, et al. (2012) A cortical core for dynamic integration of functional networks in the resting human brain. Neuron 74: 753–764.
9. He BJ, Snyder AZ, Zempel JM, Smyth MD, Raichle ME (2008) Electrophys-iological correlates of the brain’s intrinsic large-scale functional architecture. Proceedings of the National Academy of Sciences of the United States of America 105: 16039–16044.
10. Nir Y, Mukamel R, Dinstein I, Privman E, Harel M, et al. (2008) Interhemispheric correlations of slow spontaneous neuronal fluctuations revealed in human sensory cortex. Nature Neuroscience 11: 1100–1108. 11. Stam CJ, de Haan W, Daffertshofer A, Jones BF, Manshanden I, et al. (2009)
Graph theoretical analysis of magnetoencephalographic functional connectivity in Alzheimer’s disease. Brain 132: 213–224.
12. Bassett DS, Bullmore ET, Meyer-Lindenberg A, Apud JA, Weinberger DR, et al. (2009) Cognitive fitness of cost-efficient brain functional networks. Proceedings of the National Academy of Sciences of the United States of America 106: 11747–11752.
13. Kitzbichler MG, Henson RN, Smith ML, Nathan PJ, Bullmore ET (2011) Cognitive effort drives workspace configuration of human brain functional networks. Journal of Neuroscience 31: 8259–8270.
14. Jin SH, Seol J, Kim JS, Chung CK (2011) How reliable are the functional connectivity networks of MEG in resting states? Journal of Neurophysiology 106: 2888–2895.
15. Hipp JF, Hawellek DJ, Corbetta M, Siegel M, Engel AK (2012) Large-scale cortical correlation structure of spontaneous oscillatory activity. Nature Neuroscience 15: 884–890.
16. Gross J, Baillet S, Barnes GR, Henson RN, Hillebrand A, et al. (2012) Good practice for conducting and reporting MEG research. NeuroImage 65C: 349– 363.
17. Bullmore ET, Bassett DS (2011) Brain graphs: graphical models of the human brain connectome. Annu Rev Clin Psychol 7: 113–140.
18. Bassett DS, Gazzaniga MS (2011) Understanding complexity in the human brain. Trends Cogn Sci 15: 200–209.
19. Sporns O (2011) The Brain’s Small World: Motifs, Modules, and Hubs. Networks of the Brain. Cambridge, Massachusetts; London, England: The MIT Press. 101–126.
20. Yan C, Liu D, He Y, Zou Q, Zhu C, et al. (2009) Spontaneous brain activity in the default mode network is sensitive to different resting-state conditions with limited cognitive load. PLoS One 4: e5743.
21. Tzourio-Mazoyer N, Landeau B, Papathanassiou D, Crivello F, Etard O, et al. (2002) Automated anatomical labeling of activations in SPM using a macroscopic anatomical parcellation of the MNI MRI single-subject brain. Neuroimage 15: 273–289.
22. Oldfield RC (1971) The assessment and analysis of handedness: the Edinburgh inventory. Neuropsychologia 9: 97–113.
23. Taulu S, Hari R (2009) Removal of magnetoencephalographic artifacts with temporal signal-space separation: demonstration with single-trial auditory-evoked responses. Human Brain Mapping 30: 1524–1534.
24. Hillebrand A, Fazio P, de Munck JC, van Dijk BW (2012) Feasibility of clinical Magnetoencephalography (MEG) functional mapping in the presence of dental artefacts. Clinical Neurophysiology.
25. He Y, Wang J, Wang L, Chen ZJ, Yan C, et al. (2009) Uncovering intrinsic modular organization of spontaneous brain activity in humans. PLoS One 4: e5226.
26. Wang L, Zhu C, He Y, Zang Y, Cao Q, et al. (2009) Altered small-world brain functional networks in children with attention-deficit/hyperactivity disorder. Hum Brain Mapp 30: 638–649.
27. Supekar K, Menon V, Rubin D, Musen M, Greicius MD (2008) Network analysis of intrinsic functional brain connectivity in Alzheimer’s disease. PLoS Comput Biol 4: e1000100.
28. Liao W, Zhang Z, Pan Z, Mantini D, Ding J, et al. (2010) Altered functional connectivity and small-world in mesial temporal lobe epilepsy. PLoS One 5: e8525.
29. Gross J, Baillet S, Barnes GR, Henson RN, Hillebrand A, et al. (2012) Good practice for conducting and reporting MEG research. Neuroimage. 30. Pereda E, Quiroga RQ, Bhattacharya J (2005) Nonlinear multivariate analysis of
neurophysiological signals. Prog Neurobiol 77: 1–37.
31. Jin SH, Seol J, Kim JS, Chung CK (2011) How reliable are the functional connectivity networks of MEG in resting states? J Neurophysiol 106: 2888–2895. 32. Roulston MS (1999) Estimating the errors on measured entropy and mutual
information. Physica D 125: 285–294.
33. Jin SH, Lin P, Hallett M (2011) Abnormal reorganization of functional cortical small-world networks in focal hand dystonia. PLoS One 6: e28682. 34. David O, Cosmelli D, Friston KJ (2004) Evaluation of different measures of
functional connectivity using a neural mass model. Neuroimage 21: 659–673. 35. Chavez M, Valencia M, Navarro V, Latora V, Martinerie J (2010) Functional
modularity of background activities in normal and epileptic brain networks. Phys Rev Lett 104: 118701.
36. Hauk O, Wakeman DG, Henson R (2011) Comparison of noise-normalized minimum norm estimates for MEG analysis using multiple resolution metrics. Neuroimage 54: 1966–1974.
37. Garcia Dominguez L, Wennberg RA, Gaetz W, Cheyne D, Snead OC, 3rd, et al. (2005) Enhanced synchrony in epileptiform activity? Local versus distant phase synchronization in generalized seizures. J Neurosci 25: 8077–8084. 38. Hagmann P, Cammoun L, Gigandet X, Meuli R, Honey CJ, et al. (2008)
Mapping the structural core of human cerebral cortex. PLoS Biology 6: e159. 39. Rubinov M, Sporns O (2010) Complex network measures of brain connectivity:
uses and interpretations. Neuroimage 52: 1059–1069.
40. Latora V, Marchiori M (2001) Efficient behavior of small-world networks. Phys Rev Lett 87: 198701.
stability, and relation to Alzheimer’s disease. Journal of Neuroscience 29: 1860– 1873.
42. Freeman LC (1978) Centrality in social networks: conceptual clarification. Social Networks 1: 215–239.
43. He Y, Chen Z, Evans A (2008) Structural insights into aberrant topological patterns of large-scale cortical networks in Alzheimer’s disease. Journal of Neuroscience 28: 4756–4766.
44. Wang L, Yu C, Chen H, Qin W, He Y, et al. (2010) Dynamic functional reorganization of the motor execution network after stroke. Brain 133: 1224– 1238.
45. Guimera R, Nunes Amaral LA (2005) Functional cartography of complex metabolic networks. Nature 433: 895–900.
46. Wang L, Zhu C, He Y, Zang Y, Cao Q, et al. (2009) Altered small-world brain functional networks in children with attention-deficit/hyperactivity disorder. Human Brain Mapping 30: 638–649.
47. Sohn Y, Choi MK, Ahn YY, Lee J, Jeong J (2011) Topological cluster analysis reveals the systemic organization of the Caenorhabditis elegans connectome. PLoS Comput Biol 7: e1001139.
48. Buzsaki G, Draguhn A (2004) Neuronal oscillations in cortical networks. Science 304: 1926–1929.
49. Buzsaki G, Geisler C, Henze DA, Wang XJ (2004) Interneuron Diversity series: Circuit complexity and axon wiring economy of cortical interneurons. Trends in Neurosciences 27: 186–193.
50. Van Dijk KR, Hedden T, Venkataraman A, Evans KC, Lazar SW, et al. (2010) Intrinsic functional connectivity as a tool for human connectomics: theory, properties, and optimization. Journal of Neurophysiology 103: 297–321. 51. Honey CJ, Sporns O, Cammoun L, Gigandet X, Thiran JP, et al. (2009)
Predicting human resting-state functional connectivity from structural connec-tivity. Proceedings of the National Academy of Sciences of the United States of America 106: 2035–2040.
52. van den Heuvel MP, Mandl RC, Kahn RS, Hulshoff Pol HE (2009) Functionally linked resting-state networks reflect the underlying structural connectivity architecture of the human brain. Human Brain Mapping 30: 3127– 3141.
53. Raichle ME, Mintun MA (2006) Brain work and brain imaging. Annual Review of Neuroscience 29: 449–476.
54. Gusnard DA, Raichle ME, Raichle ME (2001) Searching for a baseline: functional imaging and the resting human brain. Nature Reviews: Neuroscience 2: 685–694.
55. Pfefferbaum A, Chanraud S, Pitel AL, Muller-Oehring E, Shankaranarayanan A, et al. (2011) Cerebral blood flow in posterior cortical nodes of the default mode network decreases with task engagement but remains higher than in most brain regions. Cerebral Cortex 21: 233–244.
56. Greicius MD, Krasnow B, Reiss AL, Menon V (2003) Functional connectivity in the resting brain: a network analysis of the default mode hypothesis. Proceedings of the National Academy of Sciences of the United States of America 100: 253– 258.
57. Raichle ME, MacLeod AM, Snyder AZ, Powers WJ, Gusnard DA, et al. (2001) A default mode of brain function. Proceedings of the National Academy of Sciences of the United States of America 98: 676–682.
58. Fair DA, Cohen AL, Dosenbach NU, Church JA, Miezin FM, et al. (2008) The maturing architecture of the brain’s default network. Proceedings of the National Academy of Sciences of the United States of America 105: 4028–4032. 59. de Pasquale F, Sabatini U, Della Penna S, Sestieri C, Caravasso CF, et al. (2013)
The connectivity of functional cores reveals different degrees of segregation and integration in the brain at rest. Neuroimage 69: 51–61.
60. Fransson P, Marrelec G (2008) The precuneus/posterior cingulate cortex plays a pivotal role in the default mode network: Evidence from a partial correlation network analysis. Neuroimage 42: 1178–1184.
61. Li W, Qin W, Liu H, Fan L, Wang J, et al. (2013) Subregions of the human superior frontal gyrus and their connections. Neuroimage 78C: 46–58. 62. Fransson P (2005) Spontaneous low-frequency BOLD signal fluctuations: an
fMRI investigation of the resting-state default mode of brain function hypothesis. Human Brain Mapping 26: 15–29.
63. Frith U, Frith CD (2003) Development and neurophysiology of mentalizing. Philosophical Transactions of the Royal Society of London Series B: Biological Sciences 358: 459–473.
64. Olson IR, Plotzker A, Ezzyat Y (2007) The Enigmatic temporal pole: a review of findings on social and emotional processing. Brain 130: 1718–1731. 65. Northoff G, Heinzel A, de Greck M, Bermpohl F, Dobrowolny H, et al. (2006)
Self-referential processing in our brain–a meta-analysis of imaging studies on the self. Neuroimage 31: 440–457.
66. Northoff G, Bermpohl F (2004) Cortical midline structures and the self. Trends Cogn Sci 8: 102–107.
67. Kim H (2012) A dual-subsystem model of the brain’s default network: self-referential processing, memory retrieval processes, and autobiographical memory retrieval. Neuroimage 61: 966–977.
68. He BJ, Zempel JM, Snyder AZ, Raichle ME (2010) The temporal structures and functional significance of scale-free brain activity. Neuron 66: 353–369. 69. Bassett DS, Meyer-Lindenberg A, Achard S, Duke T, Bullmore E (2006)
Adaptive reconfiguration of fractal small-world human brain functional networks. Proceedings of the National Academy of Sciences of the United States of America 103: 19518–19523.
70. Jin SH, Lin P, Hallett M (2012) Reorganization of brain functional small-world networks during finger movements. Human Brain Mapping 33: 861–872. 71. Jin SH, Lin P, Auh S, Hallett M (2011) Abnormal functional connectivity in
focal hand dystonia: mutual information analysis in EEG. Movement Disorders 26: 1274–1281.
72. Saenger VM, Barrios FA, Martinez-Gudino ML, Alcauter S (2012) Hemispheric asymmetries of functional connectivity and grey matter volume in the default mode network. Neuropsychologia 50: 1308–1315.