JOÃO GUSTAVO DE OLIVEIRA CLAUDINO
UTILIZAÇÃO DO DESEMPENHO EM SALTOS VERTICAIS NA
REGULAÇÃO DA CARGA DE TREINAMENTO
Belo Horizonte - MG
JOÃO GUSTAVO DE OLIVEIRA CLAUDINO
UTILIZAÇÃO DO DESEMPENHO EM SALTOS VERTICAIS NA
REGULAÇÃO DA CARGA DE TREINAMENTO
Dissertação apresentada ao Programa de Pós-Graduação em Ciências do Esporte da Escola de Educação Física, Fisioterapia e Terapia Ocupacional da Universidade Federal de Minas Gerais, como requisito parcial à obtenção do título de Mestre em Ciências do Esporte.
Área de Concentração: Treinamento
Esportivo
Orientador: Prof. Dr. Leszek Antoni Szmuchrowski
Belo Horizonte - MG
Universidade Federal de Minas Gerais
Escola de Educação Física, Fisioterapia e Terapia Ocupacional Programa de Pós-Graduação em Ciências do Esporte
Dissertação intitulada “Utilização do desempenho em saltos verticais na regulação da
carga de treinamento”, de autoria do mestrando João Gustavo de Oliveira Claudino,
aprovada pela banca examinadora constituída pelos seguintes professores:
_______________________________________________________ Prof. Dr. Leszek Antoni Szmuchrowski – Orientador
Depto de Esportes/Escola de Educação Física, Fisioterapia e Terapia Ocupacional/UFMG
_______________________________________________________ Prof. Dr. Pablo Juan Greco
Depto de Esportes/Escola de Educação Física, Fisioterapia e Terapia Ocupacional/UFMG
_______________________________________________________ Prof. Dr. Ary Gomes Filho
Universidade Federal de Pernambuco/ UFPE
_______________________________________________________ Prof. Dr. Herbert Ugrinowitsch
Coordenador do Programa de Pós-Graduação em Ciências do Esporte Escola de Educação Física, Fisioterapia e Terapia Ocupacional/UFMG
AGRADECIMENTOS
A Deus por alimentar-me sempre nesta luta.
A Dª Piedade, a Dª Celeste, a Joyce e a Luana, que são os alicerces maiores da minha vida.
Aos parceiros Adriano Lima e Rafael Soncin por fortalecermos uns aos outros em busca do nosso sonho.
A todos os Professores que tive ao longo da minha vida.
A Profª. Ms. Silvia por abrir, com aquele sorriso, as portas da UFMG quando chegamos (Eu e o Rafael Soncin).
Ao Prof. Dr. Leszek Antoni Szmuchrowski pela oportunidade.
A Moçada do LAC pelos ensinamentos e convivência.
Aos voluntários do estudo pelo empenho, envolvimento e compreensão.
Aos funcionários (Colegiado, Portaria, Vigilância, Limpeza, Almoxarifados) e aos companheiros de marmita pelo carinho e apoio durante a caminhada.
E por fim, a todos aqueles que de alguma maneira contribuíram para a realização deste sonho.
EPÍGRAFE
“...eu sou guerreiro, sou trabalhador e todo dia vou encarar com fé em Deus e na minha batalha...”
RESUMO
O propósito do estudo foi verificar o efeito da regulação da carga de treinamento, a partir da realização de salto com contramovimento (SCM) no início da sessão, sobre a carga total de treinamento pliométrico e o desempenho em saltos verticais. Neste estudo 44 homens estudantes de Educação Física tiveram o desempenho em SCM e salto agachado (SA) avaliados e foram distribuídos aleatoriamente em 4 grupos: Grupo sem Regulação (GSR), Grupo com Regulação (GCR), Grupo Espelho (GE) e Grupo Controle (GC). O GSR realizou 6 semanas de treinamento pliométrico sem ajustes das cargas de treinamento. O GCR realizou o mesmo treinamento, entretanto, as cargas poderiam sofrer ajustes em função do desempenho em SCM realizados no início da sessão. O GE executou o planejamento com os mesmos ajustes realizados no GCR. Ao final do treinamento todos os participantes foram reavaliados em testes de saltos verticais. A carga total de treinamento foi significativamente inferior (p < 0.05; Tamanho de Efeito = 0.82) nos grupos GCR e GE (1905 ± 37 saltos) quando comparados ao GSR (1926 ± 0 saltos). A alteração de desempenho dos saltos verticais foi significativa para os grupos que realizaram o treinamento (p < 0.05). O GSR e o GCR obtiveram um tamanho de efeito (TE) grande no desempenho em saltos verticais, entretanto, o GE apresentou um TE moderado. A utilização do desempenho no SCM, realizado no início da sessão de treinamento como ferramenta de regulação das cargas, permitiu uma diminuição significativa na carga total de treinamento, sem reduzir os efeitos crônicos sobre o desempenho nos saltos verticais.
ABSTRACT
The purpose of this study was to verify the regulating effect of the training load, using the countermovement jump (CMJ) at the beginning of the session, on the total plyometric training load and the vertical jumps performance. Forty-four males were divided in four groups: No Regulation Group (nRG), Regulation Group (RG), Yoked Group (YG) and Control Group (CG). The nRG received 6 weeks of plyometric training, with no adjustment in training load. The RG underwent the same training; however, the training load was adjusted according to the CMJ performance at the beginning of each session. The YG received the same load adjustments made for the RG. At the end of the training, the CMJ and squat jump performance of all of the participants was reassessed. The total training load was significantly lower (p = 0.036; effect size = 0.82) in the RG and the YG (1905 ± 37 jumps) compared to the nRG (1926 ± 0 jumps). The enhancement in vertical jump performance was significant for the groups that underwent the training. The nRG and the RG exhibited a large effect size (ES) in vertical jump performance; however, the YG had a moderate ES. Using vertical jump performance, performed at the beginning of the session, as a tool to regulate the training load resulted in a decrease of the total training load, without decreasing the long-term effects on vertical jump performance.
LISTA DE ILUSTRAÇÕES
FIGURA 1. Delineamento Experimental...17
FIGURA 2. Exemplo de análises das variações de desempenho no SCM a partir a DMI...20
FIGURA 3. Número de saltos realizados por cada grupo durante o treinamento...24
FIGURA 4. Altura do salto com contramovimento (SCM) em cada grupo antes e depois do treinamento...25
LISTA DE TABELAS
TABELA 1. Planejamento das 6 semanas de treinamento pliométrico... 21
LISTA DE ABREVIATURAS E SIGLAS
cm - centímetros
DMI - Diferença mínima individual DP - Desvio padrão
EPM - Erro padrão de medida FC - Frequência cardíaca GC - Grupo Controle GE - Grupo Espelho
GCR - Grupo com Regulação GSR - Grupo sem Regulação h - hora
Hz - Hertz
ICC - Índice de correlação intraclasse
IJSM - International Journal of Sports Medicine kg - Quilogramas
m - metros
n - número de voluntários N - newton
PSE - Percepção subjetiva do esforço QMerro - Quadrado médio do erro rpm - rotações por minuto
SA - Salto Agachado
SCM - Salto com Contramovimento SP - Saltos em Profundidade
SVM - Saltos Verticais Múltiplos TE - Tamanho do efeito
SUMÁRIO
1 INTRODUÇÃO ...14
2 MÉTODOS ...16
2.1 Participantes...16
2.2 Delineamento Experimental...16
2.3 Protocolos de Testes ...17
2.3.1 Familiarização...17
2.3.2 Confiabilidade...17
2.3.3 Testes de Saltos Verticais ...18
2.3.4 Antropometria...18
2.4 Monitoramento e Regulação...19
2.5 Protocolos de Treinamento ...21
2.5.1 Grupo sem Regulação (GSR) ...21
2.5.2 Grupo com Regulação (GCR) ...22
2.5.3 Grupo Espelho (GE) ...22
2.5.4 Grupo Controle (GC) ...22
2.6 Análise Estatística...22
3 RESULTADOS...24
4 DISCUSSÃO ...27
REFERÊNCIAS...32
14
1 INTRODUÇÃO
Segundo Gabbett [13], o monitoramento e a regulação das cargas de treinamento são determinantes para assegurar que os atletas recebam a devida progressão de sobrecarga e garantir uma adequada recuperação entre sessões de treinamento. Para que um indivíduo alcance um elevado nível de desempenho esportivo é necessário submetê-lo a situações rigorosas de treino, através de um processo cíclico de treinamento-fadiga-adaptação. No entanto esta adequada recuperação entre as sessões deve ser respeitada, pois caso isso não ocorra, o processo pode tornar-se imperfeito, com atletas treinando fadigados [12].
A regulação implica no monitoramento das respostas ao treinamento e no ajuste das cargas planejadas em função destas respostas. Uma aplicação inadequada das cargas de treinamento pode trazer prejuízos como o aumento da probabilidade de lesão [14, 15]. Estas consequências negativas podem ser minimizadas a partir da identificação do estado do indivíduo e consequente diminuição da sobrecarga. Por outro lado, o aumento da sobrecarga se faz necessário quando ocorrem respostas positivas ao treinamento [22, 25]. Um desafio para os treinadores é determinar o momento em que o treino pode tornar-se inadequado e realizar os devidos ajustes, sendo estes os respectivos objetivos do monitoramento [9,10] e da regulação [5, 13].
15
mulheres. Quando, ao final do treino, a PSE ou FC indicavam uma exigência menor que na sessão anterior eram realizados incrementos na carga para a próxima sessão. A PSE também foi utilizada na regulação das cargas aplicadas em atletas de rúgbi. Neste caso, a carga de treinamento era quantificada através da PSE e do tempo de treino. Estas informações eram utilizadas para determinação de um limiar de carga de treinamento e a regulação acontecia na próxima sessão, quando este limiar era ultrapassado [13].
16
2 MÉTODOS 2.1 Participantes
Participaram do estudo 44 homens estudantes de Educação Física e sem histórico de lesão em membros inferiores. Este estudo foi executado em acordo com os padrões éticos do IJSM [16] e aprovado pelo Comitê de Ética de Pesquisa em Humanos da Universidade FUMEC com protocolo 523/2010. Os voluntários não realizaram nenhum outro tipo de treinamento de força para os membros inferiores durante a realização do estudo.
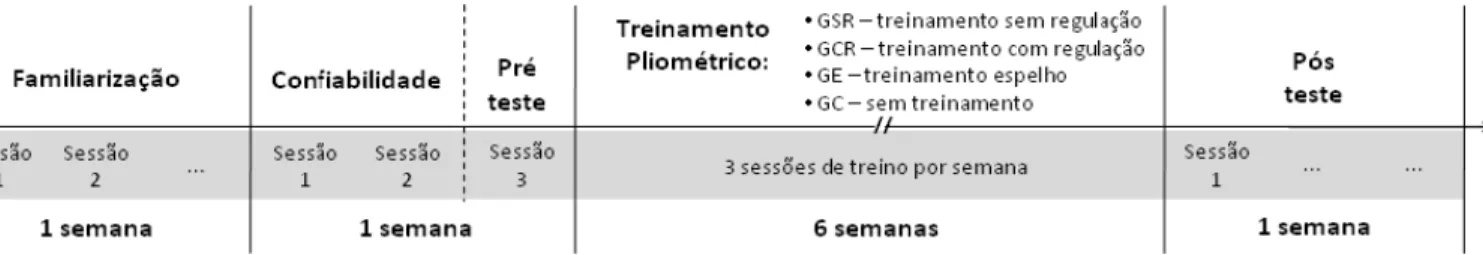
2.2 Delineamento Experimental
17
FIGURA 1. Delineamento Experimental
2.3 Protocolos de Testes
2.3.1 Familiarização
Inicialmente todos os voluntários participaram de um processo de familiarização com saltos verticais. Os procedimentos iniciais foram realizados no tapete de contato Jumptest (Hidrofit Ltda; Belo Horizonte, Brasil, com precisão de 0.1cm), conectado ao software Multisprint (Hidrofit Ltda; Belo Horizonte, Brasil). No início de cada sessão de familiarização foi realizado um aquecimento padrão no qual o indivíduo pedalava no ciclo ergômetro por 3 minutos com carga de 0.5 Kg a 60 rpm e, em seguida, realizava 3 séries de 3 saltos com contramovimento (SCM). Foram respeitados intervalos de 30 segundos entre as séries. Após o aquecimento padrão foi realizada uma sequência de SCM com intervalo de 1 minuto entre as tentativas, até que o desempenho estabilizasse. O desempenho era considerado estabilizado quando uma sequência de 8 saltos fosse equivalente ao desempenho obtido com a sequência de 8 saltos realizados anteriormente. Após 30 minutos os voluntários realizavam o mesmo procedimento com o salto agachado (SA). Esta sessão de familiarização se repetia com intervalo de 48h e o indivíduo era considerado familiarizado quando o desempenho se mantivesse estável entre duas sessões consecutivas.
2.3.2 Confiabilidade
18
do índice de correlação intraclasse (ICC) e do erro padrão de medida (EPM) da amostra. Para evitar que a sequência das tarefas influenciasse nos resultados, as sequências de saltos (SA e SCM) foram executadas com ordem aleatória.
2.3.3 Testes de Saltos Verticais
Nas etapas de familiarização, confiabilidade, avaliações pré e pós-treinamento pliométrico os voluntários realizaram o SCM e o SA. No SCM a ação concêntrica foi precedida por um movimento preparatório constituído de uma ação excêntrica, até aproximadamente 90º de flexão de joelhos. O SA foi realizado a partir de uma ação concêntrica máxima, partindo da posição inicial de aproximadamente 90º de flexão de joelhos. Em ambas as técnicas os voluntários foram orientados a realizar um esforço máximo e manter as mãos na cintura durante todo o salto [17]. Nas etapas pré e pós-treinamento os saltos foram realizados após o aquecimento padrão, e foram executados 8 SCM e 8 SA, com intervalo de 1 minuto entre cada salto. Os saltos foram aplicados, em ordem aleatória, sobre uma plataforma de força bipodal PLA3-1D-7KN/JBA Zb (Staniak; Varsóvia, Polônia, com precisão de 1 N). Os dados foram tratados no software Matlab versão 9.7.0 (MathWorks; Natick, EUA), com filtro
low-pass,butterworth de 4ª. ordem com frequência de corte de 90Hz. Para a análise
dos dados foi utilizada a média dos 8 saltos em cada técnica. A partir dos resultados obtidos no SCM os voluntários foram classificados, de acordo com os quartis do desempenho, em quartil 1 (100 - 75.1%), quartil 2 (75 - 50.1%), quartil 3 (50 - 25.1%) e quartil 4 (25 - 0%). Em seguida, os voluntários foram distribuídos de maneira aleatória, em função dos quartis, nos 4 grupos (GSR, GCR, GE e GC). A reavaliação foi realizada no intervalo de 48 a 72h após a última sessão de treinamento.
2.3.4 Antropometria
19
realizada na balança com estadiômetro (Filizola; São Paulo, Brasil, precisão de 0.01 m e 0.1 kg).
2.4 Monitoramento e Regulação
O monitoramento das cargas aplicadas foi realizado em todas as sessões de treinamento, através da mensuração da altura e do tempo de contato dos saltos verticais. Para que o desempenho em saltos verticais pudesse ser utilizado como ferramenta de regulação das cargas de treinamento, foi determinada a diferença mínima individual (DMI). Segundo Weir [31], a diferença mínima representa a variação máxima de erros aleatórios. Assim, somente foi considerada uma alteração real de desempenho quando observada uma diferença modular, entre duas medidas, superior ao valor DMI (Equação 1). A DMI foi obtida com os valores de SCM realizados nas sessões de confiabilidade.
2
145
.
2
EPM
DMI
(1)EPM= quadrado médio do erro (QMerro)
2.145= t(14) com p < 0.05 (Intervalo de Confiança de 95%)
20
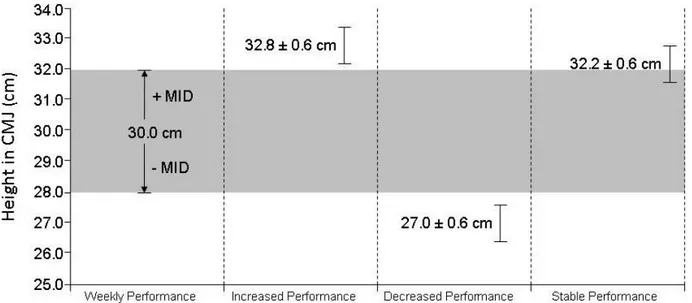
semanal = 30 cm; DMI = 2.0 cm). O indivíduo era considerado fadigado quando a diferença entre o desempenho obtido no início da sessão (média ± desvio padrão) e o desempenho na primeira sessão da semana fosse negativa e superior ao valor da DMI (e.g.: desempenho do início da sessão = 27.0 ± 0.6 cm; desempenho na primeira sessão semanal = 30 cm; DMI = 2.0 cm).
FIGURA 2. Exemplo de análises das variações de desempenho no SCM a partir da DMI.
21
2.5 Protocolos de Treinamento
2.5.1 Grupo sem Regulação (GSR)
Os participantes do GSR realizaram 6 semanas de treinamento pliométrico, com 3 sessões semanais e intervalos de 48 a 72h entre as mesmas. As cargas de treinamento foram realizadas exatamente conforme planejadas, ou seja, sem regulação. O treinamento pliométrico foi realizado sobre o tapete de contato. Mesmo o GSR não tendo sofrido regulação das cargas, todos os seus voluntários executaram o procedimento inicial (aquecimento padrão e 8 SCM) equivalente aos dos grupos que sofreram regulação. As cargas das 6 semanas de treinamento estão apresentadas na tabela 1.
TABELA 1.
Planejamento das 6 semanas de Treinamento Pliométrico
Semana Sessões Exercício RepetiçõesSéries x (% do máximo)Altura de SCM de Contato (ms)Tempo Máximo Altura de Queda (cm)
SAU 3 x 5 100% -
-1 1 – 3
SCM 3 x 30 60 – 70% -
-SCMU 3 x 5 100% -
-2 4 – 6
SCM 3 x 30 70 – 80% -
-SCM 3 x 30 80 – 90% -
-3 7 – 9
SVM 3 x 30 80 – 90 % 200
-SVM 3 x 30 80 – 90% 200
-4 10 – 12
SCM 3 x 12 90 - 100% -
-SP 3 x 10 100% 200 45
5 13 – 15
SCM 4 x 6 100% -
-SP 3 x 10 100% 200 45
6 16 – 18
SCM 3 x 4 100% -
22
2.5.2 Grupo com Regulação (GCR)
O GCR realizou o mesmo treinamento aplicado ao GSR, entretanto, as cargas de treinamento sofreram ajustes em função do desempenho apresentado nos SCM realizados no início de cada sessão. Desta forma, a regulação era efetuada imediatamente antes da aplicação das cargas.
2.5.3 Grupo Espelho (GE)
Os participantes do GE também realizaram o mesmo treinamento, contudo, os ajustes sofridos pelo GCR foram replicados nos voluntários do quartil correspondente no GE. Assim, qualquer ajuste no número de saltos realizado em algum voluntário do GCR repercutia em uma alteração de mesma magnitude em seu correspondente do GE, independentemente da sua condição no início da sessão. Para que isso fosse possível, o GE iniciou o treinamento uma semana após o GCR e o GSR. Este grupo foi utilizado com o intuito de verificar se o efeito da regulação no GCR foi devido ao adequado ajustes das cargas (momento e indivíduo dependente) ou à simples alteração do número de saltos.
2.5.4 Grupo Controle (GC)
Os participantes do GC não executaram o treinamento planejado, somente participaram das etapas pré e pós-treinamento.
2.6 Análise Estatística
A normalidade dos dados foi verificada através do teste de Kolmogorov-Smirnov.
Para avaliar a diferença de desempenho e alterações de massa corporal entre os grupos foi realizada ANOVA two-way com medidas repetidas e post hoc de Tuckey.
A carga total de treinamento foi comparada a partir da ANOVA one-way de
Kruskal-Wallis e post hoc de Tuckey. A análise do efeito da carga total de treinamento em
23
24
3 RESULTADOS
Os valores de consistência relativa (ICC, 3.1) e absoluta (EPM) dos saltos verticais realizados na etapa de confiabilidade foram respectivamente, 0.98 e 2.5% no SCM; 0.98 e 3.0% no SA.
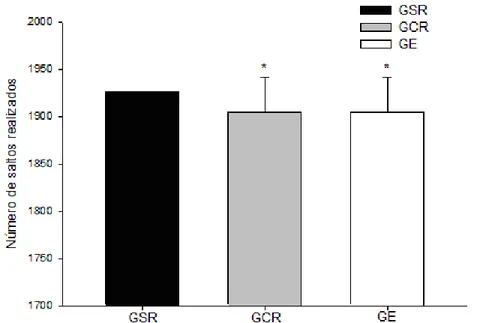
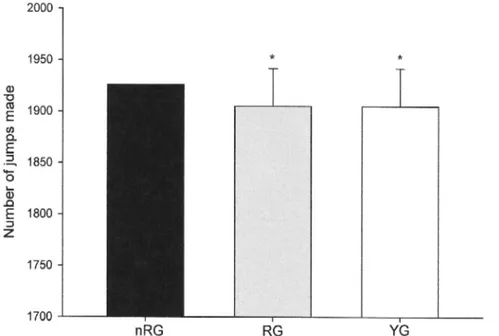
Não houve alteração na massa corporal antes e após o treinamento pliométrico e durante as 18 sessões de treinamento. O treinamento pliométrico foi iniciado sem diferença significativa entre os grupos no desempenho no SCM (p = 0.701) e no SA (p = 0.261). A carga total de treinamento, representada pelo número de saltos realizados durante as 6 semanas, foi significativamente inferior (p= 0.036; TE = 0.82) nos grupos GCR e GE (1905 ± 37 saltos) quando comparados ao GSR (1926 ± 0) (Figura 3).
FIGURA 3. Número de saltos realizados por cada grupo durante o treinamento * indica que o número de saltos foi significativamente menor em relação ao GSR. * = p < 0.05. Os valores são média e desvio padrão.
25
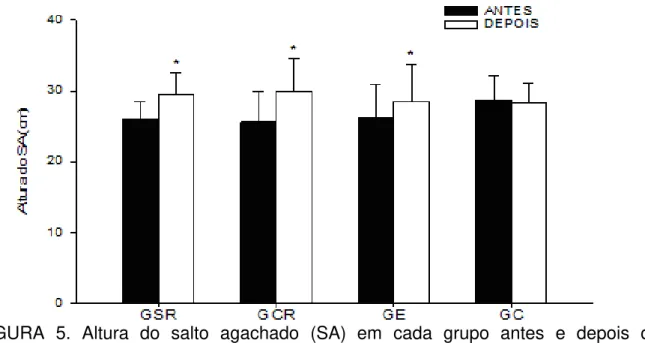
Além disso, conforme demonstrado na tabela 2, o TE dos grupos GSR e GCR foram grandes no SCM e SA. Já o TE do GE foi moderado para os dois testes realizados.
TABELA 2.
Alterações de desempenho em saltos verticais na reavaliação.
Salto com Contramovimento (SCM) Salto Agachado (SA) Grupo
Variação Valor de p TE Variação Valor de p TE GSR 9.2% < 0.001 1.05 13.0% < 0.001 1.21 GCR 13.4% < 0.001 1.01 17.2% < 0.001 0.99
GE 8.9% < 0.001 0.52 8.1% 0.003 0.43
GC -0.6% 0.757 -0.06 -1.4% 0.553 -0.13
26
27
4 DISCUSSÃO
A utilização do desempenho em saltos verticais, realizados no início da sessão, como ferramenta de regulação da carga de treinamento repercutiu em uma diminuição da carga total de treinamento, sem comprometer os ganhos de desempenho. Os aumentos de desempenho no SCM encontrados no GSR (9.2%; TE = 1.05), no GCR (13.4%; TE = 1.01) e no GE (8.9%; TE = 0.52) estão próximos dos valores geralmente encontrados em estudos que investigam os efeitos crônicos do treinamento pliométrico (entre 7.0 e 10.4%; TE entre 0.64 e 1.11) [24]. Este fato também ocorreu nos resultados obtidos no teste de SA no GSR (13.0%; TE = 1.21), no GCR (17.2%; TE = 0.99) e no GE (8.1%; TE = 0.43) que geralmente se encontram entre 1.8 e 7.6% e TE entre 0.15 e 0.72 [24].
28
básico das respostas de fadiga do CAE mostra uma bimodalidade com uma imediata redução no desempenho durante o exercício, uma rápida recuperação dentro de 1-2 horas, seguida de uma redução secundária, que muitas vezes pode mostrar os valores mais baixos no segundo dia após o exercício, quando os sintomas de dor/danos musculares são maiores também. Esta observação de redução tardia do desempenho pode estar relacionada com a resposta do Reflexo H, que tem sido claramente demonstrada pela amplitude pico a pico deste reflexo, que diminuiu significativamente imediatamente após e 48 horas pós-exercício pliométrico [26]. A utilização do desempenho no SCM para verificação do estado de fadiga já foi testada e recomenda em estudos anteriores [7, 8, 32]. Cormack, Newton e McGuigan [7] verificaram uma redução significativa no desempenho do SCM após uma partida de futebol. O desempenho se manteve reduzido até 48h após o término da atividade. Welsh et al. [32] verificaram redução significativa na altura do SCM de fuzileiros navais submetidos a 8 dias de treinamento militar. No estudo de Coutts et al. [8], o desempenho no salto vertical foi sensível à fadiga gerada por 6 semanas de treinamento de atletas de rúgbi. O treinamento foi composto por atividades de elevada intensidade e intervalos insuficientes de recuperação. A redução no desempenho foi associada ao aumento do dano muscular e ao desequilíbrio anabólico-catabólico. Estas alterações foram verificadas a partir dos aumentos de creatina quinase sanguínea, da redução na relação testosterona/cortisol, dos aumentos das concentrações plasmáticas de glutamato e da diminuição na relação glutamina/glutamato.
29
recuperação. Ainda segundo Gabbett [13], alguns treinadores dos atletas envolvidos no estudo, negligenciavam estas informações, optando pela sua capacidade intuitiva de manipular as cargas de treinamento. O efeito da regulação das cargas de treinamento também foi estudado a partir da utilização da PSE e da FC em jovens mulheres. A regulação ocorria quando o esforço percebido era fraco ao final da sessão de treinamento, ocorrendo incrementos da carga na próxima sessão. Este incremento de carga também ocorria em outro grupo quando a FC ao final da sessão obtinha 10 bpm a menos que na sessão anterior. Os resultados apresentados por Céline et al. [5] apontaram que as duas variáveis foram eficazes para regular a carga de treinamento. Assim, foi possível identificar os momentos necessários para incremento da carga, possibilitando melhora da potência máxima tolerada e do VO2 de pico ao final de 6 semanas de treinamento de ciclismo.
Durante as 6 semanas do experimento a carga total de treinamento, representada pelo número de saltos realizados, foi significativamente menor nos grupos GCR e GE em comparação com o GSR (TE = 0.82). Esta diferença ocorreu devido à regulação da carga no GCR e no GE. Mesmo assim, a carga total de treinamento do GCR e GE (1905 ± 37 saltos) ficou compatível com as cargas de treinamento com saltos verticais geralmente encontradas na literatura (entre 540 e 2600 saltos) [24]. Mesmo com a redução da carga total, o grupo que sofreu regulação (GCR) obteve um TE grande na alteração de desempenho, assim como o grupo que não sofreu regulação (GSR). Entretanto, o GE, que treinou com a mesma carga total de treinamento do GCR, obteve um TE moderado. Isso significa que a redução aleatória das cargas diminui os efeitos do treinamento. Já a adequada redução das cargas no GCR, que levou em consideração o momento e as respostas individuais, não comprometeu os efeitos crônicos do treinamento.
30
ajustes necessários. No entanto, este parâmetro é especifico para o treinamento realizado, neste caso, o treinamento pliométrico. Assim, ainda é necessária a investigação de sua eficácia em outros tipos de treinamento. Outro aspecto importante da regulação é o momento da realização do monitoramento. Este monitoramento pode ser realizado durante ou no final da sessão de treinamento, para permitir o ajuste das cargas da sessão seguinte [5, 13]. No presente estudo foi proposta a realização do monitoramento no início da sessão de treinamento. Desta forma, o ajuste das cargas se baseava na condição atual do indivíduo imediatamente antes do treino.
31
32
REFERÊNCIAS
1 ATKINSON G., NEVILL A.M. Statistical methods for assessing measurement
error (reliability) in variables relevant to Sports Medicine. Sports Med, v.26, p. 217-238, 1998.
2 BANISTER E.W., CALVERT T.W., SAVAGE M.V., BACH T.M. A systems model of training for athletic performance. Aust J Sports Med, v.7, p. 57-61, 1975.
3 BRANCACCIO P., MAFFULLI N., LIMONGELLI F.M. Creatine kinase
monitoring in sport medicine. Br Med Bull, v.81-82, p. 209-230, 2007.
4 BRINK M.S., NEDERHOF E., VISSCHER C., SCHMIKLI S.L., LEMMINK K.A.P.M. Monitoring load, recovery, and performance in young elite soccer
players. J Strength Cond Res, v.24, p. 597-603, 2010.
5 CÉLINE C.G., MONNIER-BENOIT P., GROSLAMBERT A., TORDI N., PERREY S., ROUILLON J.D. The perceived exertion to regulate a training program in young women. J Strength Cond Res, v.25, p.220-224, 2011.
6 COHEN J. Statistical Power Analysis for the Behavioral Sciences (2nd ed.). E. ed. Hillsdale, NJ: Lawrence Erlbaum, 1988: 567p.
7 CORMACK S.J., NEWTON R.U., MCGUIGAN M.R. Neuromuscular and endocrine responses of elite players to an australian rules football match. Int J Sports Physiol Perform, v.3, p. 359-374, 2008.
8 COUTTS A., REABURN P., PIVA T.J., MURPHY A. Changes in selected
biochemical, muscular strength, power, and endurance measures during deliberate overreaching and tapering in rugby league players. Int J Sports Med, v.28, p. 116-124, 2007.
9 COUTTS A.J., WALLACE L.K., SLATTERY K.M. Monitoring changes in performance, physiology, biochemistry, and psychology during overreaching and recovery in triathletes. Int J Sports Med, v.28, p. 125-134, 2007.
33
11 FOSTER C. Monitoring training in athletes with reference to overtraining
syndrome. Med Sci Sports Exerc, v.30, p. 1164-1168, 1998.
12 FOWLES J.R.Technical issues in quantifying low-frequency fatigue in athletes.
Int J Sports Physiol Perform, v.1, p. 169-171, 2006.
13 GABBETT T.J. The development and application of an injury prediction model
for noncontact, soft-tissue injuries in elite collision sports athletes. J Strength Cond Res, v.24, p. 2593-2603, 2010.
14 GABBETT T.J., DOMROW N. Relationship between training load, injury, and fitness in sub-elite collision sport athletes. J Sports Sci, v.25, p. 1507-1519, 2007.
15 GABBETT T.J., JENKINS D.G. Relationship between training load and injury in professional rugby league players. J Sci Med Sport, v.14, p. 204-209, 2011.
16 HARRIS D.J., ATKINSON G. International Journal of Sports Medicine - Ethical Standards in Sport and Exercise Science Research. Int J Sports Med, v.30, p. 701-702, 2009.
17 HERRERO J.A., IZQUIERDO M., MAFFIULETTI N.A., GARCIA-LÓPEZ J. Electromyostimulation and plyometric training effects on jumping and sprint time. Int J Sports Med, v.27, p. 533-539, 2006.
18 HOOPER S.L., MACKINNON L.T., HOWARD A., GORDON R.D., BACHMANN, A.W. Markers for monitoring overtraining and recovery. Med Sci Sports Exerc, v.27, p. 106-112, 1995.
19 HOPKINS W.G. How to interpret changes in an athletic performance test.
Sportsci, v.8, p. 1-7, 2004.
20 HOPKINS W.G. Measures of reliability in sports medicine and science. Sports
Med, v.30, p. 1-15, 2000.
21 IMPELLIZZERI F.M., RAMPININI E., CASTAGNA C., MARTINO F., FIORINI S., WISLOFF U. Effect of plyometric training on sand versus grass on muscle soreness and jumping and sprinting ability in soccer players. Br J Sports Med, v.42, p. 42-46, 2008.
22 KENTTÄ G., HASSMÉN P. Overtraining and recovery. A conceptual model.
34
23 LAZARIM F.L., ANTUNES-NETO J.M., DA SILVA F.O., NUNES
L.A., BASSINI-CAMERON A., CAMERON L.C., ALVES A.A., BRENZIKOFER R., DE MACEDO D.V. The upper values of plasma creatine kinase of
professional soccer players during the Brazilian National Championship. J Sci Med Sport, v.12, p. 85-90, 2009.
24 MARKOVIC G. Does plyometric training improve vertical jump height? A
meta-analytical review. Br J Sports Med, v.41, p. 349-355, 2007.
25 MORTON R.H. Modeling training and overtraining. J Sports Sci, v.15, p. 335-340, 1997.
26 NICOL C., AVELA J., KOMI P.V. The stretch-shortening cycle a model to study naturally occurring neuromuscular fatigue. Sports Med, v.36, p. 977-999, 2006.
27 ROGERS J.L., HOWARD K.I., VESSEY J.T. Using Significance Tests to Evaluate Equivalence Between Two Experimental Groups. Psychol Bull, v.113, p. 553-565, 1993.
28 SKURVYDAS A., BRAZAITIS M., STRECKIS V., RUDAS E. The effect of plyometric training on central and peripheral fatigue in boys. Int J Sports Med, v.31, p. 451-457, 2010.
29 STAGNO K.M., THATCHER R., SOMEREN K.A.V. A modified TRIMP to
quantify the in-season training load of team sport players. J Sports Sci, v.25, p. 629-634, 2007.
30 WALLACE L.K., SLATTERY K.M., COUTTS A.J. The ecological validity and application of the session-RPE method for quantifying training loads in swimming. J Strength Cond Res, v.23, p. 33-38, 2009.
31 WEIR J.P. Quantifying test-retest reliability using ICC and the SEM. J Strength Cond Res, v.19, p. 231-240, 2005.
32 WELSH T.T., ALEMANY J.A., MONTAIN S.J., FRYKMAN P.N., TUCKOW A.P., YOUNG A.J., NINDL B.C. Effects of intensified military field training on jumping performance. Int J Sports Med,v.29, p. 45-52, 2008.
33 WU Y.K., LIEN Y.H., LIN K.H., SHIH T.T., WANG T.G., WANG H.K.
35
ANEXOS
ANEXO A
36
37
ANEXO C Article
Vertical Jump Performance to Regulate the Training Load
João Gustavo de Oliveira Claudino Bruno Mezêncio Rafael Soncin Jacielle Carolina Ferreira Bruno Pena Couto Leszek Antoni Szmuchrowski
Abstract
The purpose of this study was to verify the regulating effect of the training load, using the countermovement jump (CMJ) at the beginning of the session, on the total plyometric training load and the vertical jumps performance. Forty-four males were divided in four groups: No Regulation Group (nRG), Regulation Group (RG), Yoked Group (YG) and Control Group (CG). The nRG received 6 weeks of plyometric training, with no adjustment in training load. The RG underwent the same training; however, the training load was adjusted according to the CMJ performance at the beginning of each session. The YG received the same load adjustments made for the RG. At the end of the training, the CMJ and squat jump performance of all of the participants was reassessed. The total training load was significantly lower (p = 0.036; effect size = 0.82) in the RG and the YG (1905 ± 37 jumps) compared to the nRG (1926 ± 0). The enhancement in vertical jump performance was significant for the groups that underwent the training. The nRG and the RG exhibited a large effect size (ES) in vertical jump performance; however, the YG had a moderate ES. Using vertical jump performance, performed at the beginning of the session, as a tool to regulate the training load resulted in a decrease of the total training load, without decreasing the long-term effects on vertical jump performance.
38
Introduction
To achieve a high level of athletic performance, it is necessary to subject the individual to stringent training situations, through a cyclic process of training-fatigue-adaptation [12]. According to Gabbett [13], it is necessary to monitor and regulate training loads to ensure that the athletes receive the correct overload progression and to guarantee a proper recovery between training sessions. Without such measures, the training-fatigue-adaptation process may be imperfect, and athletes may train while fatigued, without proper recovery [12].
Regulation involves monitoring the training responses and appropriately adjusting the planning loads. Use of an inappropriate training load may increase the probability of injury [14, 15]. These negative consequences can be minimized by identifying the individual’s fitness condition and consequently decreasing the load as necessary. However, a load increase is necessary when there is a positive response to the training [22, 25]. The challenge for coaches is to define the moment that the training may become inappropriate and then make the necessary changes using effective monitoring [9, 10] and regulation [5, 13].
Different variables are used to monitor training loads, such as heart rate (HR) [2, 29], rating of perceived exertion (RPE) [11, 30], perception of recovery quality [4, 22], perception of delayed onset muscle soreness [18,21], muscle damage markers [3, 23], running speed [9, 10], vertical jump [7, 8, 32] and horizontal jump [10]. The information obtained from monitoring, using these variables, could also be used for load regulation. However, among previous studies, only HR [5] and RPE [5, 13] have been used as load-regulating tools. Céline et al. [5] used RPE and HR to regulate loads among young women during 6 weeks of bike training. When, at the end of the training, the RPE or the HR indicated a lower training load then the previous session, the load was increased for the next session. The RPE has also been used in regulating the training loads of rugby athletes. In this case, the training load was measured by the RPE and the training time. This information was used to determine the training load threshold for regulation during the next session, when the threshold was exceeded [13].
39
Methods
Participants
Forty-four male physical education students with no history of injury to the lower limbs took part in this study. The study was performed according to the ethical standards of IJMS [16] and approved by the Ethical Committee of Human Research at the university. The volunteers did not engage in any other type of strength training of the lower limbs during the study period.
Experimental Design
After the familiarization and reliability processes, the volunteers participated in the vertical jump tests and were distributed randomly among 4 groups: the No Regulation group (nRG), the Regulation group (RG), the Yoked Group (YG) and the Control Group (CG). The nRG group (n = 11; age 23.9 ± 4.0 years; height 1.77 ± 0.05 m; body mass 74.4 ± 9.1 kg) (means ± SD) performed 6 weeks of plyometric training, without adjustment in the training load. The RG group (n = 11; age 22.4 ± 3.4 years; height 1.76 ± 0.05 m; body mass 74.7 ± 8.6 kg) performed the same training; however, the training load was adjusted according to the vertical jump performance at the beginning of each session. The YG group (n = 11; age 23.0 ± 3.1 years; height 1.80 ± 0.09 m; body mass 72.7 ± 10.5 kg) performed the plyometric training with the same adjustment made by the RG group, without consideration for the individual’s condition at the beginning of the session. The CG group (n = 11; age 24.2 ± 2.1 years; height 1.74 ± 0.05 m; body mass 72.8 ± 6.8 kg) did not engage in any type of training during the research. At the end of the training, all the participants were reevaluated in vertical jump tests (Figure 1).
Fig. 1Experimental Design
Test Protocols
Familiarization
40
the individual rode on a cycle ergometer for 3 minutes with 0.5 kg of load at 60 rpm and then performed 3 series of 3 CMJs. A 30-second break was allowed between the series. After the standard warm-up, a CMJ series was performed, with 1-minute breaks between the attempts, until the performance stabilized. The performance was considered stabilized when a sequence of 8 jumps was similar to the performance achieved previously with a sequence of 8 jumps. After 30 minutes, the volunteers performed the same procedures but with squat jump (SJ). This familiarization session was repeated at 48 hours, and the individual was considered familiarized when the performance remained stabilized between two consecutive sessions.
Reliability
The next week involved 2 sessions of reliability, with a 48-hour break, during which the volunteers performed 8 SJs and 8 CMJs each day. Performance on the test was used to determine the intraclass correlation coefficient (ICC) and the standard error of measurement (SEM) of the sample. To avoid any effect of the sequence of the tasks on the results, the jump (SJ and CMJ) sequences were assigned randomly.
Vertical Jump Tests
The volunteers used the CMJ and SJ in stages such as familiarization, reliability and pre- and postplyometric training assessment. For the CMJ, the concentric action was preceded by a preparatory movement that constituted eccentric action, until approximately 90º of knee flexion. The SJ was made from a maximal concentric action starting from an initial position at approximately 90º of knee flexion. For both techniques, the volunteers were oriented to make the maximal effort and instructed to keep the hands on the waist at all times [17]. During the pre- and post training stages, the jumps were made after the standard warm-up: 8 CMJs and 8 SJs, with 1-minute breaks between jumps. The jumps were applied randomly on a bipedal force platform PLA3-1D-7KN/JBA Zb (Staniak; Warsaw, Poland, precision of 1 N). The data were manipulated using Matlab software version 9.7.0 (MathWorks; Natick, EUA), with a low-pass filter, a 4ª Butterworth filter and an ordinance with a cut-off frequency of 90 Hz. To analyze the data, we used an average of 8 jumps for each technique. Based on the results achieved from CMJ, the volunteers were organized into quartiles according to their performance: quartile 1 (100% – 75.1%), quartile 2 (75% – 50.1%), quartile 3 (50% – 25.1%) and quartile 4 (25% – 0%). The volunteers were then distributed randomly, according to their quartile, among the four groups of participants (nRG, RG, YG and CG). The reassessment was performed between 48 to 72 hours after the last training session.
Anthropometry
Body mass was assessed at the beginning of each session, as well as pre- and post training. Height (m) and body mass (kg) were measured using the weight-scale balance with a stadiometer (Filizola; São Paulo, Brazil, precision of 0.01 m and 0.1 kg).
Monitoring and Regulation
41
determine the minimal individual difference (MID). According to Weir [31], the minimal difference represents the maximal variation of random error. A real alteration of performance was considered when a modular difference between two measures was observed to be superior to the MID value (Equation 1). The MID was determined from CMJ values obtained during the reliability sessions.
MID
SEM
2
.
145
2
(1)SEM= mean square of error (MSerror)
2.145= t(14) as p < 0.05 (Confidence Interval of 95%)
Regulation, which involved monitoring and consequent adjustments of the load, was performed at the beginning of the training sessions. The volunteers performed a sequence of 8 CMJs, in addition to the standard warm-up. The average CMJ performance in the first session of each week was used as a reference for the upcoming sessions in the same week and for the first session of the next week. As illustrated in Figure 2, the performance enhancement was only considered real when the difference between the performance at the beginning of the session (mean ± SD) and the performance of the first session of the week was positive and superior to the MID (e.g., the performance at the beginning of the session = 32.8 ± 0.6 cm; performance in the first week session = 30 cm; MID = 2.0 cm). For cases in which this difference was lower than the MID value, the performance was considered stable (e.g., performance at the beginning of the session = 32.2 ± 0.6 cm; performance during the first week’s session = 30 cm; MID = 2.0 cm). The individual was considered fatigued when the difference between the performance at the beginning of the session (mean ± SD) and the performance during the first session of the week was negative and superior to the MID (e.g., performance at the beginning of the session = 27.0 ± 0.6 cm; performance during the first week’s session = 30 cm; MID = 2.0 cm).
42
If, at the beginning of the session, the individual demonstrated fatigue or an unexpected improvement in performance, the load was adjusted as appropriate. When the individual presented with fatigue, the load was adjusted by dropping a set from each exercise or interrupting the exercise.
Training Protocols
No Regulation group (nRG)
The nRG participants engaged in 6 weeks of plyometric training, with 3 sessions a week and breaks of 48 to 72 hours between sessions. The training load was followed as planned, without regulation. Plyometric training was performed on the jump mat. The nRG did not undergo load regulation; every volunteer followed the same initial procedure (standard warm-up and 8 CMJs) used in the group that underwent regulation. The six-week training loads are presented in Table 1.
Table 1 Plan for the 6 weeks of plyometric training.
Week Session Exercise RepetitionSet x (% of maximum)Height of CMJ, Maximum Contact Time (ms) Box Height(cm)
USJ 3 x 5 100% -
-1 1 – 3
CMJ 3 x 30 60 - 70% -
-UCMJ 3 x 5 100% -
-2 4 – 6
CMJ 3 x 30 70 - 80% -
-CMJ 3 x 30 80 - 90% -
-3 7 – 9
RB 3 x 30 80 - 90 % 200
-RB 3 x 30 80 - 90% 200
-4 10 – 12
CMJ 3 x 12 90 - 100% -
-DJ 3 x 10 100% 200 45
5 13 – 15
CMJ 4 x 6 100% -
-DJ 3 x 10 100% 200 45
6 16 – 18
CMJ 3 x 4 100% -
-USJ = Unilateral Squat Jump; CMJ = Countermovement Jump; UCMJ = Unilateral Countermovement Jump; RB = Rebounds; DJ = Drop Jump [33].
Regulation group (RG)
The RG underwent the same training applied to the nRG; however, the training loads were adjusted according to the performance presented in the CMJ at the beginning of each session. Thus, regulation was performed immediately before load application.
Yoked Group (YG)
43
applied to the corresponding YG participant, with no consideration given to the YG participant’s condition at the beginning of his session. For this to be possible, the YG began the training one week after the RG and the nRG. This group was used to verify whether the effect of regulation in the RG was related to the correct load adjustment (dependent on the moment and on the individual) or just to the increase or decrease in the number of jumps.
Control Group (CG)
The control group did not undergo training; they participated only in the pre- and post training stages.
Statistical Analysis
Data normality was verified by the Kolmogorov-Smirnov test. Two-way ANOVA with repeated measures and Tukey's post-hoc test were used to assess the performance difference and body mass modification between groups. The total amount of training load was compared by a Kruskal-Wallis one-way ANOVA and by Tukey's post-hoc test. The effect of the total training load in each group was determined by Cohen's effect size (ES). These parameters were also used to verify the effect of regulation on the total training load. The ES was interpreted as small when it was equal to or lower than 0.2, moderate when higher than 0.2 and lower than 0.8 and large when equal to or higher than 0.8 [6]. The Z-test, with a confidence interval of 95%, was used to verify the stabilization level of the performance for each technique used during the familiarization process [27]. Inferential statistics were used for the descriptive analysis of the data. The significance was established with p < 0.05. Sigma Stat 3.5 software was used for the statistical analysis.
Results
44
Fig. 3Number of jumps made by members of each group during training. * indicates that the number of jumps was significantly lower than in the nRG. * = p < 0.05. The values are the mean and the standard deviation.
Significant performance enhancements were observed with both jumping techniques in the nRG, the RG and the YG after 6 weeks of training (Figures 4 and 5). Further, as demonstrated by Table 2, the ES were large for the CMJ and the SJ in the RG and the nRG. The ES was moderate for both tests in the YG group.
Table 2Changes in vertical jump performance in the reassessment.
Countermovement Jump (CMJ) Squat Jump (SJ) Group
Variation p Value ES Variation p Value ES
nRG 9.2% < 0.001 1.05 13.0% < 0.001 1.21 RG 13.4% < 0.001 1.01 17.2% < 0.001 0.99
MG 8.9% < 0.001 0.52 8.1% 0.003 0.43
45
Fig. 4Vertical jump height for the countermovement jump (CMJ) in each group before and after training. * indicates that the jump height was significantly higher than before training. * = p < 0.05. The values are the mean and the standard deviation.
46
Discussion
Using the CMJ performance at the beginning of a session as a tool to regulate the training load resulted in a decrease in the total training load, without disturbing the performance enhancement. The performance enhancements in the CMJ found in the nRG (9.2%; ES = 1.05), in the RG (13.4%; ES = 1.01) and in the YG (8.9%; ES = 0.52) were close to the values reported by studies on the long-term effect of plyometric training (between 7.0 and 10.4%; ES between 0.64 and 1.11) [24]. This also occurred in the SJ results for the nRG (13.0%; ES = 1.21), the RG (17.2%; ES = 0.99) and the YG (8.1%; ES = 0.43) (typical values of 1.8%–7.6%, ES 0.15–1.72 [24]).
47
increase in the glutamate concentration in the blood and a decrease in the glutamine/glutamate ratio.
The process of regulating the load demand, rather than monitoring the training responses, allows for adjustment of the planned stimulus, when necessary. Gabbet [13] developed an injury prediction model that was applied in professional rugby athletes. The model allowed for the monitoring and regulation of loads through a threshold of training load, which was calibrated for the size of the effect. If the athlete passes this threshold, there is a 70-times higher probability of a soft tissues injury. In this case, the loads were reduced or additional intervals were required to recover. According to Gabbett [13], some coaches neglected the information, trusting their intuitive ability to adjust the training loads. The effects of training load regulation were also studied using the RPE and the HR in young women. Regulation occurred when the perceived effort was weak at the end of the training session because of the load increase that would be experienced during the next session. This load increase also occurred in the other group when the HR at the end of the session was 10 bpm less than the previous session. The results presented by Céline et al. [5] showed that both variables were able to regulate the load training. It was possible to identify the necessary increase in the load, which enhanced the maximal tolerated power and Vo2 peak at the end of 6 weeks of cycling training.
For the 6 weeks of training, the number of jumps made was significantly lower in the RG and the YG compared with the nRG (ES = 0.82). This difference occurred because of regulation of the load in the RG and the YG. However, the total training loads of the RG and the YG (1905 ± 37 jumps) were compatible with the training loads typically used for vertical jumps (between 540 and 2600 jumps) [24]. Even with the reduced total load, the group that was regulated (RG) exhibited a large ES in performance modification, similar to the group that was not regulated (nRG). However, the YG, which trained with the same total load as the RG, exhibited a moderate ES. This means that random decreases in the loads reduced the effect of training. The appropriate decreases to the loads experienced by the RG group, as determined by timing and individual responses, did not disturb the long-term effects of the training.
48
Improved athletic performance can occur when the athlete adapts to applied loads, although the correct training progression is necessary [22, 25]. Furthermore, accumulated fatigue can reduce performance, and consequently, the planned loads may be inappropriate and increase the probability of injury [15, 16]. These variations in performance need to be detected, so the proper adjustment can be applied. However, the variation detected can be typical of an individual and may not require an adjustment. However, small variations in performance, which could be overlooked by the coaches, can be significant and necessitate an increase or decrease in training loads [19]. In the present study, adjustments were only made when the variation in the CMJ performance was higher than the MID. The CMJ used to calculate the MID were made after the familiarization process, which yielded high-quality, consistent values (ICC, 3.1 = 0.98 and SEM = 2.5%). The determination of intraindividual variation is invaluable for monitoring the performance, which is the most important measure of reliability, because it affects the accuracy of the estimation of the change in a given variable [1, 20]. Couts et al. [8] report that there are practical implications that must be considered by the coach when there are variations higher than the typical individual variation, even if not statistically significant (p > 0.05).
49
ANEXO D