MARCEL VIANA PIRES
ON THE ROLE OF BRANCHED-CHAIN AMINO ACIDS IN Arabidopsis thaliana SUBJECTED TO WATER STRESS CONDITIONS
Thesis presented to the Universidade Federal de Viçosa as part of the requirements of the Pos-Graduate Program in Plant Physiology for obtention of the degree of Doctor Scientiae
VIÇOSA
MARCEL VIANA PIRES
ON THE ROLE OF BRANCHED-CHAIN AMINO ACIDS IN Arabidopsis thaliana SUBJECTED TO WATER STRESS CONDITIONS
Thesis presented to the Universidade Federal de Viçosa as part of the requirement of the Pos-Graduate Program in Plant Physiology for obtention of the degree of Doctor Scientiae
APPROVED: December 17th, 2012
Camila Caldana Dimas Mendes Ribeiro
(Member) (Member)
Adriano Nunes-Nesi Wagner L. Araújo
(Co-advisor) (Co-advisor)
ACKNOWLEDGMENTS
I would like to thank CAPES (Coordination for Scientific Support for Post-Graduate Level Training), FAPESB (Foundation for Research Support of the State of Bahia) and DAAD (Deutsche Akademische Austausch Dienst) for the scholarships conceded. I also thank the Universidade Federal de Viçosa (UFV), the Graduate Program in Plant Physiology of UFV, and the Max-Planck-Institut für Molekulare Pflanzenphysiologie (MPIMP), Potsdam-Golm, Germany.
I am indebted to my supervisor Prof. Raimundo Santos Barros for his guidance and support and for always been willing to meet and help me in all instances.
Thanks are also due to Dr. Alisdair R. Fernie, my supervisor during the sandwich-training at the MPIMP, for the amazing opportunity and for his valuable suggestions. I also would like to thank the Max-Planck Society for funding this research.
Thanks to Prof. Wagner L. Araújo for his support and expertise on all aspects of this research, for his suggestions and comments provided on scientific writing of this thesis.
Thanks to my defense committee members, Dra. Camila Caldana, Dr. Dimas Ribeiro and Prof. Adriano Nunes-Nesi, for their knowledgeable perspectives that contributed to this research.
Pham, Danilo de Menezes Daloso, Alexandra Bottcher, Sebastian Moschen, Alexandra Florian, Regina Wendenburg, Saleh Alseekh, Ilse Balbo, Susan Bergmann, and Ina Krahnert, for all help with my research and for being a wonderful laboratory/office mates. I also would like to express my gratitude to Josef Bergstein for the excellent photography of the plants and to Karin Koehl and the Greenteam of the MPIMP for their assistance with plant growth.
Thanks are also necessary to my friends in Germany, Nadia Martins, Carla Antônio, Ana Licuco, Laís Scattolon, Maria Benina, Angelika Lüscher, and Regina Dettmann, for the friendship and so many pleasant moments.
Many thanks also go to my mother, Rita, my father, Nilton, my sister, Ana Cláudia, and my brother, Luciano, for all the encouragement.
I also would like to thank all members of my working group at UFV (Plant Growth and Development), Izabel Chaves, Eduardo Medina, Priscila Oliveira, and Amana Obolari, for the really nice atmosphere in the laboratory.
BIOGRAPHY
Marcel Viana Pires, son of Nilton Barros Pires and Rita de Cassia Viana Pires, was born in Jequié (Bahia State, Brazil), in October 24th, 1983.
In April 2001, he started the undergraduate course in Biology at Universidade Estadual de Santa Cruz (UESC), Ilhéus, Bahia State, and achieved the bachelor degree in October 2005. He achieved the Master degree in Crop Production at the same University in February 2008.
TABLE OF CONTENTS
RESUMO ... vii
ABSTRACT ... ix
1. INTRODUCTION ... 1
1.1. Objectives ... 5
2. LITERATURE REVIEW... 6
2.1. The pathways of mitochondrial plant respiration ... 6
2.2. Respiration and drought tolerance ... 10
3. MATERIAL AND METHODS ... 16
3.1. Plant material and experimental conditions ... 16
3.2. Water loss measurements and relative water content ... 18
3.3. Determination of chlorophyll a fluorescence parameters ... 18
3.4. Biochemical characterization ... 19
3.4.1. Basic analysis ... 19
3.4.1.1. Extraction of plant materials ... 19
3.4.1.2. Determination of chlorophyll content ... 19
3.4.1.3. Determination of total soluble proteins ... 20
3.4.1.4. Determination of starch ... 20
3.4.1.5. Determination of total amino acids ... 21
3.4.1.6. Determination of nitrate ... 21
3.4.2. Gas chromatography associated with mass spectrometry ... 21
3.4.2.1. Extraction of plant material for metabolic profiling ... 22
3.4.2.3. Data analysis for metabolic profiling ... 23
3.5. Quantitative Real-Time PCR ... 23
3.6. Germination assays ... 26
3.7. Statistical analysis ... 26
4. RESULTS ... 27
4.1. Phenotype of Arabidopsis mutants under water deficit conditions ... 27
4.2. Phenotype of Arabidopsis mutants after irrigation recovery ... 30
4.3. Metabolic characterization of Arabidopsis mutants under water deficit conditions ... 32
4.4. Gene expression of Arabidopsis mutants under water deficit conditions ... 42
4.5. Germination assays of Arabidopsis mutants under osmotic and salt stresses . 44 5. DISCUSSION ... 47
5.1. Future perspectives for improving the understanding of the linkages between mitochondrial respiration and drought tolerance ... 64
6. CONCLUSIONS ... 67
REFERENCES ... 69
RESUMO
PIRES, Marcel Viana, D.Sc., Universidade Federal de Viçosa, dezembro de 2012.
Papel dos aminoácidos de cadeia ramificada em Arabidopsis thaliana submetidas à condições de limitada disponibilidade hídrica. Orientador: Raimundo Santos
Barros. Co-orientadores: Adriano Nunes-Nesi e Wagner L. Araújo
Estudos recentes demonstram que o metabolismo vegetal e particularmente a respiração são alterados sob condições de estresses ambientais. Ademais, sob tais condições, vias alternativas são induzidas para suprir o processo respiratório com substratos alternativos. Uma dessas rotas envolve o complexo protéico flavoproteína de transferência de elétrons/ flavoproteína de transferência de elétrons oxidoredutase da ubiquinona (ETF/ETFQO), e é responsável pela doação alternativa de elétrons à cadeia de transporte mitocondrial. Abordagens recentes demonstraram que as enzimas desidrogenase do 2-hidroxiglutarato (D2HGDH) e desidrogenase do isovaleril-CoA (IVDH) atuam na doação de elétrons para o pool de ubiquinona via complexo ETF/ETFQO. Entretanto, o papel desempenhado por essa rota na resposta das plantas ao défice hídrico ainda não foi completamente elucidado. O presente trabalho fornece evidências fenotípicas, fisiológicas, metabólicas e moleculares de que vias alternativas respiratórias, e particularmente as enzimas ETFQO, IVDH e D2HGDH, desempenham um papel significativo nos mecanismos de tolerância à
valores de alguns parâmetros relacionados à senescência nesses mutantes, tais como teor relativo de água, teores de clorofilas e eficiência fotoquímica máxima do fotossistema II. Plantas etfqo-1, d2hgdh-2 e ivdh-1 não conseguiram recuperar o crescimento vegetativo após a retomada da irrigação, indicando que o complexo ETF/ETFQO seria um importante mecanismo de resistência à seca. O défice hídrico induziu uma extensa reprogramação metabólica em todos os genótipos analisados, culminando com o aumento do teor de aminoácidos totais, bem como diminuições nos teores de proteínas, amido e nitrato. Em adição, o perfil metabólico permitiu a identificação de uma série de compostos envolvidos na tolerância ao défice hídrico. Particularmente, incrementos nos níveis de aminoácidos de cadeia ramificada (BCAA), isoleucina, leucina e valina, parecem estar relacionados ao aumento da utilização dos mesmos como fonte alternativa de elétrons para a cadeia de transporte mitocondrial, sob condições de estresse hídrico. Análises de expressão gênica, por sua vez, revelaram, simultaneamente, um inesperado baixo nível de fotorrespiração, bem como uma possível manutenção da operação do ciclo dos ácidos tricarboxílicos durante o estresse hídrico. Por fim, o complexo ETF/ETFQO, assim como o catabolismo de BCAA, parecem desempenhar um papel relevante nos mecanismos de tolerância ao estresses salino e osmótico em eventos germinativos em Arabidopsis. Em conjunto, esses dados indicam que o metabolismo mitocondrial
ABSTRACT
PIRES, Marcel Viana, D.Sc., Universidade Federal de Viçosa, December 2012. On
the role of branched-chain amino acids in Arabidopsis thaliana subjected to water stress conditions. Advisor: Raimundo Santos Barros. Co-Advisors: Adriano
Nunes-Nesi and Wagner L. Araújo
1. INTRODUCTION
Water scarcity is considered one of the main environmental factors limiting plant growth and yield. Predictions have recently suggested that in the near future climate changes will most likely be associated with even worse problems, leading to frequent periods of drought as well as threats to both natural and agricultural ecosystems (Gornall et al., 2010). Accordingly, water deficit leads to several morphological and physiological changes in plants. Such alterations occur at both temporal (e.g. vegetative and reproductive stages are distinctly affected) and spatial scales (e.g. distinct organs and tissues present different behaviors) (Chaves et al., 2002). Those changes include reduction in shoot growth (Tardieu et al., 2000), while root growth is maintained (Sharp and Davies, 1979), decreases in photosynthesis and transpiration rates (Boyer, 1982), accumulation of abscisic acid (ABA) and several osmolytes (Morgan, 1992), changes in signaling pathways (Chaves et al., 2003), activation of detoxification processes (Hare et al., 1998), reduction in tissue water potential, and transcriptional and post-transcriptional regulation of genes (Bray, 2004; Xue et al., 2008).
have also strong impacts on agricultural yield (Flexas et al., 2005; Atkin and Macherel, 2009). This is most likely because respiratory process involves a variety of physiological functions including ATP synthesis, supply of carbon (C) skeletons for biosynthetic processes as well as regulation of cellular redox potential (Scheibe et al., 2005; Bauwe et al., 2010; van Dongen et al., 2011). Moreover respiration plays an important role in the adaptive responses of plants to several abiotic stresses by being able to eliminate reactive oxygen species (ROS) (Lambers et al., 2005; Pastore et al., 2007; Atkin and Macherel, 2009; Dinakar et al., 2010).Additionally cell respiration is one extremely flexible process being characterized by: (i) the possibility to use several compounds as substrate, such as starch, sucrose, lipids, protein, and amino acids (Ishizaki et al., 2005, 2006; Araújo et al., 2010); (ii) the interaction among diverse cell compartments and distinct metabolic pathways including glycolysis (Plaxton and Podesta, 2006), photosynthesis (Nunes-Nesi et al., 2011), photorespiration (Timm et al., 2008), nitrogen metabolism (Noguchi and Terashima, 2006), reductant transport and the maintenance of photosynthetic redox balance (Rasmusson and Escobar, 2007; Nunes-Nesi et al., 2008); (iii) the possible operation of non-cyclic modes of the carboxylic acid (TCA) cycle pathway in response to metabolic limitations, e.g. under hypoxic conditions (Rocha et al., 2010; Sweetlove et al., 2010); and (iv) the presence of alternative non-phosphorylating enzymes, such as alternative oxidases (AOX) (Rasmusson et al., 2009), uncoupling protein (UCP) (Sweetlove et al., 2006; Vercesi et al., 2006), and external NAD(P)H dehydrogenases (Rasmusson et al., 2008). Despite being such a fundamental and robust process, its flexibility and several other factors associated with it make respiration highly sensitive to environmental changes. In this way, given that photosynthesis can be limited by a range of environmental conditions and occur only in specific organs containing chlorophyll whilst respiration occurs continuously in each cell of every plant organ, it is reasonable to assume that respiration plays an important role as a mechanism for controlling yield, especially when photosynthesis is affected, for example, under limited water availability conditions (Flexas et al., 2005).
2010). In mammals, the electron-transfer flavoprotein:ubiquinone oxidoreductase (ETFQO), a nuclear-encoded protein located in the inner mitochondrial membrane, accepts electrons from the electron transfer flavoprotein (ETF) which is localized in the mitochondrial matrix, and then reduces ubiquinone (Ruzicka and Beinert, 1977; Beckmann and Frerman, 1985; Zhang et al., 2006). In these species, the ETF/ETFQO complex is essential for the catabolism of fatty acid, diverse amino acids, and choline, supplying the mitochondrion with alternative respiratory substrates to sucrose (Frerman, 1988; Frerman and Goodman, 2001). Similarly to the situation observed in mammal cells, the ETF/ETFQO complex was identified in plants being located in the mitochondrial membrane (Heazlewood et al., 2004). This complex has shown to be highly induced at a transcriptional level during dark-induced senescence (Buchanan-Wollaston et al., 2005) and oxidative stress (Lehmann et al., 2009). Using a combination of enzymatic, metabolic, and isotopic labeling approaches in Arabidopsis thaliana mutants it has been recently demonstrated that products derived
from the ETF/ETFQO pathway (mainly aromatic and the branched-chain amino acids – BCAA, isoleucine, leucine, and valine) are potential alternative electron donors at the mitochondrial level (Ishizaki et al., 2005, 2006; Araújo et al., 2010). This donation occurs either directly, with the transfer of electrons to the mitochondrial electron transport chain (mETC) via ETF complex, or indirectly, by the direct feeding of catabolic products into the TCA cycle (Araújo et al., 2010).
to those observed in Arabidopsis plants with mutations in genes encoding ETF and ETFQO (Ishizaki et al., 2005, 2006). Altogether these results indicate that both D2HGDH and IVDH are able to donate electrons to the ubiquinone pool via ETF/ETFQO complex (Araújo et al., 2010). It is equally important to note that those T-DNA mutants also presented early senescence phenotype under other more common physiological circumstances, such as cold (13°C), short days (8 h light/16 h dark), and continuous light (24 h light/0 h dark) (Araújo et al., 2010). Despite the fact that those enzymes are encoded by unique genes and operate in two separate albeit functionally similar pathways, IVDH seems to be of more relevance in supplying ETF/ETFQO with electrons than D2HGDH, since the first seems to use more potential substrates (Araújo et al., 2010). However it is important to note that although only those two enzymes are currently known to supply the ETFQO complex with electrons in Arabidopsis (Araújo et al., 2011a), the remarkable phenotypic changes observed in those mutants illustrate the importance of such metabolic pathway in plants.
Although the role of alternative substrates under dark-induced senescence seems to be well accepted, it is important to note that the physiological role of alternative substrates during other stress situation such as water shortage still remains largely unknown. Bearing that in mind, studies aiming to fully understand the role of the BCAA as alternative substrate supplying electrons to the mETC under water deficit conditions are of great significance. It is not surprisingly that osmotic adjustments can also contribute to the maintenance of cell turgor, which is a requirement underlying plant growth during water stress (Bartels and Sunkar, 2005). Nevertheless, although much is known about the osmoprotectant function of some metabolites (e.g. proline), the role of osmoprotection mechanisms under situations in which the mitochondrial metabolism is genetically altered remains mostly uncharacterized.
Accordingly a more detailed analysis of plants with genetically altered respiratory activity, mainly through the manipulation of alternative respiratory pathways would help us to understand this intriguingly connection. Such analysis would allow a better understanding of mechanisms associated to acclimatization as well as to those involved in the interaction between respiration and photosynthesis under water deficit conditions.
1.1. Objectives
The main goal of this study was to elucidate the physiological role of enzymes involved in the alternative supply of electrons to the mETC in Arabidopsis thaliana plants under limited water conditions.
More specifically, it aims to:
i) investigate molecular and metabolic responses in Arabidopsis plants deficient in the expression of IVDH, D2HGDH, and ETFQO enzymes under water deficit conditions;
ii) understand the role of BCAA as potential alternative substrates for the donation of electrons to the mETC under limited water conditions; iii) analyze the role of BCAA metabolism during the recovery of
irrigation;
2. LITERATURE REVIEW
2.1. The pathways of mitochondrial plant respiration
Mitochondrion presents two membrane systems that functionally limit them into four regions. The outer membrane is not osmotically active and contains relatively few proteins. The inner membrane is osmotically active and impermeable to most solutes. It presents several proteins including specific transporters for substrates, ions, and macromolecules as well as most of the componentes of the mETC. The intermembrane space, in turn, contains relatively few but essential proteins. For example, cytochrome c is a soluble protein that interacts with other protein complexes, transfering electrons between the components of the mETC located in the inner membrane. Moreover, the inner membrane encloses the matrix compartment, which contains several enzymes not only from the TCA cycle but also from amino acid metabolism (Rasmusson et al., 2004).
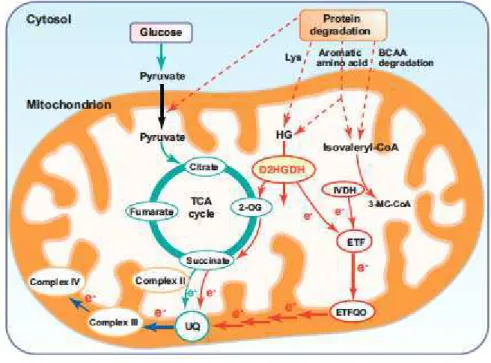
dehydrogenases, which are responsible for the donation of electrons to the ubiquinone pool of the mETC, are the rotenone-sensitive NADH dehydrogenase (Complex I), which oxidizes matrix NADH, and succinate dehydrogenase (Complex II), which oxidizes the TCA cycle intermediate succinate to fumarate (Figure 1). Ubiquinone reduced by these protein complexes is then oxidized by the cytochrome chain that consists of the bc1 complex (Complex III), soluble cytochrome c in the intermembrane space, and cytochrome c oxidase (Complex IV). The electron transport activity of complex I, III and IV is coupled to extrusion of protons across the inner membrane. The resultant potential across the inner membrane is finally used to drive ATP synthesis by the mitochondrial ATP synthase (Complex V) (Fernie et al., 2004; Rasmusson et al., 2004, 2008; van Dongen et al., 2011).
Figure 1. Schematic overview of the components involved in classical and
Recent efforts into plant mitochondrial electron transport has, however, focussed on alternative components that serve as non-phosphorylating by-passes (Figure 1). These include alternative non-phosphorylating enzymes, such as alternative oxidases (AOX) (Rasmusson et al., 2009), uncoupling protein (UCP) (Sweetlove et al., 2006; Vercesi et al., 2006), and external NAD(P)H dehydrogenases (Rasmusson et al., 2008). These alternative mechanisms will be discussed in details in the following section. In addition, several other electron entry points have been characterized in plants, such as L-galactono-1,4-lactone (GalL) dehydrogenase (Valpuesta and Botella, 2004), glycerol-3-phosphate (G3P) dehydrogenase (Shen et al., 2003, 2006), and finally ETF/ETFQO pathway (Ishizaki et al., 2005, 2006; Araújo et al., 2010). This has substantially increased the number of branches and thus the complexity of mETC in plants (Rasmusson et al., 2008). The importance of such by-passes have been expertly reviewed elsewhere (Rasmusson et al., 2008; van Dongen et al., 2011; Jacoby et al., 2012) and with the exception of the ETF/ETFQO pathway will not be discussed here.
The ETF/ETFQO complex is probably the most central of several additional electron donors in plants and exhibits high similarity to its homologous complex in animal systems (van Dongen et al., 2011). In mammals it has been observed that the ETF/ETFQO complex is involved in the oxidation of fatty acids, choline and various amino acids (Frerman, 1987, 1988) thereby providing an alternative substrate to feed electrons into the mETC. The presence of the ETF/ETFQO complex in plant mithocondria was first reported by Heazlewood and Millar (2005) who identified the ETF system by liquid chromatography–mass spectrometry proteomics in Arabidopsis. Subsequently, Buchanan-Wollaston et al. (2005) observed that this
protein complex was induced at the transcription level during dark-induced senescence, while Lehmann et al. (2009) demonstrated that oxidative stress induces the expression of this complex.
The physiological role of both ETF and ETFQO was investigated via a characterization of TDNA knockout mutants of the respective proteins in Arabidopsis (Ishizaki et al., 2005, 2006). The authors observed accumulation of
transferring electrons from aromatic amino acids, BCAA, and lysine to the ETF/ETFQO complex, whereas the enzyme 2-hydroxyglutarate dehydrogenase (D2HGDH) does so using aromatic amino acids and lysine as substrate (Araújo et al., 2010), and that both pathways are linked to protein degradation (Araújo et al., 2011c) was recently provided (Figure 2). Interestingly, knockout mutants of both enzymes display early senescence under several growth conditions, such as cold, continuous light and short day (Araújo et al., 2010). However, the understanding of regulation of the responses of this alternative pathway of respiration is still limited and further efforts are needed to, for example, characterize the linkage between protein degradation, amino acid turnover and alternative respiration (Araújo et al., 2011c)
Figure 2. The ETF/ETFQO complex feeding electrons to the mETC. Dotted arrows
2.2. Respiration and drought tolerance
The percentage of fixed C released through respiration is, generally, higher in plants under water deficit (Zagdanska, 1995; Atkin and Macherel, 2009), despite the lack of consensus amongst researchers on the extent of this comparison. For instance, Bartoli et al. (2005) verified increased respiratory rates in wheat plants under water deficit, while Gonzalez-Meler et al. (1997) observed a decrease respiration in beans and pepper, and Ribas-Carbo et al. (2005) have not found any alterations in soybean plants. While the maintenance of respiratory rates in plants under stress may have a negative impact in the overall C balance, due to the continuous loss of CO2 to the
atmosphere, this maintenance can play a significant role in both plant development and survival under water deficit conditions. In good agreement many studies have already suggested that mitochondria and chloroplasts are organelles intimately connected by metabolic and signaling pathways and, thus, photosynthesis would also be intimately dependent on mitochondrial functions (Nunes-Nesi et al., 2005, 2007; Sweetlove et al., 2006; Araújo et al., 2011b).
Changes induced by water deficit in the respiratory flux may reflect variations in (i) respiratory enzyme activities, (ii) substrate availability (by decreasing C fixation and, consequently, production of sugars) and (iii) demand for ATP (associated with growth, maintenance of cellular metabolism, and ion transport) (Atkin and Macherel, 2009). It is well known that under optimum temperature conditions, the respiratory rate in well hydrated plants is rarely limited by the enzymatic capacity (Atkin et al., 2005). Although relatively little is known about the role of the enzymatic capacity in limiting respiratory flux under water deficit conditions, Herppich and Peckmann (2000) have observed that the in vitro activity of a number of respiratory enzymes were not altered by water deficit, in two species with crassulacean acid metabolism (CAM). Moreover, the velocity of drought-induced alterations in the respiratory flux suggest that changes in enzymatic capacity per se are not likely to be the main cause of variations in respiratory rates (Atkin and
Macherel, 2009).
resulting from water stress (Lawlor and Fock, 1977). However, it should be pointed out that a decrease in photosynthesis is not necessarily followed by a decrease in respiratory rates (Bartoli et al., 2005; Ribas-Carbo et al., 2005). In this way, it has been demonstrated that soluble sugar concentration might decrease (Lawlor and Fock, 1977), increase (Dekankova et al., 2004), or keep unaltered (Ghashghaie et al., 2001) during the onset of water deficit. Thus, decreased substrate availability does not seem to be the only factor responsible for limiting respiratory rates under water deficit conditions, at least in the short-medium run (Atkin and Macherel, 2009).
Under suitable water supply mitochondria provide to chloroplasts C skeletons (e.g. citrate) required for nitrogen (N) assimilation, as well as ATP, which are fundamental to sucrose synthesis, phloem transport, and maintenance of cellular processes, such as protein turnover and maintenance of ionic gradients (Bouma et al., 1994; Hoefnagel et al., 1998; Atkin and Macherel, 2009). By sharp contrast, under water deficit a decreased provision of C skeletons from mitochondria to chloroplasts is observed, mainly due to the fact that de novo N assimilation, especially at nitrate reductase level, is decreased (Fresneau et al., 2007). It is important to highlight, however, that the provision of ATP to chloroplasts is maintained mainly via chloroplast nucleotides (Reinhold et al., 2007), which, at least partially, can compensate for energetic damages occurred during oxidative phosphorylation in chloroplasts under water deficit (Atkin and Macherel, 2009). It has been demonstrated that in Arabidopsis two genes encoding chloroplast nucleotide transporters (AtNTT1 and AtNTT2) had increased expression levels under water deficit or osmotic stress situations (Toufighi et al., 2005; Winter et al., 2007), which seems to corroborate the hypothesis that mitochondrial ATP may be imported by chloroplasts under such stressful conditions.
derived from non-cyclic photophosphorylation. It seems reasonable to assume therefore that part of the reducing equivalents generated in chloroplasts under water deficit should be reoxidized via other processes in the plastids (e.g. antioxidant systems) or even in other cellular compartments (Krömer, 1995).
Plant mitochondria exhibit large flexibility in electron transfer and energy dissipation, which is of critical importance in stressed environmental conditions (Atkin and Macherel, 2009). In addition to the classical oxidative phosphorylation machinery, plant mitochondria contain non-phosphorylating respiratory bypasses of electron transport and of proton-coupled ATP synthesis (Jacoby et al., 2012). The specific enzymes branche from the common electron path and allow the mETC to adapt to different cellular and metabolic requirements. Recently, the known number of plant respiratory chain dehydrogenases has increased, including both components specific to plants and those with mammalian counterparts (Rasmusson et al., 2008). For instance, NAD(P)H dehydrogenases proteins (Escobar et al., 2004; Rasmusson et al., 2004) and alternative oxidase enzymes (AOX) (Vanlerberghe and McIntosh, 1997) allow for deviation in electron transfer, while the proton gradient may be dissipated by mitochondrial uncoupling proteins (UCPs) (Sluse et al., 2006) or by parallel activity of K+/H+ antiporters and K+ symporter channels (Pastore et al., 1999) (Figure 3). Moreover, substantial increases in some mitochondrial transporters activities (Fratianni et al., 2001) as well as mitochondrial protein import have been reported under water deficit conditions, suggesting a relevant capability of biogenesis and repair (Taylor et al., 2003). These systems allow the reoxidation of substrates via mitochondria as well as prevent the accumulation of reactive oxygen species (ROS) derived from the over-reduction of the mETC (Bartoli et al., 2004; Atkin and Macherel, 2009).
Under such conditions, an alternative pathway via AOX seems to play a role in preventing the formation of ROS as well as in sustaining respiration under circumstances in which the cytochrome c pathway seems to be limited (Lambers et al., 2005) (Figure 3).
Alterations in the in vivo activities of cytochrome c oxidase (COX) and AOX in plants under limited water availability conditions have also been frequently reported (Ribas-Carbo et al., 2005; Flexas et al., 2006; Pastore et al., 2007). Unlike the classical pathway, in which electrons flow via cytochrome c (responsible for the generation of the proton-motive force used in the synthesis of ATP), the alternative pathway streams electrons directly from the ubiquinone to O2, via AOX enzyme
(Figure 3). Accordingly Ribas-Carbo et al. (2005) have observed decreased COX activity in soybean leaves under water deficit while AOX displayed elevated activity under the same conditions. Similarly, Pastore and colleagues examined a variety of drought-tolerant wheat (Triticum durum) and have not only verified significant increased AOX activity but also elevated UCP activity and the existence of an ATP-sensitive K+ channel suggesting that energy dissipation systems may decrease mitochondrial ROS production (Pastore et al., 2007). It has been also demonstrated that an AOX positive regulation in wheat plants (Triticum durum) under water deficit is important for the maintenance of photosynthetic capacity and, consequently, drought tolerance (Bartoli et al., 2005).
ROSs via respiratory chain increases nonlinearly under situations of high membrane potential (e.g. water deficit) (Smith et al., 2004; Sweetlove et al., 2006) (Figure 3). For instance, it has been demonstrated that two genes encoding UCPs in Arabidopsis (AtPUMP1 and AtPUMP5) are highly expressed under water deficit (Kreps et al., 2002; Seki et al., 2002), which brings the importance of these proteins to drought-tolerance mechanisms into evidence. Furthermore, higher levels of AtUCP1 in tobacco improved tolerance to salt and drought stresses, and this protection was correlated with lower oxidative stress (Begcy et al., 2011).
Alternative NAD(P)H dehydrogenase proteins constitute another important mechanism related with electron transfer deviation and consumption of reducing power to reduce ubiquinone pool. These proteins do not fully span the mitochondrial membrane and the sides remain exposed either to the matrix or the intermembrane space (Finnegan et al., 2004; Rasmusson et al., 2008). Unlike the integral protein that constitutes the mETC complex I, alternative NAD(P)H dehydrogenases are not involved in proton transport from the matrix to the intermembrane space. Thus, these proteins do not contribute directly to the formation of proton-motive force or ATP synthesis (van Dongen et al., 2011). Intriguingly, under several stress situations, such as excess light, drought, or pathogen infection (Dodd et al., 2010), the supply of electrons to the mETC via NAD(P)H dehydrogenase is altered, suggesting that this protein plays an additional role under stressful situations (Figure 3). It is important to mention, however, that the role of these alternative dehydrogenases under limited water availability conditions has not yet been fully understood.
gene expression level, with the combined data discussed in the context of the current models of metabolic regulation and importance of plant respiration as well its alternative pathways and BCAA metabolism in the illuminated leaf under water shortage.
Figure 3. Energy dissipating systems in plant mitochondria membrane. The scheme
3. MATERIAL AND METHODS
3.1. Plant material and experimental conditions
All Arabidopsis thaliana plants used in this study were of the Columbia ecotype (Col-0). The T-DNA mutant lines GK756G02 (ivdh-1, Araújo et al., 2010; Figure 4A), SAIL844G06 (d2hgdh-2, Araújo et al., 2010; Figure 4B) and SALK_007870 (etfqo-1, Ishizaki et al., 2005; Figure 4C) were handled exactly as previously described. Three different D2HGDH overexpressor lines (D2HGDH OX 6.3, 8.4 and 9.3) were also used. The Arabidopsis Genome Initiative locus numbers for the major genes discussed in this study were as follows: IVDH, At3g45300; D2HGDH, At4g36400; and ETFQO, At2g43400 (The Arabidopsis Genome Initiative; http://www.arabidopsis.org/). It is important to note that, under normal growth conditions (non-stressed conditions), all mutant lines present wild type like phenotype (Figure 4D).
1.02 phenological growth stage (2 rosette leaves < 1 mm; Boyes et al., 2001) were transferred to plastic pots containing commercial substrate and cultivated in growth chamber (150 µmol m-2 s-1, 22°C, 70% RH), under short-day conditions (8 h light/16 h dark) for two more weeks to stimulate rosette growth. Finally, plants were transferred to a greenhouse (150 µmol m-2 s-1, 22°C, 70% RH), and cultivated under long-day conditions (16 h light/8 h dark).
Figure 4. Squematic representation of the sites of T-DNA insertion and phenotype of
mutants used in this study. Gene structure of Arabidopsis knockout mutants ivdh-1 (A), d2hgdh-2 (B) and etfqo-1 (C). Arrowheads represent positions of primer used for genotyping of wild-type and mutant lines; closed boxes indicated exons. (D) Images of 4-week old Arabidopsis plants (wild type and mutant lines) cultivated in a greenhouse (150 µmol m-2 s-1, 22°C, 70% RH) and under long-day conditions (16 h light/8 h dark), under normal growth conditions (non-stress conditions). WT: wild type. Source: A and B adapted from Araújo et al. (2010); C adapted from Ishizaki et al. (2005)
Four-week-old plants, at the 3.9 phenological growth stage (rosette growth complete; Boyes et al., 2001) were subjected to a progressive water deficit by suspension of irrigation and then given recovery irrigation aiming at analyzes the capacity of recovery vegetative growth of those plants. At days 0, 5, 7 and 10 of drought stress and following 1, 3 and 5 days of recovery irrigation samples were harvested for further analysis. Control plants were watered daily to maintain soil
A
B
C
D A
B
C
water close to field capacity. The pots containing plants were daily weighed to assess the level of water in the soil. Whole rosettes of six independent samples by genotype were harvested, at each harvest day, and were immediately immersed in liquid nitrogen and stored at -80°C until further use. For the metabolic analysis, frozen leaf tissues were ground in a mixer mill (Retsch MM301, Retsch, Haan, Germany), in appropriate container with steel balls for 45s at 25 Hz. After grinding, samples were aliquoted and stored at -80°C until further use.
3.2. Water loss measurements and relative water content
For water loss measurements, the weight of detached leaves incubated abaxial side up under greenhouse conditions was obtained between 8 and 12h, at 20 min interval. Water loss was calculated as a percentage of the initial fresh weight (Araújo et al., 2011c).
Leaf relative water content (RWC) was assessed to monitor the status of leaf hydration at 0, 5, 7, and 10 days without watering as well as at 1, 3, and 5 days after the recovery of irrigation. One leaf from each replicate was excised and weighed in order to obtain the fresh weight (FW). Afterwards, leaves were hydrated for 2 hours in Petri dish containing distilled water, under greenhouse conditions, and weighed in order to obtain the turgid weight (TW). Finally, leaves were oven-dried at 72 ºC for 72 h and weighed in order to obtain the dry weight (DW). For the calculation of RWC, the following equation was used:
3.3. Determination of chlorophyll a fluorescence parameters
Chlorophyll a fluorescence was assessed using a pulse modulated chlorophyll fluorescence monitoring system (FMS2, Hansatech, Norfolk, United Kingdom). In dark-adapted (30 min) leaves, the leaf tissue was illuminated with weak modulated short pulse of far-red light (1-2 µmol m-2 s-1), in order to determine the initial fluorescence (F0). Saturating white light pulses of 6000 µmol m-2 s-1 were applied for
1.0 s to ensure for maximum fluorescence emissions (Fm), from which the
variable-( )
DW TW
DW FW RWC
to-maximum chlorophyll fluorescence ratios, Fv/Fm = [(Fm – F0)/Fm)] were
calculated. This ratio has been used as a measure of the potential photochemical efficiency of PSII (Oh et al., 1996).
3.4. Biochemical characterization
3.4.1. Basic analysis
3.4.1.1. Extraction of plant materials
About 20 mg of plant material were aliquoted in 1.5 Eppendorf tubes. For extraction, 250 μL 98% ethanol were added to the material and the tubes were shaken for 20 min at 80°C. Later on, tubes were centrifuged for 5 min at 14000 g and supernatant (S1) collected in a new 2 mL tube. The pellet was resuspended in 250 μL 80% ethanol, shaken for 20 min at 80°C, and centrifuged once more for 5 min at 14000 g in order to collect the supernatant (S2). The same procedure was repeated with 250 μL 50% ethanol in order to obtain the supernatant (S3). The three supernatant fractions (S1 + S2 + S3) were pooled and the tubes were kept in ice to determine chlorophyll content. For further analysis, pellet was stored at -80°C and the mix of supernatants at -20°C. Chlorophyll content was determined exactly as described by Porra et al. (1989). The levels of starch in the leaf tissue were determined as described previously (Fernie et al., 2001). The levels of nitrate, total amino acids, and protein were measured as described by Sienkiewicz-Porzucek et al. (2008).
3.4.1.2. Determination of chlorophyll content
chlorophyll a = (A665 x 5.48) – (A645 x 2.16). The content of chlorophyll b was determined accordingly to the equation: chlorophyll b = (A645 x 9.67) – (A665 x 3.04) (Arnon, 1949). Later, the total content of chlorophyll (a + b) as well as chlorophyll a/b ratio was determined.
3.4.1.3. Determination of total soluble proteins
In order to determine protein contents, the pellet was resuspended in 1 mL 100% ethanol and centrifuged at 14000 g for 10 min, at 4°C. The supernatant was discarded and tubes were centrifuged once more at 14000 g for 5 min, at 4°C. Afterwards, 400 μL KOH 0.2 M were added and tubes incubated for 60 min, at 95°C. Later on, tubes were let to cool down at room temperature and centrifuged at 14000 g for 5 min. Aliquots of supernatants were distributed on microplates in duplicates, as well as different concentrations of standard bovine serum albumin solutions (BSA) (0, 2, 4, 6, 8, 10 and 12 μg/μL of BSA in KOH 0.2 M). Afterwards, 250 μL of Bradford solution (1:5 dilution) were added and the microplate was incubated at room temperature, for 5 min. The absorbance was measured at 595 nm on the same microplate reader described above and the content of protein was calculated according to Bradford (1976).
3.4.1.4. Determination of starch
A commercial kit (R-Biopharm AG, Darmstadt, Germany) was used to measure starch levels. The pellet was neutralized in a solution of acetic acid 1 M and centrifuged at 14000 g for 10 min, at 4°C, after becoming homogenized with the KOH 0.2 M as described above. For the determination of starch content, 25 μL of the
solution 1 of the kit (citrate buffer/amyloglucosidase), 3 μL of distilled water and 10 μL of neutralized supernatant were pipetted on the microplate and it was heated at 56
absorbance measured for 60 min at 340 nm. The content of NADPH produced is stoichiometrically equivalent to the content of glucose, which was then used for the determination of the content of starch in samples.
3.4.1.5. Determination of total amino acids
To determine total amino acids contents, 50 μL of Na-Citrate buffer 1 M + 0.2% ascorbic acid, pH 5.2, was added to an aliquot of the supernatant mix (S1 + S2 + S3) and to 50 μL of ninhydrin solution were added. A standard curve of leucine solutions (1 mM leucine and 70% ethanol; 0, 2, 4, 8, 10, 20 and 50 nM) was also used. Tubes were covered and heated for 20 min, at 95°C. After fast centrifugation (10000 g for 10 s), the content was transferred, in duplicates, to a microplate and absorbance was measured at 570 nm on the same microplate reader described above.
3.4.1.6. Determination of nitrate
Nitrate levels were determined in a detection mixture composed of potassium phosphate buffer 1 M (pH 7.5), NADPH 50 mM in NaOH 5 mM and nitrate reductase (Roche 5U/mL in phosphate buffer 0.1 M). Distilled water, as a control, was used instead of nitrate reductase to determine the levels of nitrite present in samples. Different concentrations of potassium nitrate (KNO3) were used as standard
solutions (0, 0.4, 0.8, 1.6 and 3.2 mM). 95 μL of the detection mix and 5 μL of
ethanolic extract were pipetted, in duplicates, on the microplate, and incubated for 30 min, at 25°C. Later, 15 μL of N-methyl-phenazine methyl-sulfate (PMS) were added to the plate and, once again, incubated for 20 min, at 25°C. Finally, 60 μL of sulfanilamide (1% w/v in phosphoric acid 3 M) and 60 μL of N-(1-naphthyl)-ethylenediamine dihydrochloride (NNEDA; 0.02% w/v) were added and the microplate was incubated again for 10 min, at 25°C. Absorbance was measured at 570 nm on the same microplate reader described above.
3.4.2. Gas chromatography associated with mass spectrometry
and identification of metabolites. This method allows for the detection of amino acids, organic acids, sugars, among other classes of compounds. The system consists of a gas chromatograph (6890N Aligent, Böblingen, Germany) connected to a mass spectrometer Pegasus III (Leco Instruments, St. Joseph, USA). The auto sampler (CTC Combi PAL, CTC Analytics AG, Zwingen, Switzerland) aspirates, with an injection syringe, over 1 μL of sample, which is then transferred to an injection port where it is vaporized at 230°C. Non-volatile components remain in the injector. Volatile substances are carried, via helium gas, to the chromatograph column (30m MDN-35 Machery-Nagel, Düren, Germany). This column is made of glass capillary, polyphenylmethylsiloxane-coated. This compound forms the stationary phase and is responsible for the separation of metabolites. Variations in analysis retention time are due to different compound affinities and to the column coating.
3.4.2.1. Extraction of plant material for metabolic profiling
Approximately 50 mg of homogenized plant materials were aliquoted in 2 mL Eppendorf tubes and extracted in 1400 μL of 100% methanol and 60 μL of internal standard (0.2 mg ribitol mL-1 water). Tubes were shaken for 15 min at 70°C and 950 g and next centrifuged at 14000 g for 10 min. The supernatant was transferred to
glass tubes (Schott GL14, Schott AG, Mainz, Germany) and, afterwards, 750 μL of 100% chloroform and 1500 μL of distilled water were added. Glass tubes were centrifuged at 4000 g for 15 min. Finally, 150 μL of the upper phase of each sample were transferred to new 2 mL Eppendorf tubes and let to dry overnight in a vacuum centrifuge (SPD 111 V-230, Thermo Scientific, Waltham, USA). To avoid metabolite oxidation, tubes were filled, after dried, with argon gas and stored at -80°C until the derivatization procedure (Lisec et al., 2006).
3.4.2.2. Derivatization for metabolic profiling
fatty acid methyl esters (FAMES), which the retention times are already known (see Supplemental Table S1), were added to the samples. Tubes were incubated one more time for 30 min, at 37°C and 950 g and, finally, contents were transferred to specific CG-MS glass vials (1.1 STVG, 8-SC-ST15, Chromacol, Welwyn Garden City, United Kingdom).
3.4.2.3. Data analysis for metabolic profiling
GC-MS data obtained via Chroma TOF software were analyzed with Pegasus (LECO Instruments GmbH, Möchengladbach, Germany) and TagFinder v4.0 (Luedemann et al., 2008), based on the FAME MDN35 Library, from Golm Metabolome Database (http://gmd.mpimp-gol.mpg.de/download/). Metabolite peak heights were extracted and the retention time was calculated. The identification of compounds was done by means of comparison among mass spectrometry and retention times calculated with those obtained from reference compounds commercially available. The detection of peaks was performed through the identification of similarities among mass spectrometry in a time interval of about 0.25 min the retention time expected for each targeted metabolite. Metabolites were then identified through exact retention times and their corresponding mass spectrometry (Roessner et al., 2001; Lisec et al., 2006).
3.5. Quantitative Real-Time PCR
min, at 4°C. The supernatant was discarded and the tubes were let to dry at room temperature for 10 min. The pellet was resuspended in 20 μL diethyl pyrocarbonate (DEPC)-treated H2O. Then, total RNA was treated with DNAse I (RQ1 RNase free
DNase I, Promega, Madison, WI, USA). The integrity of the RNA was checked on 1% (w/v) agarose gels, and the concentration was measured before and after DNase I digestion using a Nanodrop ND-1000 spectrophotometer (Nanodrop Products, Wilmington, DE, USA). Finally, 2 μg of total RNA were reverse transcribed using cDNA synthesis kit (Amersham Biosciences, Piscataway, NJ, USA) according to the manufacturer's recommendations.
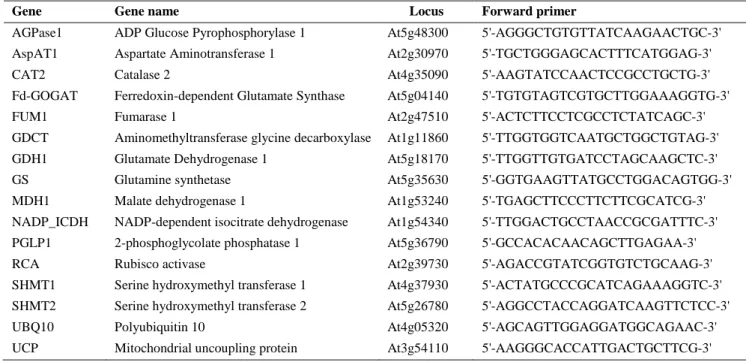
Table 1. Primers used in the RT-PCR analyses performed in this study
Gene Gene name Locus Forward primer Reverse primer
3.6. Germination assays
For the germination assays, approximately 100 seeds of each genotype were sterilized (70% ethanol, 5% sodium hypochlorite, Tween 20, and distilled water), soaked in Petri dishes (n = 3) containing MS medium (Murashige and Skoog, 1962), one half strength, pH 5.7, 1% sucrose (control) and without sucrose (treatments, Table 2), and kept in the dark for 3 days at 4°C. The Petri dishes were transferred to a growth chamber (150 µmol m-2 s-1, 22°C, 70% RH) under long-day conditions (16 h light/8 h dark). The assessment of seed germination started two days after transferring dishes to the growth chamber. Daily assessments occurred always at noon and germination (radicle emergence) was scored until seven days after stratification.
Table 2. Treatments used in experiments on seed germination
Treatments Concentrations Function
Control
NaCl 50 and 100 mM Salt stress inductor Mannitol 200 mM Osmotic stress inductor
Lysine 10, 50 and 100 mM Amino acid
Valine 10, 50 and 100 mM Brached-chain amino acid
3.7. Statistical analysis
4. RESULTS
4.1. Phenotype of Arabidopsis mutants under water deficit conditions
Arabidopsis knockout (KO) and overexpressor (OE) lines as well as their
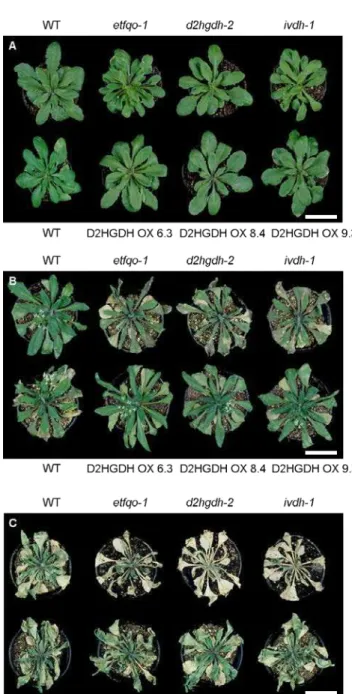
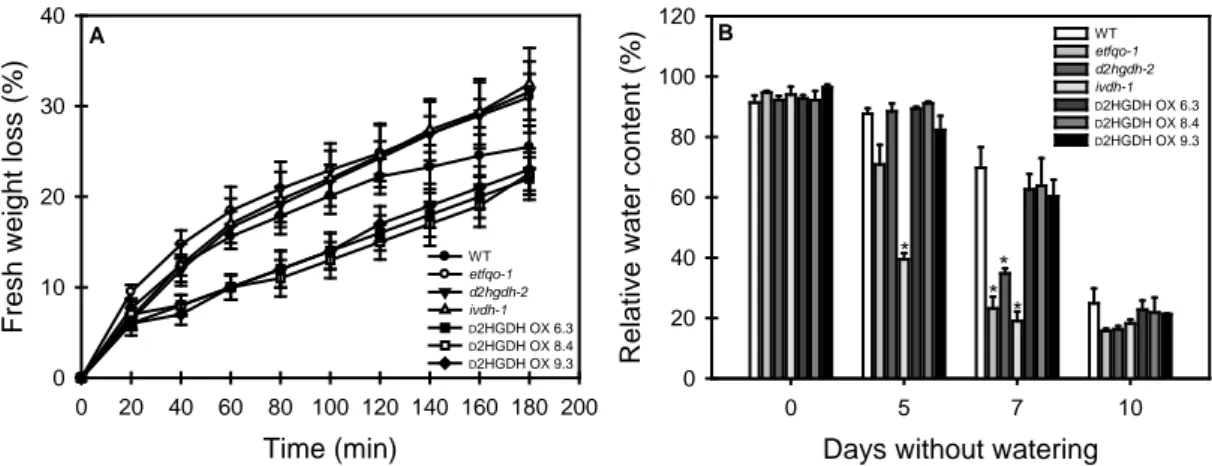
wild type (WT) background plants were cultivated under long-day conditions (16 h light/8 h dark) and did not show any aberrant phenotype during vegetative growth prior to the imposition of water deficit (Figure 5A). After the suspension of the irrigation, all phenotypes showed senescence symptoms, although it should be mention that clear differences were observed. The etfqo-1, d2hgdh-2 and ivdh-1 mutant plants began to show symptoms of chlorosis and leaf wilting four-to-five days after the onset of water deficit. By contrast, dehydration symptoms in both WT and OE lines (D2HGDH OX 6.3, D2HGDH OX 8.4 and D2HGDH OX 9.3) began to become visible six-to-seven days without watering (Figure 5B). Interestingly at the end of the water deficit period (10 days without water), almost all KO mutant plants were either dead or completely dehydrated showing severe leaf necrosis, while both WT and OE lines presented higher survival rates, though showing intense signs of dehydration (Figure 5C).
mutants showed smaller values of RWC (19-34%) significantly different from those observed in the WT and OE lines (60-69%). At the end of the treatment (10 days), all genotypes showed similar RWC values (15-24%). Accordingly decreases in RWC during the experimental period were compatible with the progressive phenotype alterations observed.
Figure 5. Phenotype of Arabidopsis mutants and wild type plants (WT) under
Figure 6. Fresh weight loss from detached leaves (A) and relative water content (B)
of leaves of 4-week-old, long-day-grown, Arabidopsis plants after further treatment for 0, 5, 7 and 10 days without watering. Values are means ± SE of six independent samplings; an asterisk indicates values that were determined by the Student's t test to be significantly different (P < 0.05) from the wild type (WT)
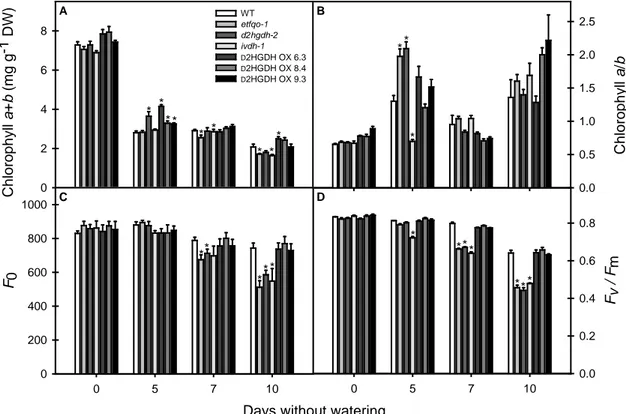
In order to next evaluate senescence mechanisms, some parameters related to the function of chloroplasts and commonly associated with the diagnosis of leaf senescence were assessed (Oh et al., 1996). More specifically, chlorophyll contents and maximum photochemical efficiency of PSII (Fv/Fm) were evaluated. After
irrigation cessation, total chlorophyll content (a+b) decreased more rapidly in KO mutants in comparison to both WT and OE lines (Figure 7A). Interestingly a trend for increased chlorophyll a/b ratio was observed during the first days without watering, followed by drop after five days, and a new increase at the end of the experiment (Figure 7B). Such increments in chlorophyll a/b ratio are a typical characteristic associated with chlorophyll degradation in Arabidopsis plants under senescence conditions (Pruzinská et al., 2005). Reductions in F0 values were also
observed, especially in KO mutants over the experimental period (Figure 7C). Moreover, a dramatic decrease in Fv/Fm values was observed after five days without
watering in ivdh-1 and after seven days in d2hgdh-2 and etfqo-1 mutants (Figure 5D). On the other hand, Fv/Fm values in the WT and OE lines remained practically
constant over almost all the experiment showing decreases only after 10 days without watering (Figure 7D). When taken together, these results indicate that etfqo-1, d2hgdh-2 and ivdh-1 mutants are likely more sensitive to water deficit than the WT
and OE lines, and that alternative pathways of respiration and that more specifically
Days without watering
0 5 7 10
R e lat iv e w a te r c on te nt (% ) 0 20 40 60 80 100 120 WT etfqo-1 d2hgdh-2 ivdh-1 D2HGDH OX 6.3
D2HGDH OX 8.4
D2HGDH OX 9.3
* * * * B Time (min)
0 20 40 60 80 100 120 140 160 180 200
F re s h w eigh t lo s s (% ) 0 10 20 30 40 WT etfqo-1 d2hgdh-2 ivdh-1 D2HGDH OX 6.3
D2HGDH OX 8.4
D2HGDH OX 9.3
ETFQO, IVDH and D2HGDH seems to play a significant role in drought-tolerance
mechanisms in Arabidopsis.
Figure 7. Total chlorophyll content (A), chlorophyll a/b ratio (B), initial
fluorescence, F0 (C) and Fv/Fm (D), the maximum quantum yield of PSII electron
transport, of leaves of 4-week-old, long-day-grown, Arabidopsis plants after further treatment for 0, 5, 7 and 10 days without watering. Values are means ± SE of six independent samplings; an asterisk indicates values that were determined by the Student's t test to be significantly different (P < 0.05) from the wild type (WT). DW, dry weight
4.2. Phenotype of Arabidopsis mutants after irrigation recovery
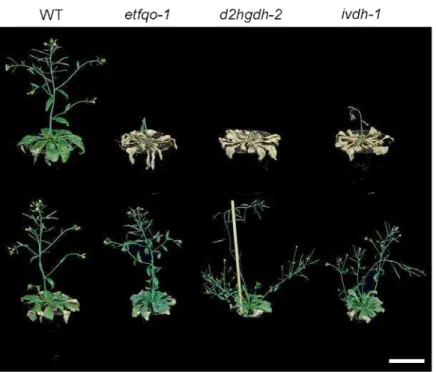
In order to assess plant recovery capacity the irrigation was restored 10 days after the onset of water deficit. Accordingly it was observed that both WT plants and OE lines were able to recover both vegetative and reproductive growth, while KO mutants did not show any sign of recovery, even after a further five-days irrigation, prevailing among these lines characteristics of senescence, such as intense dehydration and necrosis (Figure 8).
C h loro ph y ll a + b ( m g g
-1 D
W) 0 2 4 6 8
0 5 7 10
Fv / F m 0.0 0.2 0.4 0.6 0.8 WT etfqo-1 d2hgdh-2 ivdh-1
D2HGDH OX 6.3
D2HGDH OX 8.4
D2HGDH OX 9.3
* ** * *** D * * * * A C h loro ph y ll a /b 0.0 0.5 1.0 1.5 2.0 2.5 B * * *
Days without watering
0 5 7 10
Figure 8. Phenotype of 6-week-old, long-day-grown Arabidopsis mutants and wild
type plants (WT) 5 days after re-watering. Scale bar represents 5 cm
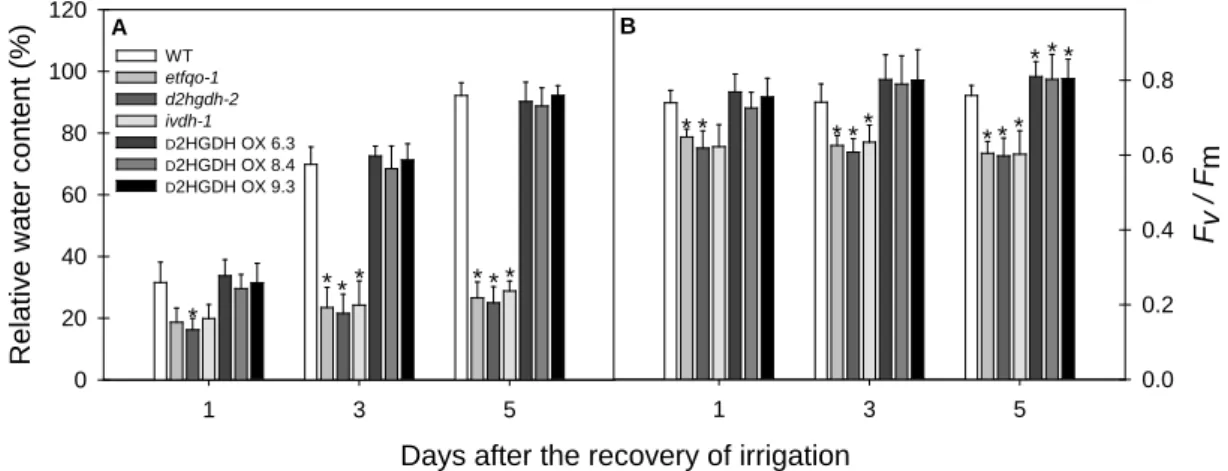
Increments of RWC were observed at three (68-72%) and five (88-92%) days after the reestablishment of the irrigation only in WT plants and OE lines. In contrast, all KO genotypes showed smaller RWC values (25-29%) after five days of recovery, differing significantly from the values observed in both WT plants and OE lines (Figure 9A). Similarly, WT and OE lines were able to recover Fv/Fm values
(Figure 9B) observed at the beginning of the experiment (day 0, non-stress condition, Figure 7D), indicating that the water availably was enough to fully recover the photosynthetic machinery in those plants. Although after irrigation restoration KO mutants showed Fv/Fm values higher than the ones observed at the end of water
Figure 9. Relative water content (A) and the maximum quantum yield of PSII
electron transport, Fv/Fm (B) of leaves of 6-week-old, long-day-grown, Arabidopsis
plants after further treatment for 1, 3 and 5 days after re-watering. Values are means ± SE of six independent samplings; an asterisk indicates values that were determined by the Student's t test to be significantly different (P < 0.05) from the wild type (WT)
4.3. Metabolic characterization of Arabidopsis mutants under water deficit
conditions
It is important to mention that all genotypes used in this study showed similar levels of total soluble proteins (Figure 10A), total amino acids (Figure 10B), nitrate (Figure 10C), and starch (Figure 10D) in samples harvested immediately prior to the start of the drought treatment (day 0), indicating that silencing of etfqo-1, d2hgdh-2 and ivdh-1 mutants has minor, if any, impact on leaf primary metabolism of these plants under non-stress conditions. However, five days without irrigation culminated in decreases of over 55% of protein contents in all genotypes (Figure 10A). Significant increases in the levels of total amino acids were observed after 10 days without watering in KO mutants in comparison with the WT and OE lines (Figure 10B). Interestingly nitrate (Figure 10C) and starch (Figure 10D) levels were significantly reduced over the experimental period, mainly in KO mutants. After 10 days without watering a dramatic decrease in starch content in all genotypes was observed; more specifically, starch was not found in d2hgdh-2 and ivdh-1 mutants after 10 days without watering (Figure 10D).
Days after the recovery of irrigation
1 3 5
R e lat iv e w a te r c on te nt (% ) 0 20 40 60 80 100 120
1 3 5
Fv / F m 0.0 0.2 0.4 0.6 0.8 WT etfqo-1 d2hgdh-2 ivdh-1
D2HGDH OX 6.3
D2HGDH OX 8.4
D2HGDH OX 9.3
Figure 10. Protein (A), amino acids (B), nitrate (C) and starch content (D) of leaves
of 4-week-old, long-day-grown Arabidopsis plants after further treatment for 0, 5, 7 and 10 days without watering. Values are means ± SE of six independent samplings; an asterisk indicates values that were determined by the Student's t test to be significantly different (P < 0.05) from the wild type (WT). DW, dry weight
Metabolic regulation is one of the main mechanisms involved in the maintenance of osmotic potential under water deficit (Bowne et al., 2012). Thus, an established GC-MS protocol for metabolite profiling (Lisec et al., 2006) was used allowing simultaneous identification and quantification of a total of 50 metabolites in KO mutants and WT plants, including 21 amino acids, 9 sugars, 13 organic acids, 5 sugar alcohols, 2 polyamines, and 1 fatty acid. Results obtained are summarized and displayed in false color as a heat map (Figure 11) in order to provide an easy overview of the metabolic changes and the relative values of specific metabolites were presented in Figure 12-14. The full data set is additionally provided as Supplemental Table S2.
In response to the imposed treatments, considerable changes in the levels of a wide range of organic acids, amino acids, and sugar were evident. Thus, the levels of most amino acids increased significantly, particularly after 10 days without watering
Days without watering
0 5 7 10
S ta rc h ( µ mo l g
-1 D
W) 0 20 40 60 80 D * * *
0 5 7 10
N it ra te ( µ mo l g
-1 D
W) 0 20 40 60 80 100 C * ** * ** A min o ac id s ( µ mo l g
-1 D
W) 0 20 40 60 200 300 400 B * * * * P rot e in (mg g
-1 D
W) 0 20 40 80 WT etfqo-1 d2hgdh-2 ivdh-1
D2HGDH OX 6.3
D2HGDH OX 8.4
(Figure 12). The main differences were observed in the levels of aromatic amino acids (phenylalanine and tryptophan) and BCAA (isoleucine, leucine, and valine). The KO mutants showed significant increases in comparison to WT starting values in the levels of isoleucine (143-194 x-fold), leucine (136-186 x-fold) and valine (63-84 x-fold), as well as in the levels of GABA (82-84 x-fold), lysine (109-121 x-fold), and proline (~13 x-fold) after 10 days without water. Moreover, significant increases in the levels of alanine (~47 x-fold), phenylalanine (182-103 x-fold), ornithine (23-28 x-fold), and tryptophan (60-80 x-fold) were verified in d2hgdh-2 and ivdh-1. By contrast, mild increases in the levels of glutamate (in all KO lines) and aspartate (etfqo-1 and ivdh-1) were observed.
Figure 11. Heat map of metabolite levels in Arabidopsis knockout mutants etfqo-1,
d2hgdh-2 and ivdh-1, and wild type plants (WT) after further treatment for 0, 5 and
Drought conditions also promoted significant increases in the levels of sugars from different classes (Figure 13). After five days without irrigation KO mutants plants showed significant increases in the levels of fructose (2.7-5 x-fold), galactose (2.5-2.9 fold), glucose (2.3-6 fold), mannose (1.5-2 fold), and ribose (2-2.8 x-fold). Moreover, after 10 days without watering it was verified significant increases in the levels of glucose (15-19 x-fold) in all KO mutants, fructose (~33 x-fold), maltose (3.6-4.2 x-fold), and ribose (24-33 x-fold) in etfqo-1 and ivdh-1, mannose (7.4-8 x-fold) in etfqo-1 and ivdh-1, as well as galactose (~10 x-fold) only in etfqo-1. Even though some values were higher than the ones observed at day 0, at the end of the experiment significantly lower values were observed in the levels of trehalose (only in ivdh-1), in comparison with the values found for WT plants (Figure 13).
Significant increases were found in the levels of organic acids (Figure 13). Regarding TCA cycle intermediates, levels of cis-aconitate (3-6 x-fold) and isocitrate (2.8-3.2 x-fold) were significantly increased in all KO mutants after five days without watering, while fumarate (3.5-5 x-fold) were significantly increased only in etfqo-1 and ivdh-1. In addition, the levels of 2-oxoglutarate (6-7.7 x-fold), citrate
0 5 10 0 20 40 60 80 0 2 4 6 8 10 12 14 0 10 20 30 0 50 100 150 200 0 5 10 15 20 25 0 20 40 60 80 100
0 5 10
0 2 4 6 8
Days without watering
0 5 10
0 20 40 60 80 0 2 4 6 8 10 12 14 0 20 40 60 80 100 0 20 40 60 80 100 120 Re la ti v e v al u e s 0 10 20 30 40 0 20 40 60 80 0 10 20 30 0 50 100 150 200 0 1 2 3 4 * * * * * * * 0 10 20 30 40
50 WT etfqo-1
d2hgdh-2 ivdh-1 Alanine GABA * 0.0 0.5 1.0 1.5 2.0 2.5 Aspartate Glutamate * * * Glutamine * * * * Ornithine Guanidine * * Isoleucine * * * * * Lysine * * Methionine * * Phenylalanine * * Proline Threonine * * Serine * Tryptophan * Valine * * * * * * Leucine * * * β-Alanine * * * * * * * * * * * * * * * * * * * * * * * * *
Figure 12. Relative levels of amino acids in Arabidopsis knockout mutants etfqo-1,
d2hgdh-2 and ivdh-1, and wild type plants (WT) after further treatment for 0, 5 and
Figure 13. Relative levels of sugars and organic acids in Arabidopsis knockout
mutants etfqo-1, d2hgdh-2 and ivdh-1, and wild type plants (WT) after further treatment for 0, 5 and 10 days without watering as measured by GC-MS. Levels of the indicated sugars and organic acids are presented as in Figure 12
Days without watering
0 5 10
0 5 10 15 20 0 2 4 6 8 0 5 10 15 20 25 0 10 20 30
0 5 10
0 2 4 6 8 10 12 14 0 5 10 15 20 250 10 20 30 40 Re la ti v e v al u e s 0 10 20 30 40 50 0 5 10 15 20
0 5 10
0 2 4 6 8 10 12 14 0 1 2 3 4 5 0 2 4 6 8 0 2 4 6 8 10 12 14 0 2 4 6 8 10 0 2 4 6 0 2 4 6 8 0 10 20 30 WT etfqo-1 d2hgdh-2 ivdh-1 Fructose * * * * 0 2 4 6 8 10 12 Galactose * * * Glucose * * * * * Mannose * * * * * Raffinose Sucrose * Trehalose * 2-oxoglutarate Citrate * * Fumarate * * * Glycolate * * Isocitrate * * * * * Malate *
* Succinate *
Figure 14. Relative levels of sugar alcohols and polyamines in Arabidopsis knockout
mutants etfqo-1, d2hgdh-2 and ivdh-1, and wild type plants (WT) after further treatment for 0, 5 and 10 days without watering as measured by GC-MS. Levels of the indicated sugar alcohols and polyamines are presented as in Figure 12
Analyzing the metabolite profiling of OE lines the identification and quantification of a total of 47 metabolites, including 18 amino acids, 10 sugars, 11 organic acids, 5 sugar alcohols, 2 polyamines, and 1 fatty acid were possible. The data obtained are summarized and displayed in false color as a heat map (Figure 15) in order to provide an easy overview and the relative values of specific metabolites were presented in Figure 16-18. The full data set is additionally provided as Supplemental Table S3.
The levels of most of metabolites were increased 10 days after the irrigation suspension in OE lines. It should be mention, however, that the extension of changes in those lines was clearly lower than those observed in KO mutants. Moreover, a clear pattern of down regulation of levels of some metabolites in those lines (Figure 15) in comparison to those pattern verified in KO mutants (Figure 11) was clearly observed.
The OE lines showed significant increases in the levels of aspartate (1.3-3.2 x-fold), GABA (86-94 x-fold), guanidine (4-5.7 x-fold), ornithine (20-25 x-fold), proline (15-18 x-fold), threonine (7-8.4 x-fold), tryptophan (9-21 x-fold), and valine (87-104 x-fold). Significant increased levels of some sugars, such as maltose (2.6-4.4 x-fold), raffinose (14-20 x-fold), and sucrose (7.8-9.6 x-fold) were also observed in
Days without watering
0 5 10
0 10 20 30 40
0 5 10
0 20 40 60
0 5 10
Re la ti v e v al u e s 0 10 20 30 0 20 40 60 80 WT etfqo-1 ivdh-1 d2hgdh-2 Erythritol * 0 5 10 15 20 25
30 Glycerol *
all OE lines, while the levels of trehalose decreased at the end of experiment (Figure 17).
Figure 15. Heat map of metabolite levels in Arabidopsis overexpressor lines
D2HGDH OX 6.3, 8.4 and 9.3, and wild type plants (WT) after further treatment for 0, 5 and 10 days without watering as measured by GC-MS. Red colors represent increase in metabolite levels; blue colors highlight decreases using a false-color scale. Values are means of six independent samplings and are representative of the log2-transformed values
polyamines, such as putrescine (28-34 x-fold) and spermidine (31-36 x-fold) (Figure 18).
Figure 16. Relative levels of amino acids in Arabidopsis overexpressor lines
D2HGDH OX 6.3, 8.4 and 9.3, and wild type plants (WT) after further treatment for 0, 5 and 10 days without watering as measured by GC-MS. Levels of the indicated amino acids are presented as in Figure 12
0 5 10
0 20 40 60 80 100 0 10 20 30 40 50 0 5 10 15 20 25
0 5 10
0 2 4 6 8
Days without watering
0 5 10
0 5 10 15 20 0 5 10 15 20 0 20 40 60 80 0 20 40 60 Re la ti v e v al u e s 0 2 4 6 0 20 40 60 80 100 0 20 40 60 80 100 120 0 2 4 6 0 10 20 30 0 20 40 60 80 100 0 1 2 3 * * * * * * * 0 10 20 30 40 50 60 WT
D2HGDH OX 6.3
D2HGDH OX 8.4
D2HGDH OX 9.3 Alanine GABA * 0 1 2 3 4 Aspartate Glutamate * * * Glutamine Ornithine Guanidine * * Isoleucine * Lysine Methionine * * Phenylalanine * * Proline * * Threonine Serine * * * Tryptophan * Valine * * * Leucine * * * * 0 20 40 60 80
100 β-Alanine
Figure 17. Relative levels of sugars and organic acids in Arabidopsis overexpressor
lines D2HGDH OX 6.3, 8.4 and 9.3, and wild type plants (WT) after further treatment for 0, 5 and 10 days without watering as measured by GC-MS. Levels of the indicated amino acids are presented as in Figure 12
0 5 10
0 5 10 15 20 25 30 0 2 4 6 8 10 12 14 0 20 40 60 Re la ti v e v al u e s 0 5 10 15 20 0 5 10 15
0 5 10
0 2 4 6 8 10 12
Days without watering
0 5 10
0 5 10 15 20 25 30 0 2 4 6 8 0 2 4 6 8 10 12 14 16 0.0 0.5 1.0 1.5 2.0 2.5 0 2 4 6 8 10 0 2 4 6 8 10 0 2 4 6 8 10 0 2 4 6 8 0 5 10 15 0 1 2 3 4 0 5 10 15 20 25 WT
D2HGDH OX 6.3
D2HGDH OX 8.4
D2HGDH OX 9.3
Fructose * 0 10 20 30 40 Galactose * Glucose * * * Maltose * * * Mannose * * Ribose * Sucrose Trehalose cis-Aconitate * * Dehydroascorbate * * * Fumarate * * Glycolate * * * Isocitrate *
* Malate Succinate
Figure 18. Relative levels of sugar alcohols and polyamines in Arabidopsis
overexpressor lines D2HGDH OX 6.3, 8.4 and 9.3, and wild type plants (WT) after further treatment for 0, 5 and 10 days without watering as measured by GC-MS. Levels of the indicated amino acids are presented as in Figure 12
4.4. Gene expression of Arabidopsis mutants under water deficit conditions
In order to evaluate changes in the gene expression at the beginning of the experiment and after withholding water for 5 and 10 days, the expression of selected genes of KO mutants and WT plants was also determined (Figures 19 and 20). First, a down regulation of photorespiration related genes, such as 2-phosphoglycolate phosphatase 1 (PGLP1) and both serine hydroxymethyl transferase 1 (SHMT1) and 2 (SHMT2) was observed. More specifically, transcript levels of SHMT1 and SHMT2 were not detected after 10 days without watering in all genotypes. Moreover, a dramatic decrease of expression of genes related to oxidative stress alleviation (peroxissomal catalase 2, CAT2), photosynthesis (rubisco activase, RCA), alternative respiration pathways (uncoupling protein, UCP), and metabolism of nitrogen and amino acids (ferredoxin-dependent glutamate synthase, Fd-GOGAT; glutamate dehydrogenase 1, GDH1; and glutamine synthetase, GS) was observed. Taken together, these results are in good agreement with the unexpected low levels of photorespiratory encoding genes observed in the present study. Additionally, minor changes in the expression of TCA cycle related genes, such as malate dehydrogenase
Days without watering
0 5 10
0 10 20 30
0 5 10
0 10 20 30 40
0 5 10
Re la ti v e v al u e s 0 5 10 15 20 25 0 5 10 15 20 WT
D2HGDH OX 6.3
D2HGDH OX 8.4
D2HGDH OX 9.3
(MDH) and fumarase 1 (FUM1) were observed, most likely to maintain respiratory rates at adequate levels under drought.
Figure 19. Transcript levels of genes related to amino acids metabolism,
photorespiration and TCA cycle in Arabidopsis knockout mutants etfqo-1, d2hgdh-2 and ivdh-1, and wild type plants (WT) after further treatment for 0, 5 and 10 days without watering as quantified by qRT-PCR. The y-axis values represent the transcript level to the wild type. Values are means ± SE of six independent samplings; an asterisk indicates values that were determined by the Student's t test to be significantly different (P < 0.05) from the wild type
0 5 10
0.0 0.5 1.0 1.5 2.0 2.5 0.0 0.5 1.0 1.5 0.0 0.5 1.0 1.5 2.0 2.5
Days without watering
0 5 10
0.0 0.5 1.0 1.5
0 5 10
0.0 0.5 1.0 1.5 2.0 0 1 2 3 4 Fo ld Cha n ge 0 2 4 6 0.0 0.5 1.0 1.5 2.0 0.0 0.5 1.0 1.5 2.0 0.0 0.5 1.0 1.5 0.0 0.5 1.0 1.5 0.0 0.5 1.0 1.5 2.0 2.5 * * * * * 0.0 0.5 1.0 1.5 2.0
2.5 WT etfqo-1