www.atmos-chem-phys.net/11/227/2011/ doi:10.5194/acp-11-227-2011
© Author(s) 2011. CC Attribution 3.0 License.
Chemistry
and Physics
Tracer concentration profiles measured in central London as part of
the REPARTEE campaign
D. Martin1,*, K. F. Petersson1, I. R. White1, S. J. Henshaw1, G. Nickless1, A. Lovelock1, J. F. Barlow2, T. Dunbar2, C. R. Wood2, and D. E. Shallcross1
1School of Chemistry, University of Bristol, Cantock’s Close, Bristol, BS8 1TS, UK 2Department of Meteorology, University of Reading, Reading, RG6 6BB, UK
*now at: Centre for Climate and Air Pollution Studies, National University of Ireland Galway, Galway, Ireland
Received: 30 September 2009 – Published in Atmos. Chem. Phys. Discuss.: 25 November 2009 Revised: 30 November 2010 – Accepted: 7 December 2010 – Published: 12 January 2011
Abstract.There have been relatively few tracer experiments carried out that have looked at vertical plume spread in urban areas. In this paper we present results from two tracer (cyclic perfluorocarbon) experiments carried out in 2006 and 2007 in central London centred on the BT Tower as part of the REPARTEE (Regent’s Park and Tower Environmental Ex-periment) campaign. The height of the tower gives a unique opportunity to study vertical dispersion profiles and transport times in central London. Vertical gradients are contrasted with the relevant Pasquill stability classes. Estimation of lat-eral advection and vertical mixing times are made and com-pared with previous measurements. Data are then comcom-pared with a simple operational dispersion model and contrasted with data taken in central London as part of the DAPPLE campaign. This correlates dosage with non-dimensionalised distance from source. Such analyses illustrate the feasibil-ity of the use of these empirical correlations over these pre-scribed distances in central London.
1 Introduction
There have many been many atmospheric tracer experiments carried out in urban areas (Hanna et al., 2003; Venkatram et al., 2004) which have focused on the horizontal spread and/or the along-wind spread of the plume. There have been relatively few investigations into the vertical plume spread, in the main because of the feasibility of making measure-ments away from the surface. The tracer experimeasure-ments
under-Correspondence to:D. Martin]
(d.martin@bris.ac.uk)
taken here complement the experiments undertaken during the CityFlux campaign in central Manchester, United King-dom (UK), which also focused on vertical tracer gradients in urban areas (Petersson et al., 2010).
In urban areas the URGENT (URbanRegeneration and the
ENvironmenT) campaign undertaken in Birmingham, UK, 1999–2000, was probably the first tracer experiment con-ducted to publish results concerning vertical concentration profiles in an urban area. Here a uniform vertical profile was found in a 20 m deep street canyon around one kilometre away from the source (Cooke et al., 2000). The results were compared with the ADMS3 model developed by CERC and there was good agreement (Britter, 2002). Similar results were found during the BUBBLE (Basel UrBan Boundary-Layer Experiment) tracer experiments in Basel, Switzerland. Here a uniform vertical profile was found in a 17 m deep street canyon, 700 m away from the source. In these experi-ments, three receptors were utilised: one at ground level, one at 10 m and one at a roof level of 17 m (Rotach et al., 2004). The most extensive set of tracer experiments regarding vertical dispersion was undertaken in Oklahoma City during the Joint Urban 2003 campaign. An instrumented crane sys-tem was developed and receptors were placed approximately every 5 m from about 10 m to up to 75 m (7 receptors in total). The sampling crane was placed approximately 1000 m away from the SF6release site (Flaherty et al., 2007). A total of
revealed only a slight difference, though a less uniform pro-file was seen during night-time indicating that convective mixing is important for dispersion (Flaherty et al., 2007). During the Joint Urban 2003 campaign, one experiment was also carried out where the source-receptor distance was only 500 m. Here, a distinct vertical concentration profile was re-vealed where the 75-m receptor measured one quarter to one half of the maximum concentration that tended to be nearer the ground than when source receptor distance was 1000 me-tres (Flaherty et al., 2007). This highlights the dependence of vertical concentration profiles on distances downstream. Five experiments investigating vertical dispersion were also undertaken in the early-to-mid twentieth century. Here, more disparate tracers such as smoke at Porton Down, UK, 1923– 1924, (Pasquill, 1974), sulphur dioxide during Prairie Grass (Nieuwstadt and van Ulden, 1978) and zinc cadmium sul-phide during Green Glow (Barad and Fuquay, 1961) were used. The data-set most extensively used for evaluating ver-tical concentration profiles has been the Prairie Grass dataset. One complication with this dataset though is the use of sul-phur dioxide as a tracer which is known to undergo dry and wet deposition. The deposition needs to be taken into ac-count when analysing these data (Britter and Hanna, 2003). As well as field studies there have been laboratory and wind tunnel studies which have attempted to characterise verti-cal dispersion in the turbulent boundary layer (Robins et al., 2001; Briggs et al., 2001; Britter et al., 2003).
The present paper presents data from tracer experiments completed during two campaigns in 2006 and 2007 of the REPARTEE (the REgent’s PARk and Tower Environmen-tal Experiment) project in central London, UK. The source-receptor distances ranged between 500 and 1000 m, with the highest receptor at 190 m, which allowed better determina-tion of the dependence of the concentradetermina-tion profile on height. Accompanying Doppler lidar measurements elucidated the turbulent structure of the boundary layer.
2 Experimental
2.1 Site description (building morphology)
The BT Tower (51.3117 N, 0.1389 W) is located in Fitzrovia in central London (see Fig. 1). The main structure is 177-m tall with a further section of lattice tower bringing the height up to 190 m. It has had grade-2 listed building sta-tus since 2003. The experimental area consists of densely packed mixed residential and commercial buildings with 4– 5 storeys. Buildings within 250 m of the nearby DAPPLE project site (Wood et al., 2009) have a mean height of 21 m and a maximum height of approximately 50 m.
(a)
(b)
Fig. 1. (a)Experimental setup for the REPARTEE I. Source loca-tions: A Receptor localoca-tions: 1 to 10. Note: receptors 3 to 5 located at heights 1.5 m, 160 and 190 m on BT Tower. (b)Experimental setup for the REPARTEE II. Source locations: B and C Receptor locations: 1 to 10. Note: receptors 3 to 5 located at heights 1.5 m, 160 and 190 m on BT Tower.
2.2 Tracers (technique, layout, source-receptor distances)
2.2.1 Technique
Table 1a.Experimental details for REPARTEE I.
REPARTEE I
Receptor and Release positions
A (release)
1 2 3 4 5 6
Position or Intersection of North Row and Balder-ton Street
Great Port-land St & Langham St
Cleveland St & Clipstone Mews
BT Tower, ground level
BT Tower, 160 m
BT Tower, 190 m
Cleveland St & Fo-ley St
GPS coordinates 51.5137 0.152467
51.5189 N 0.1422 W
51.5225 N 0.1411 W
51.5214 N 0.1389 W
51.5214 N 0.1389 W
51.5214 N 0.1389 W
51.5202 N 0.1384 W
Approximate distance from release position (m)
NA 920 1240 1270 1280 1280 1230
Angle from release postion (◦from N)
NA 229 218 226 226 226 231
Distance above ground (m) 0.36 1.5 1.5 1.5 150 190 1.5
2.2.2 Release
Cyclic perfluoroalkanes were obtained as pure liquids (F2 chemicals Ltd., Lancashire, UK) and gravimetric dilutions of Perfluoromethylcyclopentane (PMCP) and Perfluoromethyl-cyclohexane (PMCH) were prepared (Linde Gases Ltd., UK). Release gases were prepared at appropriate gaseous concentrations (PMCP 4%, PMCH 1.5%, and PDMCH 0.25%) in air with certification accuracy of±2%. The release apparatus consisted of stainless steel 15 litre silica lined can-ister (Restek Ltd., Bellefonte, PA, USA). A specialist soft-ware programme, READ30, which is supplied by the man-ufacturer, monitors the output from the pressure transmitter. Temperature dependencies and non-linearity of the sensors are mathematically compensated for after the release (given the known air temperature). The gas flow rate was controlled by the use of a Flostat Flow Controller (Type MNBS12) (Roxspur Measurement and Control Ltd., Hampshire, UK). 2.2.3 Sampling
Samples were taken at each receptor position using an air-sampling pump (SKC Ltd., Dorset, UK) air-sampling at a flow rate of about 0.9 litres per minute and taking air from ap-proximately 1.5 m above ground level. Samples were col-lected in 10 litre Tedlar bags (SKC Ltd., Dorset, UK). The re-lease/sampling start time was synchronised for all release and receptor sites by the use of radio-controlled clocks. Physical isolation of the release and sampling teams was ensured at all times (before, during and after the experiment), in order to avoid contamination of the collected air samples.
2.2.4 Analysis
Table 1b.Experimental details for REPARTEE II.
REPARTEE II
Receptor and Release positions
B (release)
C (release)
1 2 3 4 5
Position or Intersection of Notingham Stret and Notingham Place Portland Place East Side of Fitzroy Street Fitzroy Street and Grafton way BT Tower, ground level BT Tower, 160 m BT Tower, 190 m
GPS coordinates 51.5214 N
0.1531 W 51.5216 N 0.1456 W 51.5243 N, 0.1407 W 51.5229 N, 0.1392 W 51.5215 N, 0.1389 W 51.5215 N, 0.1389 W 51.5215 N, 0.1389 W Approximate distance from release positions (m)
NA NA 910 (B)
460 (C) 980 (B) 470 (C) 980 (B) 460 (C) 980 (B) 460 (C) 980 (B) 460 (C)
Angle from release
postion (◦from N)
NA NA 248 (B)
226 (C) 258 (B) 249 (C) 267 (B) 270 (C) 267 (B) 270 (C) 267 (B) 270 (C) Distance above ground (m)
0.39 m 0.39 m 1.5 1.5 1.5 150 190
Receptor positions 6 7 8 9 10 11
Position or Intersection of Ogle Street North Great Titch-field Street Gilder Street Great Titch-field Street Cleveland Street and Warren St. Harley and Devonshire Street
GPS coordinates 51.5206 N,
0.1400 W 51.5186 N, 0.1406 W 51.5191 N, 0.1427 W 51.5216 N 0.1420 W 51.5235 N 0.1424 W 51.5217 N 0.1482 W Approximate distance from release positions (m)
910 (B) 400 (C) 930 (B) 480 (C) 770 (B) 340 (C) 770 (B) 260 (C) 790 (B) 330 (C) 350 (B) 170 (C)
Angle from release
postion (◦from N)
273 (B) 282 (C) 288 (B) 311 (C) 287 (B) 320 (C)
265 (B) 263 (C)
250 (B) 224 (C)
263 (B) 94 (C)
Distance above ground (m)
1.5 1.5 1.5 1.5 1.5 1.5
2.3 Experimental layout and source-receptor distances 2.3.1 REPARTEE I: 26 October 2006
An arc of four receptors with a vertical array of three centred on the BT Tower site (ground level, 160.3 m agl and 190 m a.g.l.) was positioned as outlined in Fig. 1a. The layout of these, along with the relevant source-receptor distances, is shown in Table 1a. The release of PMCP was made at the intersection of North Row and Balderton Street. The build-ings surrounding the release positions are mostly 4–5 storeys high. The release position was about 1300 m upwind of BT Tower. North Row is a one-way street: traffic flows towards the east along North Row. No access from Balderton Street onto Oxford Street is possible. Almost no traffic was ob-served on North Row or Balderton Street during the entire re-lease period. Tracer was rere-leased for 59 min between 13:50 and 14:49 UTC at a height of 0.36 m at an average release rate of 3.348±0.076×10⁻⁶kg s−1. Six samples were taken
at each sampling position according to the following scheme, allowing for one minute in between each sample in order to have time for personnel to change bags to the sampling pump [1: 13:50–13:59, 2: 14:00–14:09, 3: 14:10–14:19, 4: 14:20– 14:29, 5: 14:30–14:39, 6: 14:40–14:49]. Table 1 gives the distances from source to the receptor along with the bearing from north of the source with respect to the receptor.
2.3.2 REPARTEE II: 7 November 2007
3–5 refer to ground level, 160 m and 190 m at the tower re-spectively.
2.4 Meteorological measurements
Meteorological measurements were made at the top of the lattice tower on top of the BT Tower using a Gill ultra-sonic anemometer (R3-100 with symmetric head) sampling at 20 Hz. An automated weather station (V¨ais¨al¨a WXT510) was also attached to the lattice tower. The anemometer was clamped to an open lattice scaffolding tower of 12 m height, situated on top of the main building structure and resulting in a measurement height of 190 m. A secondary meteorolog-ical reference was mounted on the roof of the Westminster City Council (WCC) Library (51.5210◦N, 0.1605◦W, the roof and anemometer head heights were 15.5 m and 18.4 m respectively; see Barlow et al., 2009 and Wood et al., 2010). Doppler lidar (LIght Detection And Ranging) measure-ments were taken during the 2007 REPARTEE II campaign (Barlow et al., 2010). The instrument was a Halo Photon-ics 1.5 micron scanning Doppler lidar sited in the car-park of the University of Westminster on Marylebone Road (the Sal-ford Doppler lidar is part of the National Centre for spheric Science (NCAS) Facility for Ground-based Atmo-spheric Measurement (FGAM)). The instrument ran contin-uously from 24 October to 14 November 2007 including the 7 November when REPARTEE II tracer experiments were carried out. Due to the proximity and height of the neigh-bouring buildings, the lidar was restricted in its view of the sky, and in this paper only the vertical stare measurements are reported i.e. the lidar pointed directly upwards, measur-ing the vertical velocity component of turbulent mixmeasur-ing and aerosol backscatter to a height resolution of 30 m at a sam-pling rate of 0.25 Hz. One of the main advantages of using a high resolution remote sensing instrument such as a lidar was to provide turbulent profiles of the boundary layer along-side the tracer experiments, and to determine boundary layer depth.
3 Results and discussion
3.1 Meteorological results and lidar data
Shown in Table 3 are the anemometry measurements made during REPARTEE I and II. An extensive study of the re-lationship between the meteorology of the two reference anemometry sites was undertaken, studying the relationship between wind speeds measured at the BT Tower and the top of WCC as part of the DAPPLE project (Arnold et al., 2004; Barlow et al., 2009; Martin et al., 2010a, b). This showed a high degree of correlation between the measurements with the ratio of the mean values of BT Tower/WCC wind speeds being in the region of 4.1:1 over the whole year (although a slope of 5.7 is obtained when a linear regression is performed through 30-min means). The values of BT Tower/WCC wind
speed during the 2007 experiments were slightly higher than the annual average value but well within the range of mea-surements made and can be judged to be typical conditions. Shown in Fig. 2 are the lidar measurements (Barlow et al., 2010) for the REPARTEE II campaign.
The backscatter and velocity variance data from the li-dar were used to ascertain different heights relating to the boundary layer. The boundary-layer top was defined by the largest gradient in the backscatter found going from the top of the profile downwards; while the ground-based aerosol-layer depth was defined by the first exceedance of the thresh-old value of backscatter gradient (−4×10⁻⁹m−2sr−1) look-ing from the ground upwards. The mixlook-ing height was de-fined as the height up to which a threshold of vertical ve-locity variance σw2>0.1 m2s−2 was met. The 7 Novem-ber 2007 (REPARTEE II) was predominantly overcast due to a shallow layer of stratocumulus (shown by enhanced backscatter at approximately 1 km) and mean wind speed was above-average compared to the rest of the REPARTEE II campaign (7.4 m s−1). Weak daytime convective mixing
occurred throughout the whole boundary layer from c. 11:00 until 15:00, and was replaced by a ground-based turbulent layer, driven by wind shear. The large amount of cloud cover might suggest that there is little convection. However, the large values of vertical velocity variance throughout the cen-tral depth of the mixed layer, along with the characteristic profile (with a peak in vertical velocity variance near the boundary layer centre), is indicative of convectively-driven turbulence. Given the z/L values, it would seem that the boundary layer was weakly convective. Hence, compara-ble stability is assumed, classes C (slight incoming solar radiation, moderate wind speed) and D (overcast) accord-ing to Pasquill’s 10 stability classes. The neutral height scale (u∗/f )is of order 1 km, however there is evidence of the boundary-layer being weakly unstable since the sonic anemometer data showedz/Lvalues<−0.1.
3.2 Concentration-time profiles and general comments 3.2.1 REPARTEE I
Figure 3 shows the sequence of averaged 9-min concentra-tions at six receptor posiconcentra-tions for REPARTEE I. Values are plotted in the form of C/Q values, where C is the concen-tration in kg m−3at 20◦C and Q is the release rate in kg s−1. C/Q values for REPARTEE I and D/Q (where D is the dosage of gas accumulated over the sampling time, D (in kg m−3s)) values for REPARTEE II are shown in Table 2.
3.2.2 REPARTEE II
Fig. 2. Lidar measurements during REPARTEE II (all times UTC) showing the boundary layer top, top of the aerosol layer, vertical wind velocity and the convective layer mixing height.
0.0E+00 1.0E-06 2.0E-06 3.0E-06 4.0E-06
1 2 3 4 5 6
Sample No.
Receptor 1 Receptor 2 Receptor 3 Receptor 4 Receptor 5 Receptor 6
0.0E+00 5.0E-07 1.0E-06 1.5E-06 2.0E-06 2.5E-06
1 2 3 4 5 6
BT Tower (ground level) BT Tower (160M) BT Tower (190M)
Sample No.
Fig. 3. Time series of concentrations for REPARTEE I. The top panel shows the averaged 9 min values at all off the receptors while the bottom panel shows an expanded representation of the values from the BT Tower.
Tower for experiments 3, 4 and 5. The relative concentra-tions suggest that the plume centreline was south of the BT Tower for experiments 1 and 2, giving highest concentrations at receptor 8. This pattern is confirmed by receptors 1, 2, 3, 6, 7 – with higher concentrations at southern-most receptor 7 for earlier experiments, although the pattern is not so clear.
3.3 Vertical distribution and advection times 3.3.1 Vertical gradient
The dataset most extensively used for evaluating vertical con-centration profiles has been the Prairie Grass data set. One complication with these data though is the use of sulphur dioxide (noted previously) and that its deposition needs to be taken into account when analysing these data (Britter and Hanna, 2003). The results from the early-to-mid twentieth century experiments were later analysed in the main by com-paring the results with equation 1, which is a generalisation of the Gaussian plume model. The main aim has been to determine the shape exponents:
χ
Z χ0
=exp[−b(z z)
s
], (1)
whereχ is the concentration at an elevated (z) position and at ground level (0),bis constant andzis the average plume height. A value ofs=1 implies an exponential vertical pro-file ands=2 for a Gaussian vertical profile. Numerous wind-tunnel studies have been made in order to investigate verti-cal dispersion. A review of previous measurements showed values ofs that varied between 1.4 and 2.25 (Britter et al., 2003). One reference to unpublished data (Courtney, 1979 in Britter et al., 2003) showed thatsslightly decreased with downwind distance which is in excellent agreement with the results published here.
Table 2. Tracer data at various receptor positions (See Fig. 1 for location) during REPARTEE I and II. (NDFB- Non discernible from background).
REPARTEE I Background subtracted concentration/Release rate (108s/m3)
Sampling interval Receptor position
1 2 3 4 5 6
1 (13:50–13:59) 18.8 10.1 10.1 55.3 NDFB 4.21 2 (14:00–14:09) 190 101 72.5 279 11.9 82.9 3 (14:10–14:19) 95.9 25.3 17.5 242 3.5 17.9 4 (14:20–14:29) 192 70.7 54.0 184 75.0 135 5(14:30–14:39) 24.7 NDFB NDFB 5.8 27.0 60.4 6 (14:40–14:49) 0.799 NDFB NDFB 1.0 1.0 2.5
REPARTEE II Dosage divided by total release amount (10−7s/m3) for source B
Receptor Position
Exp. No. 1 2 3 4 5 6 7 8 9 10 11
1 NDFB 0.7 10.1 2.5 − 17.4 8.3 14.4 5.8 NDFB 5.0
2 NDFB NDFB 3.2 1.4 1.6 10.6 14.6 20.9 1.5 5.1 24.1
3 − 6.6 12.5 4.16 3.4 15.9 4.2 4.8 15.2 0.93 54.5
4 2.5 14.8 24.5 10.9 6.6 12.1 NDFB NDFB 33.7 1.7 119.2
5 6.3 27.1 18.7 6.8 3.0 12 0.3 0.4 41.7 NDFB 165.3
6 NDFB NDFB 2.7 0.25 0.7 10.9 25.8 7.61 0.41 NDFB 9.8
REPARTEE II Dosage divided by total release amount (10−7s/m3)for source C
Receptor Position
Exp. No. 1 2 3 4 5 6 7 8 9 10 11
1 NDFB NDFB 6.9 0.6 – 13.8 1.8 NDFB 1.5 NDFB NDFB
2 NDFB NDFB 4.1 NDFB NDFB 11.3 NDFB NDFB 0.8 NDFB NDFB
3 – 1.1 6.5 0.5 NDFB 9.9 NDFB NDFB 5.3 NDFB NDFB
4 NDFB 1.9 12.7 1.3 0.9 6.5 NDFB NDFB 10.7 NDFB NDFB
5 NDFB 3.7 10.9 1.5 1.4 4.9 NDFB NDFB 13.6 NDFB NDFB
6 NDFB NDFB 4.6 0.8 NDFB 11.3 1.9 NDFB NDFB NDFB NDFB
between wind speed and height, Equation 2) is greater com-pared with a plume that fills up more of the boundary layer (Hunt and Weber, 1979).
UZ=UR
Z
ZR
α
, (2)
The dependency of s on α has previously been discussed (Calder, 1949; Pasquill and Smith, 1983). Irwin demon-strates thatαincreases (and therefore also the shape expo-nent) with increasing surface roughness and atmospheric sta-bility (Irwin, 1979). Only the effect of atmospheric stabil-ity (based on the results from the Prairie Grass experiments) had been verified by experimental results before the present study.
It was concluded (Eliot, 1961) thats <2 (and closer to 1) for both the Green Glow and the Prairie Grass experiments respectively. Nieuwstadt and van Ulden (1978) concluded (based on the Prairie Grass experiments) that s ranges from 1 in unstable conditions, 1.3 in neutral conditions, and up
to 2 in stable conditions. In other words, they concluded that a Gaussian profile is only a suitable description during stable conditions. It should be noted that these values ofs
were determined for rural areas over relatively flat terrain, but in areas with higher surface roughness,s typically will be higher (as shown later).
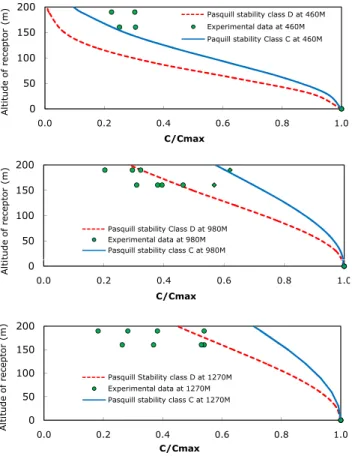
The vertical concentration profiles have been compared with the Gaussian plume equation and the results are shown in Fig. 5 for the vertical concentration profiles obtained at three different source-receptor distances used across both campaigns. The results from the experiments, where an obvi-ous elevation above background was seen, have been plotted. Note that the REPARTEE I data is averaged over 9 min and the REPARTEE II data is effectively averaged over 15 min. Due to the close proximity of source C (see Fig. 1b) to re-ceptor positions, i.e. 460 m, there was limited data for this regime as shown in Table 2.
0.0E+00 2.0E-07 4.0E-07 6.0E-07 8.0E-07 1.0E-06 1.2E-06
! " # $ %& # $ '%& # $
0.0E+00 4.0E-07 8.0E-07 1.2E-06 1.6E-06
( $
$ $ $ $
$ )
0.0E+00 1.0E-06 2.0E-06 3.0E-06 4.0E-06 5.0E-06 6.0E-06
*
! " # $ %& # $ '%& # $
0.0E+00 2.0E-06 4.0E-06 6.0E-06 8.0E-06
* ( $
$ $ $ $
$ )
0.0E+00 4.0E-07 8.0E-07 1.2E-06 1.6E-06 2.0E-06
( $
$ +
$ '
$ %
% #% % #% % #% % #% % #% ) % #% + % #%
, # $ 0.0E+00
1.6E-06 3.2E-06 4.8E-06 6.4E-06
* ( $
$ +
$ '
$ %
% % -%% % #%
Fig. 4.Time-series of concentration for REPARTEE II.
(Flaherty et al., 2007). From these experiments, it was noted that for the source-receptor distances of approximately 980mthe shape exponents is close to 2 (Gaussian profile), for distances shorter than 1000 m s is greater than 2 and for distances longer than 1000 m less than 2 (a shape in between Gaussian and exponential).
Surface roughness is estimated to be comparable between the 2006 and 2007 campaigns as the wind direction was similar and the urban canopy is reasonably homogeneous. The campaigns were conducted at the same time of the year (26 October 2006 compared with 7 November 2007) and all of the experiments took place during overcast conditions with moderate to strong winds (mean wind speed 12.0 and
7.4 m s−1respectively for 2006 and 2007. It should be noted
Table 3. Meteorological measurements made during REPARTEE I and II. Calculations of wind speed and direction are calculated from a sonic anemometer using double-rotation streamwise analysis (for full details see Wood et al., 2009; Wood et al., 2010).
REPARTEE I Meteorological data
Sample No. BT Tower (190 m)a(51.3117 N, 0.1389 W) WCC Library (18.4 m) (51.5210 N, 0.1605 W)
Wind dir (◦)b
Stdevb Wind
speed (ms−1)b
Stdevb Sensible
heat flux
(Wm−2)
Local stability parameter (z/L)
Wind dir (◦)
Stdev Wind
speed (ms−1)
Stdev
1 221 3 12.4 0.6 126 −0.39 235 31 3.9 2.5
2 219 5 10.2 1.8 20 −0.12 233 36 3.5 2.3
3 218 2 12.5 1.0 72 −0.34 243 48 3.1 2.6
4 223 2 13.0 1.2 40 −0.46 256 40 3.2 2.4
5 253 5 10.5 1.9 24 −0.16 254 40 3.0 2.0
6 253 2 14.4 1.0 36 −0.38 255 38 2.8 1.6
REPARTEE II Meteorological data
Exp. No. BT Tower (190 m) (51.3117 N, 0.1389 W) WCC Library (18.4 m) (51.5210 N, 0.1605 W)
Wind dir (◦)
Stdev Wind
speed (ms−1)b
Stdevb Sensible
heat flux
(Wm−2)
Local stability parameter ( z/L)
Wind dir (◦)
Stdev Wind
speed (ms−1)
Stdev
1 280 10 8.0 2.2 39 −0.27 272 60 1.7 1.6
2 285 9 8.9 2.3 33 −0.16 302 61 1.6 1.6
3 279 9 8.8 2.0 38 −0.16 264 51 1.7 1.6
4 272 8 8.1 1.7 28 −0.32 260 47 1.8 1.5
5 276 9 7.3 1.5 23 −0.31 261 47 1.4 1.2
6 287 8 7.0 1.6 13 −0.29 288 55 1.3 1.2
∗Wind directions are bearings from North. aanemometer was clamped to an open lattice scaffolding tower of 12 m height, situated on top of the main building structure and
resulting in a measurement height of 190 m.bwind direction, wind direction standard deviation, wind speed and wind speed standard deviation obtained from Vaisala WXT510 weather station 1Hz weather station.
3.3.2 Lateral advection and Vertical mixing times Given that tracer was detected by the first sample taken at 190 m (i.e. within the first 9 min) this gives a provisional (over-) estimate of the arrival time of 540 s. Previous theoret-ical studies (e.g. Chatwin, 1968) have been analyzed against data from plumes in the full-scale (e.g. lidar-detected smoke plumes in Mikkelsen et al., 2002) to show thatσz∼σy= au∗t (whereσy andσz is the puff size (laterally and
verti-cally respectively), i.e. standard deviation; andais 0.73). For our single point we getu∗t <230 m. Now, at the time of first sample (9 min) the plume was already of height greater than the BT Tower (190 m), but for comparison,σzis needed (i.e.,
less than the height of the plume); hence since the these two factors are acting in opposite directions, and in the interests of parsimony, we must estimateσzas the height of BT Tower
(190 m). Thus for our dataa≥0.83 which is comparable to the Mikkelsen et al. dataset.
The meteorological observations were also used to esti-mate the timescale for turbulent transport from the surface up to the BT Tower under different stability conditions, the method for which is fully reported in Barlow et al. (2010). A timescale which takes into account the integrated diffusivity
can be defined as:
τt(z)=γ ra(z)z, (3)
where z is the height up to which material is mixed, ra
is the effective aerodynamic resistance and γ is a coeffi-cient, initially assumed to be 1. By comparing the calcu-lated timescale for turbulent transport up to the BT Tower (i.e. z=190 m) with the observed value of 540 s from the REPARTEE I experiment, it was found that γ∼0.2. The transport timescale (τt) was then calculated for all periods
when meteorological data and lidar data were available dur-ing the REPARTEE II campaign. The median daytime value for the REPARTEE II campaign was 516s. Overall, using equation 3 with the empirically determinedγ value gave a near-neutral estimate of∼10 min for turbulent transport by diffusion up to the BT Tower increasing to ∼20 to 50 min for the occasional stable conditions observed during the cam-paign (Barlow et al. 2010).
3.4 Lateral distribution
!" #
$ $
$ %
!" # %
$ %
& '
!" # '
$ '
Fig. 5. Vertical gradient profiles for different source-receptor dis-tances: 460 m (Experiments 4 and 5, 2007 data), 980 m (Experi-ments 1–5, 2007 data); 1270 m (Samples 1–4, 2006 data). Values plotted are those closest to the plume centreline. Vertical profiles are deduced from Pasquill stability classes C and D using Briggs urban parameters.
(integrated 35 min samples). Fig. 6 shows receptor results based on release from position X for the arc furthest away from the sources, i.e. for receptors 1, 2, 3, 6 and 7. The ori-gin for the lateral distance has been located at the receptor measuring the highest concentration. A positive distance im-plies going southwards along the arc and a negative distance going northwards. Qualitatively, a Gaussian distribution in the lateral direction seems a reasonable approximation. The width of the plume for an individual experiment is compara-ble with the width of the Gaussian profile. The asymmetry of the profiles is caused by the limit in the number of recep-tors, since the receptor measuring the highest concentration is not perfectly on the plume centreline. The approximation of a lateral Gaussian profile (Pasquill stability class D using Briggs urban parameters) was also found to be valid during the BUBBLE experiments with source receptor distances of 700 and 1000 m (Rotach et al., 2004) as well as in a num-ber of other field experiments (e.g. Davidson et al., 1995 and Andr´en 1985).
!" # $ %
Fig. 6.Lateral concentration profiles during REPARTEE II. Results are displayed based on source X for the arc furthest away from the sources (910–980 m), i.e. for receptors 1, 2, 3, 6 and 7. The origin for the lateral distance has been located at has been located at the re-ceptor measuring the highest concentration. A positive distance im-plies going southwards along the arc and a negative distance going northwards. The lateral profile is calculated from Pasquill stability class D using Briggs urban parameters at 950 M.
3.5 Model evaluation
The dosage,D, is defined as the time-integrated concentra-tion,C, over an exposure period,T: the exposure period in this case is the sampling period and this has been selected to be sufficient for the whole emitted tracer-cloud to clear the experimental area, in which caseDis independent ofT. The dosage of gas accumulated over the sampling time, D (in kg m−3s), is made dimensionless by choosing appropriate velocity scales using the wind speed,UH (in m s−1), since
we focus on the neighbourhood scale, we expect the urban geometry to control the dispersion (Wood et al., 2009). It is then appropriate to choose the mean wind speed at mean roof level,UH, for a velocity scale and for these data we use
the WCC wind speed. SinceUH was a useful quantity for
analysed DAPPLE data (e.g. Wood et al., 2009), it was also deemed appropriate here since the distances involved are lit-tle beyond the near field (as one approaches far field, one might the dilution velocity expect the dilution velocityUdil
whereUdil(=σyσz/U) to become a more appropriate
veloc-ity scale; Venkatram et al., 2004).
This gives the natural dimensionless dosage as:
D=DUHH
2
M , (4)
whereM is total mass of tracer released (kg) and H is the mean building height (m).
These data are then plotted against distance from the source (x) normalised by H where q is the release rate (kg s−1):
DUHH2
q =K
H2
x2, (5)
! !"
# $ %& '
Fig. 7. Evaluation of simple correlation model based on experi-mental data from both REPARTEE and DAPPLE HO campaigns centred in London.
the chosen wind speed for the BT Tower experiments is the one obtained from measurements on top of Westminster City Council building in central London, UK; where the DAPPLE area is located. Data here are presented in conjunction with tracer data taken from central London measured during the DAPPLE campaign of 2007 campaign for reference (Wood et al., 2009) and allows the study of this relationship over longer distances than had been done previously in the UK and is in reasonable agreement with work carried out in the USA with data pooled from a number of tracer experiments carried out there (Hanna et al., 2007).
The DAPPLE field site is in Westminster, Central Lon-don, centred on the intersection of Marylebone Road and Gloucester Place, NW1. These experiments were multiple source dosage experiments from carried out over a number of different wind flow regimes. The correlation is shown in Fig. 7. The simple correlation model does reproduce the upper bound of the concentrations at distances up to 1 km as found here if an appropriate value of K is chosen. A value of K of 10 encompass almost all cases encountered here whereas a K of 20 may be used to encompass even the more specific cases when the tracer is channelled in a street canyon. It is worth highlighting at this point that the street network of this part of London is reasonably regular and there are thus long uninterrupted street canyons along which tracer can be channelled (Wood et al., 2009). At longer distances we would expect the effect of street channelling to be minimised, resulting in data falling below the lower bound beyond the near field; and this is indeed the case.
It can be argued that a more sophisticated treatment of data with relation to turbulence characteristics may provide a better bound for the data. Data from the DAPPLE site was studied using a number of screening models including the simple empirical correlation outlined here (Martin et al., 2010b). The other two models used knowledge of the wind profile, friction velocity, turbulence standard deviations and integral time scales in order to describe dispersion. These other screening models perform well although there are oc-casions (normally associated with downwind channelling) when they under-predict relevant concentrations. Data was
also compared to a street network model (Soulhac et al., 2001). This model represents the effects of local buildings and streets explicitly and is capable of providing detailed prediction of dispersion behaviour at short-to-medium range. The model is based on a street network concept, using street segments and intersections to represent the geometry, with tracer exchanges between streets taking place at the inter-sections. Performance was generally best for wind direc-tions approximately diagonal to the street axes (∼45o), while cases with wind directions almost parallel to the street axis gave results with larger uncertainties (Martin et al., 2010b).
This suggests that channelled downwind flow is the most difficult to describe and that, although simple, the simple em-pirical used model may be the best description of the data presented here. It is likely that the effect of channelling is reduced in urban tracer experiments in which the average building height is relatively small (e.g. just 4 m in Venka-tram et al., 2004) and where a more parameterized model with regard to turbulence might perform better. Of course, the use ofUdil (0.1–0.2 for our rooftop measurements)
in-stead of UHreduces the predicted concentrations: because
turbulent motions spread the plume laterally and vertically which slows the forward progression of the plume. How-ever, the use ofUdilis perhaps more appropriate beyond the
near field.
4 Conclusions
Novel experimental results were obtained from central Lon-don dispersion experiments as part of the REPARTEE cam-paign. Vertical tracer profiles up to 190 m using the BT Tower were obtained over horizontal distances of up to 1 km were elucidated using the controlled release of cyclic per-fluoroalkanes. Vertical profiles compare reasonably well with the relevant Pasquill stability classes (C and D) us-ing Briggs urban parameters, although it was noted that for source-receptor distances around 1000 m the shape exponent
sis close to 2 (Gaussian profile), for distances shorter than 1000 m s is greater than 2 and for distances longer than 1000 m less than 2 (a shape in between Gaussian and expo-nential).
Plume widths observed during REPARTEE II are well ap-proximated well by a Gaussian profile as was seen in a num-ber of previous dispersion experiments. Estimation of lat-eral advection time gives similar values to previous studies whilst the calculation of the vertical advection time gives a near neutral estimate of∼10 min for turbulent transport by diffusion up to the BT Tower.
non-dimensionalised straight-line distance from the source and this illustrates that the empirical upper bound derived from the DAPPLE dataset (K=10) can be extended out to longer range. This decay of downstream concentration is consistent with an inverse square relationship and the exten-sion of the relationship is useful in terms of emergency re-sponse planning (Hanna et al., 2007). The street channelling effect observed at shorter distances which resulted in exceed-ing in aK=10 fit was not observed over the longer distances measured here
Acknowledgements. We thank EPSRC, Bristol ChemLabS and the EC through a Marie-Curie Early Stage Training Network (BREATHE) for studentships (IRW, SJH and KFP) and the BOC foundation for funding various aspects of this work. In addition we express gratitude to the DAPPLE consortium for the provision of data as well as for the use of expertise and project resources including time, funds and personnel. Receptor volunteers were Frauke Pascheke, Helen Smethurst, Richard Mohan, Kimberley Bartholomew, Eddy Robertson, Thiuhadini Ngwana, Paul Hayden, Alex Archibald and Roisin Walsh.
Edited by: R. M. Harrison
References
Andr´en, A.: A combined first-order closure/Gaussian dispersion model. Atmos. Environ., 21, 1045–1058, 1987.
Arnold, S. J., ApSimon, H., Barlow, J., Belcher, S., Bell. M., Boddy, J. W., Britter, R., Cheng, R., Clark, R., Colville, R. N., Dim-itoulopolou, S., Dobre, A., Greally, B., Kaur, S., Knights, A., Lawton, T, Makepeace, A., Martin, D., Neophytou, M., Neville, S., Niewenhuilsen, M., Nickless, G., Price, C. S., Robins, A., Shallcross, D., Simmonds, P., Smalley, R. J., Tate, J., Tomlin, A. S., Wang, H., and Walsh, P.: Introduction to the DAPPLE Air Pollution Project, Sci. Total Environ., 332, 139–153, 2004. Barad, M. L. and Fuquay, J. J.: The Green Glow Diffusion Program,
Geophys. Res. Papers No. 73, Vols I and II, Geophys Res. Dir., Bedford, Mass., USA, 1961.
Barlow, J. F., Dobre, A., Smalley, R. J., Arnold, S. J., Tomlin, A. S., and Belcher, S. E.: Referencing of street-level flows: results from the DAPPLE 2004 campaign in London UK, Atmos. Environ., 43, 5536–5544, 2009.
Barlow, J. F., Dunbar, T. M., Nemitz, E. G., Wood, C. R., Gal-lagher, M. W., Davies, F., O’Connor, E., and Harrison, R. M.: Boundary layer dynamics over London, UK, as observed using Doppler lidar, Atmos. Chem. Phys. Discuss., 10, 19901–19938, doi:10.5194/acpd-10-19901-2010, 2010.
Briggs, G. A., Britter, R. E., Hanna, S. R., Havens, J. A., Robins, A. G., and Snyder, W. H.: Dense gas vertical dispersion over rough surfaces: Results of wind tunnel studies, Atmos. Environ., 35, 2265–2284, 2001.
Britter, R. E. and Hanna, S. R.: Flow and dispersion in urban areas, Ann. Rev. Fluid Mech., 35, 469–496, 2003.
Britter, R. E., Di Sabatino, S., Caton, F., Cooke, K. M., Simmonds, P. G., and Nickless, G.: Results from three tracer experiments on the neighbourhood scale in the city of Birmingham UK, Water Air Soil Poll. Focus, 2, 79–90, 2002.
Britter, R. E., Hanna, E. R., Briggs, G. A., and Robins, A.: Short-range vertical dispersion from a ground level source in a turbu-lent boundary layer, Atmos. Environ., 37, 3885–3894, 2003. Calder, K. L.: Eddy diffusion and evaporation in flow over
aerody-namically smooth and rough surfaces: a treatment based on labo-ratory laws of turbulent flow with special reference to conditions in the lower atmosphere, Q. J. Mech. Appl. Math. II, 153–176, 1949.
Chatwin, P. C.: The dispersion of a puff of passive contaminant in the constant stress region, Q. J. Roy. Meteorol. Soc., 94, 350– 360, 1968.
Cooke, K. M., Di Sabatino, S., Simmonds, P. G., Nickless, G., Brit-ter, R. E., and Caton, F.: Tracers and dispersion of gaseous pollu-tants in an urban area. Birmingham tracer experiments, Natural Environment Research Council, Technical report, Project Ref: GST/02/1974, 2000.
Davidson M. J., Mylne, K. R., Jones C. D., Phillips J. C., Perkins R. J., Fung J. C. H., and Hunt J. C. R.: Plume dispersion through large groups of obstacles – a field investigation, Atmos. Environ., 29, 3245–3256, 1995.
Draxler, R. R., Dietz, R., Lagomarsin, R. J., and Start, G.: Across North America Tracer experiment (ANATEX): Sampling and analysis, Atmos. Environ., 25A, 2815–2836, 1991.
Elliott, W. P.: The vertical diffusion of gas from a continuous source, Int. J. Air Water Pollut., 4, 33–46, 1961.
Flaherty, J. E., Lamb, B., Allwine, K. J., and Allwine, E.: Verti-cal tracer concentration profiles measured during the Joint Urban 2003 Dispersion Study, J. Appl. Meteorol. Clim., 46, 2019–2037, 2007.
Hanna, S. R., Britter, R. E., and Franzese, P.: A baseline urban dispersion model evaluated with Salt Lake City and Los Angeles data, Atmos. Environ., 37, 5069–5082, 2003.
Hanna, S., White, J., and Zhou, Y.: Observed winds, turbulence and dispersion in built-up downtown areas of Oklahoma City and Manhattan, Bound.-Lay. Meteorol., 125, 441–468, 2007. Hunt, J. C. R. and Weber, A. H.: A Lagrangian Statistical Analysis
of Diffusion from a Ground-Level Source in a Turbulent Bound-ary Layer, Q. J. Roy. Meteorol. Soc., 105, 423–443, 1979. Irwin, J. S.: A theoretical variation of the wind profile power law
exponent and a function of surface roughness and stability, At-mos. Environ., 13, 191–194, 1979.
Kim, H., Yea, S. K., Ro, C., Lee, C. B., Jang, M., Lee, G., Yoo, E., and Han, J.: Determination of atmospheric perfluorocarbon back-ground concentrations of fL/L range at the western coastal area of Korea, Bull. Korean Chem. Soc., 23, 301–308, 2002. Martin, D., Price, C. S., White, I. R., Nickless, G., Dobre, A., and
Shallcross, D. E.: A study of pollutant concentration variability in an urban street under low wind speeds, Atmos. Sci. Lett., 9, 147–152, 2008.
sec-ond DAPPLE field campaign in Lsec-ondon 2004, Atmos. Environ., 44, 3043–3052, 2010b.
Mikkelsen, T., Jørgensen, H. E., Nielsen, M., and Ott, S.: Simi-larity Scaling Of Surface-Released Smoke Plumes, Bound.-Lay. Meteorol., 105, 483–505, 2002.
Nieuwstadt, F. T. M. and van Ulden, A. P.: A numerical study on the vertical dispersion of passive contaminants from a continu-ous source in the atmospheric surface layer, Atmos. Environ., 12, 2119–2124, 1978.
Nieuwstadt, F. T. M. and van Duuren, H.: Dispersion experiments with SF6from the 213 m high meteorological mast at Cabauw
in the Netherlands, Proceedings of the 4th Symposium on Tur-bulence, Diffusion and Air Pollution, Reno, Nevada, 15–18 Jan-uary, 34–40, 1979.
Pasquill, F.: Atmospheric diffusion. The dispersion of windborne materials from industrial and other sources, D. Van Norstand Company Ltd., London, England, 1974.
Pasquill, F. and Smith, F. B.: Atmospheric Diffusion. John Wiley & Sons, Ltd., New York, USA, 1983.
Petersson F. K., Martin, D., Shallcross, D., White, I. R., Henshaw, S. J., Nickless, G., Longley, I., Percival, C. J., and Gallagher M.: CityFlux Perfluorocarbon Tracer Experiments, Atmos. Chem. Phys., 10, 5991–5997, doi:10.5194/acp-10-5991-2010, 2010. Robins, A., Castro, I., Hayden, P., Steggel, N., Contini, D., and
Heist, D.: A wind tunnel study of dense gas dispersion in a neu-tral boundary layer over a rough surface, Atmos. Environ., 35, 2243–2252, 2001.
Rotach, M. W., Vogt, R., Bernhofer, C., Batchvarova, E., Christen, A., Clappier, A., Feddersen, B., Gryning, S.-E., Martucci, G., Mayer, H., Mitev, V., Oke, T. R., Parlow, E., Richner, H., Roth, M., Roulet, Y. A., Ruffieux, D., Salmond, J., Schatzmann, M., and Voogt J.: BUBBLE – an Urban Boundary Layer Meteorol-ogy Project, Theor. Appl. Climatol., 81, 231–261, 2005. Shallcross, D. E., Martin, D., Price, C. S., Nickless, G., White, I.
R., Petersson, F., Britter, R. E., Neophytou, M. K., Tate, J. E., Tomlin, A. S., Barlow, J. F., and Robins, A.: Short range mo-bile urban dispersion experiments using an instrumented vehicle, Atmos. Sci. Lett., 10, 59–65, 2009.
Simmonds, P. G., Greally, B. R., Olivier, S., Nickless, G., Cooke, K. M., and Dietz, R. N.: The background atmospheric concen-tration of cyclic perfluorocarbon tracers determined by negative ion-chemical ionization mass spectrometry, Atmos. Environ., 36, 2147–2156, 2002.
Soulhac, L., Mejean, P., and Perkins, R. J.: Modelling vehicle-generated atmospheric pollution in a quarter of Lyon using the model SIRANE. Proceedings of the seventh international confer-ence on harmonisation within atmospheric dispersion modelling for regulatory purposes, Belgirate, Italy, 28–31 May, 2001. Straume, A. G., Dietz, R. N., N’dri Koffi, E., and Nodop, K.:
Per-fluorocarbon background concentrations in Europe, Atmos. En-viron., 32, 4109–4122, 1998.
Venkatram, A., Isakov V., Pankratz, D., Heumann, J., and Yuan, J.: The analysis of data from an urban dispersion experiment, Atmos. Environ., 38, 3647–3659, 2004.
Watson, T. B., Wilke, R., Dietz, R. N., Heiser, J., and Kalb. P.: The Atmospheric Background of Perfluorocarbon Compounds Used as Tracers, Environ. Sci. Technol., 41, 6909–6913, 2007. Wood, C. R., Arnold, S. J., Balogun, A. A., Barlow, J. F., Belcher, S.
E., Britter, R. E., Cheng, H., Dobre, A., Lingard, J. J. N, Martin, D., Neophytou, M. K., Petersson, F. K., Robins, A. G., Shall-cross, D. E., Smalley, R. J., Tate, J. E., Tomlin, A. S., and White, I. R.: Dispersion experiments in central London: the 2007 DAP-PLE project, B. Am. Meteorol. Soc., 90, 955–969, 2009. Wood, C. R., Lacser, A., Barlow, J. F., Padhra, A., Belcher, S. E.,