Cop
yright
© ABE&M t
odos os dir
eit
os r
eser
vados
.
1 Centro de Atendimento e Apoio ao Adolescente, Departamento de Pediatria, Universidade Federal de São Paulo (Unifesp), São Paulo, SP, Brasil
2 Escola Técnica Estadual (ETEC) Getúlio Vargas. Centro Paula Souza, São Paulo, SP, Brasil 3 Divisão de Estatística,
Universidade Estadual de Campinas (Unicamp), Campinas, SP, Brasil
Correspondence to:
Isa de Pádua Cintra
Centro de Atendimento e Apoio ao Adolescente
Rua Botucatu, 715
04023-062 – São Paulo, SP, Brasil ipcintra@uol.com.br
Received on Mar/6/2009 Accepted on Nov/8/2009
Body mass index percentiles
in adolescents of the city of São
Paulo, Brazil, and their comparison
with international parameters
Percentis do índice de massa corporal de adolescentes na cidade de São Paulo, Brasil, e sua comparação com parâmetros internacionais
Maria Aparecida Zanetti Passos1, Isa de Pádua Cintra1, Lúcia Maria Branco2, Helymar da Costa Machado3, Mauro Fisberg1
ABSTRACT
Objective: To describe the percentile distribution of body mass index (BMI) in school adoles-cents, by gender and age, comparing them with international parameters. Subjects and me-thods: The study included 8,020 adolescents aged 10-15 years from 43 schools in the city of São Paulo, southeastern Brazil. BMI values of the study sample were distributed in percentiles and compared to international parameters (CDC, Must and cols. and Cole and cols.). Results: Both male and female adolescents aged 10 to 14 years showed BMI cut-offs over the international pa-rameters, especially in the P50-P85 percentile range. At the age of 15, the observed values were very similar to reference data; however, BMI values in the 95th percentile were much higher than international parameters. Conclusions: The study results show how important it is to use adequate BMI values for Brazilian adolescents aged 10-15 since international parameters may not relect the actual nutritional status of this group. Arq Bras Endocrinol Metab. 2010;54(3):295-302
Keywords
Body mass index; obesity; adolescent; anthropometric
RESUMO
Objetivo: Distribuição do índice de massa corporal (IMC) em percentis dos adolescentes esco-lares, divididos por sexo e idade, comparando-os com os parâmetros internacionais. Sujeitos e métodos: Participaram do estudo 8.020 adolescentes de 10 a 15 anos de 43 escolas da cidade de São Paulo. Os valores do IMC dessa população foram distribuídos em percentis e compa-rados com os parâmetros internacionais (CDC, Must e Cole). Resultados: Os adolescentes dos 10 aos 14 anos de idade, do sexo masculino e feminino, apresentaram pontos de corte do IMC acima dos internacionais, especialmente no intervalo P50-85. Aos 15 anos de idade, os valores observados foram muito semelhantes, no entanto, o IMC no valor do percentil 95 foi muito mais elevado do que os parâmetros internacionais. Conclusões: Os resultados deste estudo demonstram a importância de utilizar valores adequados para adolescentes brasileiros de 10 a 15 anos, uma vez que os parâmetros internacionais podem não reletir a real condição do estado nutricional dessa população. Arq Bras Endocrinol Metab. 2010;54(3):295-302
Descritores
Índice de massa corporal; obesidade; adolescente; antropometria
INTRODUCTION
T
he use of anthropometric measures in the nutritio-nal evaluation of individuals and populations has become the most practical and the least costly approach.It can be used for clinical purposes, screening and even for monitoring tendencies (1).
Cop
yright
© ABE&M t
odos os dir
eit
os r
eser
vados
.
index (BMI), largely used among adults, has been increas-ingly used to describe and classify the nutritional state of children and adolescents. In addition to being reliable, practical to obtain and easy to understand, BMI shows good correlation with the amount of body fat (2,3).
Based on the recommendation for the use of BMI as a criterion for screening excess body fat in obesity among children and adolescents (4,5), and in studies that show exponential increase of obesity both in de-veloped and developing countries (6,7), the discussion regarding its use to evaluate the nutritional state of the young population has been focused on the choice of the most adequate curve and the deinition of critical values for nutritional classiication of obesity (1).
The lack of consensus in literature on the criteria to deine obesity in children and adolescents points to the need for researchers to establish speciic cut-offs for each population. Therefore, the purpose of the pres-ent study was to describe the percpres-entile distribution of BMI values among students aged 10 to 15 years in the city of São Paulo, Brazil, comparing them to interna-tional parameters and to evaluate these students as for overweight and obesity by age and gender.
SUBJECTS AND METHODS
School sampling
For school selection, the 2002 school census including a list of all the schools in the city of São Paulo was ob-tained from the regional school jurisdictions. The city was then divided into four areas of study (northern, midwestern, eastern, and southern areas) so that differ-entiated social groups would be included in the sample. The proportional sample was stratiied according to school inclusion in the socio-geographic areas and their administrative category (public or private). The total number of schools was determined based on the proportion in each area so that the area with the largest number of schools would have the highest number of students included in the study. A proportionality ratio was established between public and private schools in each area; i.e., if there were 10 public and 5 private schools, the ratio would be 2:1, but this proportionality was not the same for all the areas studied. The schools that met the following study inclusion criteria were then selected: minimum of 200 students (50 students per grade) enrolled from 5th to 8th grade; easily ac-cessible facility; and day and/or evening classes. Using
stratiied, proportional-to-size sampling procedures, schools were drawn to be included in the sample.
The schools were contacted and meetings were scheduled. These meetings were opportunities for ex-plaining the study objectives and showing all materials that would be used in the study. During these exposi-tions the importance of evaluating adolescents for early detection of any nutritional deviations was stressed.
When a school refused to participate it was replaced by another one from the same district, previously num-bered and randomly drawn.
All schools for which the principals signed a letter of authorization participated in the study. After their agreement to participate in the study, a meeting was scheduled with the school teachers to explain to them the study objectives so they could help us approach the adolescents and collect data. A great effort was made not to disrupt the school routine during data collection.
A representative sample of the city of São Paulo was studied including 43 schools (32 public and 11 private) from the northern (17%), midwestern (17%), eastern (37%), and southern (29%) areas of the city; most pub-lic schools are located in the eastern area of the city (11; 34.4%) and a larger number of private schools is seen in the southern area (6; 54.5%) of the city.
Study population
Cop
yright
© ABE&M t
odos os dir
eit
os r
eser
vados
.
age difference. Data were collected between September 2004 and June 2005 and the sample included 74.8% of public and 25.2% of private school students.
Anthropometric measurements
The study variables were evaluated by a team consist-ing of 20 female interns (Nutrition and Physical Educa-tion students) and four 4 female coordinators (Master’s students, two of them authors of the present article) who were previously trained on taking anthropometric measurements. To assure the evaluation’s quality a pilot study was carried out after training to assess reliabil-ity and objectivreliabil-ity of the evaluators’ measures taken. This pilot study was key not only to reduce variability between evaluators but also to minimize interference in the school routine given the large number of stu-dents evaluated. The whole project was coordinated by a child/adolescent Physician and a Nutritionist, both teachers at a Federal University.
Adolescents were weighed wearing light clothing and no shoes on a portable digital scale (Tanita
) with 150 kg capacity. Their height was determined by means of a wall-mounted digital stadiometer (Seca
). These measures were taken based on the criteria as described by Jellife (8). BMI was calculated by dividing weight in kilograms (kg) by height in square meters (m2) as
established by the US Centers for Disease Control and Prevention (CDC) (9). Low weight was deined when BMI values were below the 5th percentile (< P5);
nor-mal weight when BMI values were at or above the 5th
and below the 85th percentiles (P5-P85); overweight
when they were at or above the 85th and below the 95th
percentile (P85-P95); and obese when they were at or above the 95th percentile (≥ P95).
The study protocol was approved by the Graduate Research Board, and Research Ethics Committee of the Federal University of São Paulo. Only those adoles-cents whose parents or legal guardians had given their written consent participated in the study.
Data analysis
In order to describe the proile of the sample according to the variables studied, frequency tables for categorical variables (gender, age group) were created and descrip-tive statistics (mean, standard deviation, minimum and maximum values) for continuous variables (age, height, weight and BMI) were calculated. Student’s t-test was used to assess the difference of the numerical variables
of interest by gender and the analysis of variance (one-way ANOVA) was performed to assess differences by age, followed by the Tukey’s post-hoc multiple com-parison test. For asymmetric variables or those without a normal distribution the logarithmic transformation (log10) was performed before calculating the statistical test. The level of signiicance adopted for all the statisti-cal tests was 5%, that is, p < 0.05 (10-13).
Data were pre-arranged for the analysis of distribu-tion of BMI values in the sample studied, from the lowest (minimum) to the highest (maximum), and then subdi-vided into 100 parts of equivalent sizes (percentiles). The values corresponding to P5, P10, P15, P25, P50, P75, P85, P90 and P95 by gender and age, were adopted.
The chi-square test was used to compare BMI per-centiles by gender. Based on these BMI perper-centiles, we developed the respective curves by age and gender and compared the BMI cut-offs of the sample studied to the parameters established by Cole and cols. (14), Must and cols. (15) and CDC (9) as they are international references largely used in Brazil.
Statistical analyses were conducted using SAS (Sta-tistical Analysis System) for Windows, version 6.12 (SAS Institute Inc, 1989-1996, Cary, NC, USA).
RESULTS
Table 1 shows the sample’s descriptive statistics. When measures were corrected by logarithmic transforma-tion, male adolescents had higher weight (p = 0.036) and height (p < 0.001) and lower BMI values (p = 0.004) than females but there were no statistically sig-niicant differences by age (p = 0.36). Male adolescents had lower mean BMI and showed greater data variabil-ity (weight and height) as well.
Mean BMI values were higher among female than male adolescents in P10 (16.30 x 16.08; p = 0.006), P15 (16.90 x 16.57; p < 0.001), P25 (17.71 x 17.39; p < 0.001), and P50 (19.72 x 19.31; p < 0.001, respec-tively). No statistically signiicant differences were seen in the remaining percentiles.
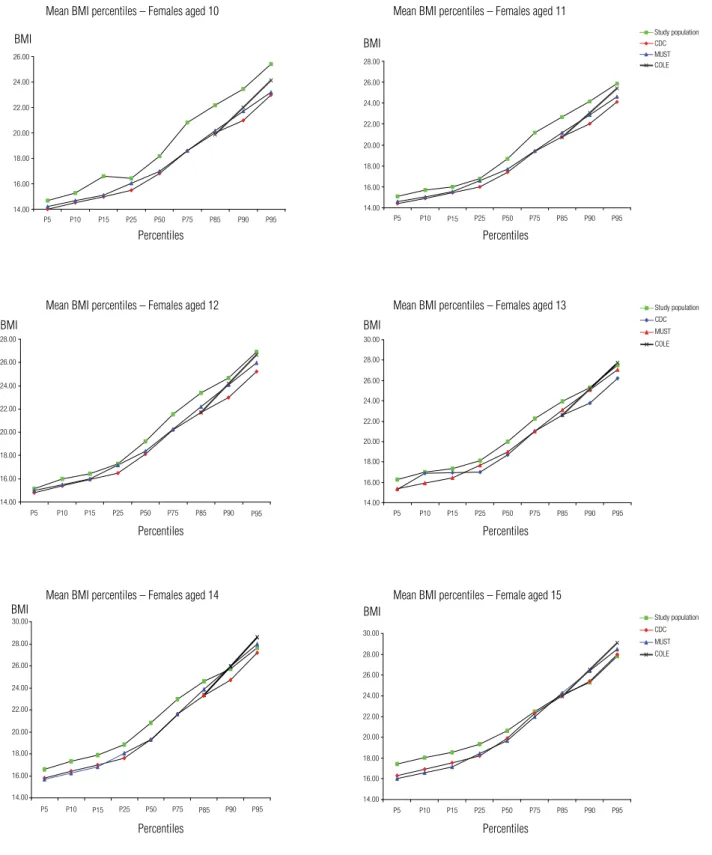
Table 2 shows BMI values in the percentiles by age and gender. Figure 1 and igure 2 present BMI curves for the sample studied in percentiles, by age and gender, in comparison to the parameters described by Must and cols. (15), CDC (9) and Cole and cols. (14). Cole and cols. (14) data are presented only for the 85th and 95th
Cop
yright
© ABE&M t
odos os dir
eit
os r
eser
vados
.
Table 1. Mean, standard deviation, minimum and maximum values by age
and anthropometric measures of adolescents from São Paulo
Variables
Population
General
8020 (100%)
Female
4372 (54.5%)
Male
3648 (45.5%)
AGE (years) Mean (SD) Minimum − Maximum
13.04 (1.27) 10.00 – 14.92
13.03 (1.26) 10.00 – 14.92
13.06 (1.29) 10.00 – 14.92
WEIGHT (kg) Mean (SD) Minimum − Maximum
49.97 (12.14) 22.00 – 110.6
49.48 (10.91) 24.80 – 106.20
50.55 (13.44) 22.00 – 110.60
HEIGHT (cm) Mean (SD) Minimum − Maximum
156.67 (9.68) 124.50 – 189.30
155.77 (7.87) 124.5 – 186.80
157.75 (11.39) 125.83 – 189.30
BMI (kg/m2) Mean (SD) Minimum − Maximum
20.17 (3.69) 10.74 – 54.80
20.26 (3.59) 10.74 – 40.29
20.07 (3.80) 11.75 – 54.80
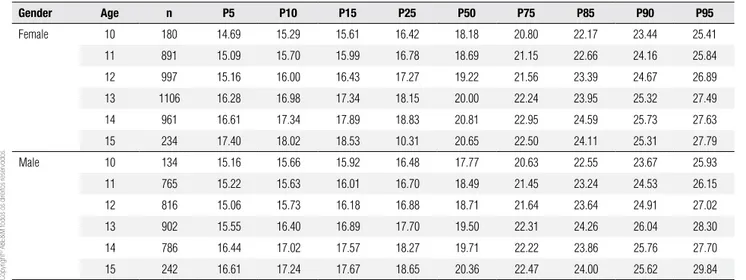
Table 2. Body mass index (BMI) percentiles by age and gender for the study adolescents
Gender Age n P5 P10 P15 P25 P50 P75 P85 P90 P95
Female 10 180 14.69 15.29 15.61 16.42 18.18 20.80 22.17 23.44 25.41
11 891 15.09 15.70 15.99 16.78 18.69 21.15 22.66 24.16 25.84
12 997 15.16 16.00 16.43 17.27 19.22 21.56 23.39 24.67 26.89
13 1106 16.28 16.98 17.34 18.15 20.00 22.24 23.95 25.32 27.49
14 961 16.61 17.34 17.89 18.83 20.81 22.95 24.59 25.73 27.63
15 234 17.40 18.02 18.53 10.31 20.65 22.50 24.11 25.31 27.79
Male 10 134 15.16 15.66 15.92 16.48 17.77 20.63 22.55 23.67 25.93
11 765 15.22 15.63 16.01 16.70 18.49 21.45 23.24 24.53 26.15
12 816 15.06 15.73 16.18 16.88 18.71 21.64 23.64 24.91 27.02
13 902 15.55 16.40 16.89 17.70 19.50 22.31 24.26 26.04 28.30
14 786 16.44 17.02 17.57 18.27 19.71 22.22 23.86 25.76 27.70
15 242 16.61 17.24 17.67 18.65 20.36 22.47 24.00 25.62 29.84
DISCUSSION
Studies on the indicators of overweight and obesity in childhood and adolescence have brought about many investigations on the prognosis of health risk (16-25).
Some authors have shown preference for the deini-tion of cut-offs based on statistical criteria of mortality or those that point to continuing overweight and obe-sity in childhood, adolescence and adulthood (26-27).
Cole and cols. (14) study was one of the irst to present BMI values in agreement with this trend. There are other publications with borderline BMI values that are also used to identify children with overweight and obesity (28-30).
Many authors consider it not possible to either es-timate worldwide prevalence of obesity in children or
compare prevalences due to the diversity of criteria used (31-32).National studies on indicators of nutritional state in adolescence are still too limited and usually re-stricted to developed countries and the real magnitude of this condition is not known in developing societies (33). Considering the multiracial character of the Bra-zilian population, and speciically of adolescents of our study, we found how important it is for researchers to establish BMI values based on the population they in-tend to study so that an early diagnosis of overweight can be made.
Excess weight was seen in 23% of public and 33% of private school adolescents. Of them, 8.21% and 7.83% of girls, and 9.91% and 17.84% of boys were obese, respectively.
As the most widely used scales in health are those with scores expressed in percentiles, we decided to use them to assess the distribution of BMI in adoles-cents aged between 10 and 15 years from the city of São Paulo. Percentiles indicate the relative position of an individual within a group, showing the position of those who are above or below a given score. The ad-vantage of using percentile tables is that their values are not affected by the distribution of raw scores, and they do not take into consideration the mean and data variability (34).
Cop
yright
© ABE&M t
odos os dir
eit
os r
eser
vados
.
14.00 16.00 18.00 20.00 22.00 24.00 26.00 28.00 30.00
P5 P10 P15 P25 P50 P75 P85 P90 P95
14.00 16.00 18.00 20.00 22.00 24.00 26.00 28.00 30.00
P5 P10 P15 P25 P50 P75 P85 P90 P95
Study population CDC MUST COLE 14.00
16.00 18.00 20.00 22.00 24.00 26.00 28.00 30.00
P5 P10 P15 P25 P50 P75 P85 P90 P95
Study population CDC MUST COLE
14.00 16.00 18.00 20.00 22.00 24.00 26.00 28.00
P5 P10 P15 P25 P50 P75 P85 P90 P95
14.00 16.00 18.00 20.00 22.00 24.00 26.00 28.00
P5 P10 P15 P25 P50 P75 P85 P90 P95
Study population CDC MUST COLE
14.00 16.00 18.00 20.00 22.00 24.00 26.00
P5 P10 P15 P25 P50 P75 P85 P90 P95
Figure 1. Comparison of BMI percentiles to international parameters in female adolescents by age.
Mean BMI percentiles – Females aged 10 Mean BMI percentiles – Females aged 11
Mean BMI percentiles – Females aged 12 Mean BMI percentiles – Females aged 13
Mean BMI percentiles – Females aged 14 Mean BMI percentiles – Female aged 15
aged between 10 and 15 years were 21.01 and 23.23 kg/m2,
respectively, while for male adolescents they were 19.73 and 21.9 kg/m2, respectively. In the present study,
mean BMI values in the 85th and 95th percentiles for
female adolescents of the same age group were 23.47
and 26.84 kg/m2 compared to 24.90 and 27.49 kg/m2,
respectively, for male adolescents.
When we compared Anjos and cols. (35) data to the results of the present study, we found a mean BMI in-crease (lower limit – upper limit) of 2.46 (0.51 – 4.06)
Percentiles BMI
BMI
BMI
BMI
BMI
BMI Percentiles
Percentiles
Percentiles
Percentiles
Cop
yright
© ABE&M t
odos os dir
eit
os r
eser
vados
.
14.00 16.00 18.00 20.00 22.00 24.00 26.00 28.00
P5 P10 P15 P25 P50 P75 P85 P90 P95 14.00
16.00 18.00 20.00 22.00 24.00 26.00 28.00
P5 P10 P15 P25 P50 P75 P85 P90 P95
Study population CDC MUST COLE
14.00 16.00 18.00 20.00 22.00 24.00 26.00 28.00 30.00
P5 P10 P15 P25 P50 P75 P85 P90 P95
Study population CDC MUST COLE
14.00 16.00 18.00 20.00 22.00 24.00 26.00 28.00
P5 P 10 P15 P25 P50 P75 P85 P90 P95
14.00 16.00 18.00 20.00 22.00 24.00 26.00 28.00 30.00
P5 P10 P15 P25 P50 P75 P85 P90 P95
14.00 16.00 18.00 20.00 22.00 24.00 26.00 28.00 30.00 32.00
P5 P10 P15 P25 P50 P75 P85 P90 P 95
Study population CDC MUST COLE
Figure 2. Comparison of BMI percentiles to international parameters in male adolescents by age.
Mean BMI percentiles – Males aged 10 Mean BMI percentiles – Males aged 11
Mean BMI percentiles – Males aged 12 Mean BMI percentiles – Males aged 13
Mean BMI percentiles – Males aged 14 Mean BMI percentiles – Males aged 15
units in P85 and 3.61 (1.63 – 5.81) units in P95 for female adolescents. As for male adolescents, the mean BMI increase was 5.17 (3.92 – 5.94) units in P85 and 5.6 (4.85 – 6.4) units in P95.
These results show that both female and male ado-lescents between 10 and 15 years of age, but especially
males, have higher BMI values and, therefore, more body fat compared to previous studies, such as the An-jos and cols. (35) study in which data were collected over 15 years ago.
McCarthy and cols. (36), by comparing data from the National Diet and Nutrition Survey (1997) and
BMI
BMI
BMI
BMI
BMI BMI
Percentiles
Percentiles
Percentiles
Percentiles
Percentiles
Cop
yright
© ABE&M t
odos os dir
eit
os r
eser
vados
.
data from the British Standards Institute(males, 1977; female, 1987) of British adolescents aged 11 to 16, reported, by means of the standard deviation score, a mean increase of 0.47 and 0.53 units in BMI of males and females, respectively. Although in the present study we did not evaluate BMI values in scores, we noted an inversion of the higher increases in relation to the female. This inversion was not inluenced by weight changes that take place for a period, a fact known to have great impact on the increase of obesity prevalence as well as on its severity.
The prevalence of overweight and obesity in Brazil is increasing following the trend seen worldwide (37-40). The values found for BMI percentiles in both fe-male and fe-male adolescents aged 10 to 15 (Figures 1 and 2) were higher than those proposed byMust and cols. (15), CDC (9), and Cole and cols. (14). The main differences were seen in the upper limits (P85 and P95) for 10- and 11-year-old females and 10- to 13-year-old males.
In regard to the girls studied, BMI values found for the 85th percentile were higher to those reported in
other studies for the ages of 10, 11, 12, 13 and 14, and similar for the age of 15. As for the 95th percentile, the
values found were higher for the ages of 10 to 12; similar to those proposed by Cole and cols. (14) for the age of 13; and lower to those proposed by Cole and cols. (14) and Must and cols. (15) for the ages of 14 and 15. The values found in the 85th and 95th percentiles for males
aged 10 to 13 were much higher than those reported in other studies. The value in P95 for 14-year-old males was similar to that published by Cole and cols. (14). In regard to 15-year males, the value in the 95th percentile
was much higher than that described in other studies. It seems that the cut-offs for overweight and obesity proposed by Cole and cols. (14) were the ones with the closest similarity to those in the sample studied.
Considering that the Brazilian population is misce-genated, it would be interesting for future studies to fo-cus on differences regarding ethnical aspects of growth and body composition since the groups have different characteristics, culture and habits.
The results of the present study describe different BMI percentiles in a representative sample of adoles-cents. It thus shows the importance for researchers to use these values while studying this population since, as corroborated by our results, international standards may not relect the real condition of Brazilian adoles-cents aged between 10 and 15.
Disclosure: Mauro Fisberg received aid for research for the following companies: Abbott, Danone, Kraft, ABIR, ABITRIGO and Nestlé. The remaining authors declare they have no conlict of interest.
REFERENCES
1. Bini V, Celi F, Berioli MG, Bacosi ML, Stella P, Giglio P, et al. Body mass index in children and adolescents according to age and pu-bertal stage. Eur J Clin Nutr. 2000;54(3):214-18.
2. Pietrobelli A, Faith MS, Allison DB, Gallagher D, Chiumello G, Heymsield SB. Body mass index as a measure of adiposity among children and adolescents: a validation Study. J Pediatr. 1998;132(2):204-10.
3. Mei Z, Grummer SLM, Pietrobelli A, Goulding A, Goran MI, Dietz WH. Validity of body mass index compared with other body-com-position screening indexes for the assessment of body fatness in children and adolescents. Am J Clin Nutr. 2002;75(6):978-85. 4. WHO Expert Committee on Hypertension Control. Cardiovascular
Diseases. Geneva; 1994/2001.
5. Belizzi MC, Dietz WH. Workshop on childhood obesity: summary of the discussion. Am J Clin Nutr. 1999;70(1):173S-5S.
6. Ebbeling CB, Pawlak DB, Ludwig DS. Childhood obesity: public-health crisis, common sense cure. Lancet. 2002;360(9331):473-82. 7. Wang Y, Wang JQ. A comparison of international references for
the assessment of child and adolescent overweight and obesity in different populations. Eur J Clin Nutr. 2002;56(10):973-82. 8. Jelliffe DB. The assessment of the nutritional status of the
com-munity. WHO monograph, 53. Geneva: 1966.
9. CDC – Center for disease control and prevention. 2000 CDC Gro-wth charts: United States [online] Hyaltsville: 2002. Accessed on: Jan 15 2003. Available from: www.cdc.gov/growthcharts. 10. Conover WJ. Practical nonparametric statistics. New York: John
Wiley & Sons; 1971.
11. Siegel S. Estatística não-paramétrica para as ciências do compor-tamento. São Paulo: MC Graw-Hill; 1975.
12. Miliken GA, Johnson DE. vol. 1. Analysis of messy data. Designed Experiments. New York: Van Nostrand Reinhold Company; 1984. 13. Montgomery DC. Design and analysis of experiments. 3th ed.
New York: John Wiley Sons; 1991.
14. Cole TJ, Bellizzi MC, Flegal KM, Dietz WH. Establishing a standard deinition for child overweight and obesity worldwide: Internatio-nal Survey. BMJ. 2000;320:1240-3.
15. Must A, Dallal GE, Dietz WH. Reference data for obesity: 85th and 95th percentiles of body mass index (WT/Th2) and triceps skin-fold thickness. Am J Clin Nutr. 1991;53(4):839-46.
16. Baker JL, Olsen LW, Sørensen TIA. Childhood body mass index and the risk of coronary heart disease in adulthood. N Engl J Med. 2007;357:2329-37.
17. Thompson DR, Obarzanek E, Franko DL, Barton BA, Morison J, Biro FM, et al. Childhood overweight and cardiovascular disease risk factors: The National Heart, Lung, and Blood Institute Growth and Health Study. J Pediatr. 2007;150(1):18-25.
18. Rosa ML, Mesquita ET, Rocha ER, Fonseca VM. Body mass index and waist circumference as markers of arterial hipertension in adolescents. Arq Bras Cardiol. 2007;88(5):573-8.
19. Morrison JA, Friedman LA, GrayMcGuire C. Metaboblic syndro-me in childhood predicts adult cardiovascular disease 25 years later: the princeton lipid research clinics follow-up study. Pedia-trics. 2007;120(2):340-5.
Cop
yright
© ABE&M t
odos os dir
eit
os r
eser
vados
.
21. Morrison JA, Friedman LA, Wang P, Glueck CJ. Metabolic syndrome in childhood predicts adult metabolic syndrome and type 2 diabetes mellitus 25 to 30 years later. J Pediatr. 2008;152:201-6.
22. Bray GA, Jablonski KA, Fujimoto WY, Cannor EB, Haffner S, Han-son RL, et al. Relation of central adiposity and body mass index to the development of diabetes in the Diabetes Prevention Program. Am J Clin Nutr. 2008;87(5):1212-8.
23. Denney WE, Hardy LL, Dobbins T, Okely AD, Baur LA. Body mass index, waist circumference and chronic disease risk factors in Aus-tralian adolescents. Arch Pediatr Adolesc Med. 2008;162(6):566-73. 24. Santos LC, Cintra IP, Fisberg M, Martini LA. Body trunk fat and
insulin resistance in post pubertal obese adolescents. Med J. 2008;126(2):82-6.
25. Messiah SE, Arheart KL, Lpshultz SE, Miller TL. Body Mass Index, waist circumference, and cardiovascular risk factors in adoles-cents. J Pediatr. 2008;153(6):845-50.
26. Lawlor DA, Hart CL, Hole DJ, Davey SG. Reverse causality and confounding and the associations of overweight and obesity with mortality. Obesity. 2006;14:2294-304.
27. Gelber RP, Kurth T, Manson JE, Buring JE, Gaziano JM. Body mass index and mortality in men: evaluating the shape of the association. Int J Obes. 2007;31(8):1240-7.
28. Cole TJ, Roede MJ. Centiles of body mass index for dutch children aged 0-20 years in 1980 − a baseline to assess recent trends in obesity. Ann Hum Biol. 1999;26(4):303-8.
29. Luciano A, Bressan F, Zoppi G. Body mass index reference curves for children aged 3-19 years from Verona, Italy. Eur J Clin Nutr. 1997;51:6-10.
30. Turconi G, Guarcello M, Maccarini L, Bazzano R, Zaccardo A, Ro-ggi C. BMI values and other anthropometric and functional
mea-surements as predictors of obesity in a selected group of adoles-cents. Eur J Nutr. 2006;45:136-43.
31. Guillaume M. Deining obesity in childhood: Current practice. Am J Clin Nutr. 1999;70:126S-30S.
32. Livingstone MB. Childhood obesity in Europe: a growing con-cern. Public Health Nutr. 2001;4:109-16.
33. World Health Organization. Obesity: preventing and managing the global epidemic. Report of WHO Consultation on obesity. Ge-neva: WHO; 1998.
34. Baumgartner RN, Heymsield SB, Roche AF. Human body com-position and the epidemiology of chronic disease. Obes Rev. 1995;3(1):73-95.
35. Anjos LA, Veiga GV, Castro IRR. Distribuição dos valores do índice de massa corporal da população brasileira até 25 anos. Rev Pa-nam Salud Publica [online]. 1998;3(3):164-73.
36. McCarthy HD, Ellis SM, Cole TJ. Central Overweight and obesi-ty in Bristish youth aged 11-16 years: Cross sectional surveys of waist circumference. BMJ. 2003;326:624-27.
37. Costa RF, Cintra IP, Fisberg M. Prevalência de sobrepeso e obesi-dade em escolares da Ciobesi-dade de Santos, SP. Arq Bras Endocrinol Metab. 2006;50(1):60-7.
38. Cintra IP, Passos MAZ, Fisberg M, Machado HC. Evolution of body mass index in two historical series of adolescents. J Pediatr (Rio J). 2007;83(2):157-62.
39. Ferreira A, Oliveira CER, França NM. Síndrome metabólica em crianças obesas e fatores de risco para doenças cardiovas-culares de acordo com a resistência à insulina. J Pediatr (RJ). 2007;83(1):21-6.