Immigrant Students’ Achievements in Croatia, Serbia
and Slovenia in Context
Iztok Šori*1, Nika Šušterič2 and Slavko Gaber3
• Achievement gaps between immigrant and native students indicate fail-ure to assfail-ure educational equity in the majority of countries assessed by the Programme for International Student Assessment in 2009 (PISA, 2009). he present article explains disparate achievement results in Eu-rope, irst testing the hypothesis of old and new democracies. In further contextualisation of the achievement results, the analysis seeks explana-tions beyond the common education system explanatory model. Spe-ciically, the article considers results from Croatia, Serbia and Slovenia, highlighting the signiicance of language distance between native and immigrant students as well as migration regimes as important factors in creating or reducing the achievement gap between native and immi-grant students. Evidence has been found that immiimmi-grant students score worse in countries with guest labour immigration regimes than in the countries with large scale forced immigration of people of the same eth-nic (linguistic) origin.
Keywords: Achievement, Equity, Immigrant students, Migration pat-terns, PISA 2009
Introduction
Although migration and the subsequent education of immigrant chil-dren are an old and widespread phenomenon, “it is only in recent years that
1 *Corresponding author. Department of Sociology of the Faculty of Arts, University of Ljubljana iztok.sori@gmail.com
2 Special and Rehabilitation Education at the Faculty of Education, University of Ljubljana (student)
susteric.nika@gmail.com
international database[s] have become available with which to conduct quan-titative studies on the situation of immigrant students” (Organisation for Eco-nomic Co-operation and Development (OECD), 2006, p. 30).
PISA assessments, the most comprehensive data set on the subject, regularly demonstrate that immigrant students4 have comparatively lower
edu-cation achievement than native students in most of the countries assessed. In PISA 2003, which focused on mathematics, native students in OECD coun-tries outperformed irst generation immigrant students by 48 points (OECD, 2006, p. 183). In PISA 2006, irst generation immigrant students lag, on average, 58 points behind native students in science (OECD, 2007, p. 175). In the most recent assessment of reading competences, PISA 2009 found native students in OECD countries outperformed irst generation immigrant students by 50 points (OECD, 2010c, p. 170).
Experts from PISA claim that 40 points represent one school year (OECD, 2010c, p. 49). If that is the case, the diferences presented above raise serious concerns regarding the future prospects of a considerable part of the population. It is expected that immigrant children will comprise up to one third of the European Union (EU) school population by 2020 (Huttova, McDonald & Harper, 2008, p. 2), meaning that not only students themselves will have to face the challenge, but European societies as well.
Although empirical evidence suggests that students who speak a lan-guage other than the lanlan-guage of instruction at home score lower than stu-dents whose households speak the language of instruction (OECD, 2006, p. 77; OECD, 2010c, pp. 177-181), language proiciency is neither the only nor the most important factor contributing to lower achievement of immigrant stu-dents. Data obtained by PISA (OECD, 2010c, pp. 177-179) demonstrate a high correlation between socioeconomic background and immigrant students’ test results. Research in the United Kingdom has conirmed that socioeconomic status is the key factor when explaining achievement gaps between immigrant and native students (Rothon, 2004). In France, there is evidence that immigrant children have lower social mobility than students without immigrant status (Si-mon, 2003, p. 1093). Even ater accounting for socioeconomic status, however,
4 We use the PISA deinition of immigrant background: (1) native students (born in the country
of assessment, or with at least one parent born in that country; students born abroad with at least one parent born in the country of assessment are also classiied as ‘native’ students), (2)
it is obvious that socioeconomic standing cannot entirely explain the difer-ence. Most authors agree that several factors are involved, oten depending on the national context (see, e.g., DfES, 2005; Gillborn & Mirza, 2000; Kristen & Granato, 2007).
In order to grasp the complexity of variations in achievement levels among immigrant and native students, it is important to consider two points. Firstly, there are considerable achievement gaps between diferent immigrant ethnic groups within one country (e.g., Rothon, 2007), but also, as Crul and Schneider (2009) demonstrate, there are diferences in the performance of immigrants of the same ethnic origin in diferent countries. Secondly, lower immigrant performance is not without exception. In traditional settlement countries, such as Australia, Canada and New Zealand, there are virtually no performance diferences between immigrant students and their native peers. his is oten linked with the immigration regimes of these countries, which are grounded on the selection of the majority of immigrants “on the basis of their ability to make an economic contribution, which creates a highly educated im-migrant class” (OECD, 2011, p. 70).
In the context described above, we narrow the focus of the present pa-per irst to ten European countries. he criteria used to select these countries included their status as an old or new European democracy, and their diverse geographic locations, educational traditions, as well as the achievement levels of native and immigrant students, the background of the immigrant population and immigration patterns. he paper endeavours to establish whether there are any consistent patterns related to the results achieved.
he present paper endeavours to:
1. Present the actual results from the PISA 2009 assessment in Croatia, Serbia and Slovenia in a more detailed manner. In doing so, we will use – for comparative reasons and to contextualise the results – average OECD results as well as results for ive selected former socialist coun-tries (Croatia, Estonia, Hungary, Serbia and Slovenia) and ive selected old democracies (Austria, Belgium, Finland, Germany and Norway) in Europe. In this section, we will try to test the comparability of Croatia, Serbia and Slovenia in the European context.
2. Conceptualise and present diferences in immigration regimes and their efects on student immigrant populations in Croatia, Serbia and Slovenia.
Croatia, Serbia and Slovenia in the European Context
As mentioned above, the present paper narrows the comparison of im-migrant and native students in Croatia, Serbia and Slovenia only to countries in Europe. he comparison focuses on ive post-socialist countries (the three former Yugoslav Republics, Estonia and Hungary) and ive old democracies (Austria, Belgium, Germany, Finland and Norway).
Table 1: Old and new European democracies and reading achievement diferences between native and immigrant students.
Country
Native Students’
Score Points
Immigrant Students’
Score Points
Diference between Native and Immigrant
Students
Share of Immigrant
Students
GDP (PPP) per
Capita
Austria 482 414 68 15.2 39,647
Belgium 519 451 68 14.8 36,322
Finland 538 468 70 2.6 36,843
Germany 511 455 56 17.6 35,551
Norway 508 456 52 6.8 55,198
Croatia 479 461 18 10.7 16,474
Estonia 505 470 35 8.0 20,753
Hungary 495 507 -12 2.1 19,829
Serbia 442 456 -14 9.5 10,911
Slovenia 488 441 47 7.8 28,893
OECD Average 499 457 42 10.3 33,225
Selected Countries Average 496.7 457.9 38.8 9.5 30,042 Old Democracies Average 511.6 448.8 62.8 11.4 40,712 New Democracies Average 481.8 467 14.8 7.6 19,372
(Gross domestic product based on purchasing-power-parity per capita) is calculated
in International Dollars and obtained from the World Economic Outlook Database (International Monetary Fund, October 2009).
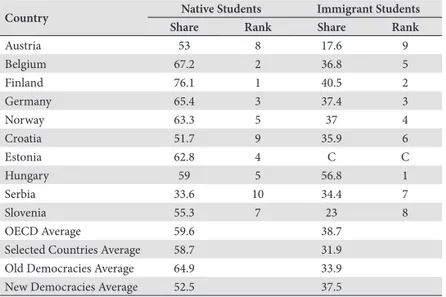
Table 2: Share of students at proiciency levels 3 – 6 in reading achievement: native and irst generation immigrant students.
Country Native Students Immigrant Students
Share Rank Share Rank
Austria 53 8 17.6 9
Belgium 67.2 2 36.8 5
Finland 76.1 1 40.5 2
Germany 65.4 3 37.4 3
Norway 63.3 5 37 4
Croatia 51.7 9 35.9 6
Estonia 62.8 4 C C
Hungary 59 5 56.8 1
Serbia 33.6 10 34.4 7
Slovenia 55.3 7 23 8
OECD Average 59.6 38.7
Selected Countries Average 58.7 31.9
Old Democracies Average 64.9 33.9
New Democracies Average 52.5 37.5
Note: he abbreviation Cdenotes missing data due to too few observations to provide reliable estimates or no observation at all (PISA, 2010c, p. 23). Data were obtained and calculated from
the PISA 2009 database.
Table 2 shows signiicant diferences in the number of students who reached proiciency level 3,5 which is the minimum competency required for future profession-al success.6 Achievement gaps are signiicant both for the native population of students and for the irst generation of immigrants. In a number of countries, signiicant dif-ferences exist between the native and immigrant population within the same country. here are signiicant diferences, for example, in the share of native students at level 3 or higher between Serbia (33.6%) and Finland (76.1%). Yet there is an obvi-ous diference between the share of native Finns reaching level three and the share of immigrants (40.5%) reaching the same level. he proportion of immigrants in Serbia
5 While at proiciency level 2 on the reading scale students only begin to demonstrate reading skills, students at proiciency level 3 are capable of reading tasks of moderate complexity, such as locating multiple pieces of information, making links between diferent parts of the text and
relating the text to familiar everyday knowledge (OECD, 2010a, p. 51) and thus are more likely to experience success in their future life.
(34.4%) who have reached level 3 competency is close to the proportion in Finland and far higher than that in Slovenia (23%) and Austria (17.6%). Hungary’s immigrant students perform exceptionally well: 56.8% of irst generation students have reached at least proiciency level 3. In Hungary’s second generation, the share is 73.7% - close to the Finnish native percentage of 76.1, and far higher than the OECD average for second generation students, which is 45.3%. Generally, however, a pattern does seem to emerge: in countries where native students perform exceptionally well, immigrant students lag behind and do not gain the same beneits from the educational system.
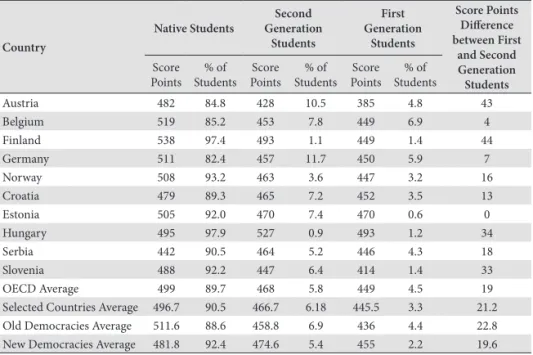
Table 3: Reading achievement of native students and students with an immigrant background (irst and second generation).
Country Native Students Second Generation Students First Generation Students Score Points Diference between First and Second Generation Students Score Points % of Students Score Points % of Students Score Points % of Students
Austria 482 84.8 428 10.5 385 4.8 43
Belgium 519 85.2 453 7.8 449 6.9 4
Finland 538 97.4 493 1.1 449 1.4 44
Germany 511 82.4 457 11.7 450 5.9 7
Norway 508 93.2 463 3.6 447 3.2 16
Croatia 479 89.3 465 7.2 452 3.5 13
Estonia 505 92.0 470 7.4 470 0.6 0
Hungary 495 97.9 527 0.9 493 1.2 34
Serbia 442 90.5 464 5.2 446 4.3 18
Slovenia 488 92.2 447 6.4 414 1.4 33
OECD Average 499 89.7 468 5.8 449 4.5 19
Selected Countries Average 496.7 90.5 466.7 6.18 445.5 3.3 21.2 Old Democracies Average 511.6 88.6 458.8 6.9 436 4.4 22.8 New Democracies Average 481.8 92.4 474.6 5.4 455 2.2 19.6
Note: Data were obtained and calculated from the PISA 2009 database.
diferent backgrounds across immigrant cohorts; they could also signal positive educational and social mobility across generations (OECD, 2010c, p. 72).
Table 4: Reading achievement by immigrant status, before and ater accounting for economic, social and cultural status (ESCS) in selected countries.
Country
Diference between Native and Immigrant
Students before Accounting for ESCS
Diference between Native and Immigrant
Students ater Accounting for ESCS
Score Point Diference
Austria 67 37 30
Belgium 68 41 27
Finland 70 60 10
Germany 56 27 29
Norway 52 33 19
Croatia 18 10 8
Estonia 35 34 1
Hungary -12 -11 -1
Serbia -14 -18 4
Slovenia 47 24 23
OECD Average 43 27 16
Selected Countries Average 38.7 23.7 15
Old Democracies Average 62.6 39.6 23
New Democracies Average 14.8 7.8 7
Note: Data were obtained and calculated from the PISA 2009 database.
When examining and presenting performance diferences between immi-grant and native student groups in an international context, it is essential to consider the diferent background characteristics of immigrant populations across countries. Family cultural capital, socioeconomic status and other background characteristics relect situations at the time of immigration (Bourdieu, 1991, pp. 51-52) and also deter-mine the extent to which immigrants are able and willing to adapt to a new environ-ment (Stanat & Christensen, 2006, p. 59). In selected European countries, students with an immigrant background are in general socioeconomically disadvantaged,7
which explains part of the performance gap between these students and native stu-dents. Across OECD countries, immigrant students tend to have a socioeconomic background that is on average 0.4 of a standard deviation lower than their native peers (OECD, 2010c, p. 71). Accounting for ESCS explains 16 score points diference
between native and immigrant students in OECD countries (15 points in selected Eu-ropean countries). he link is particularly strong in old democracies such as Austria (30 points diference), Germany (29 points) and Belgium (27 points), but the difer-ence is also high in the new democracy Slovenia (23 points), whereas in Hungary, Estonia and Serbia ESCS does not negatively afect immigrant students’ performance. he data point with a degree of certainty to the type of immigration of the respective countries, as well as to the background characteristics of immi-grants. Nevertheless, large diferences might also allude to the discrimination and low inclusion of immigrants in, for example, the labour market.
Diferences in achievement accounted for by students’ socioeconomic status illustrate the signiicant inluence of immigrant students’ backgrounds. As a result, it is necessary to develop mechanisms that enable students with lower levels of cultural capital to attain this capital in school. Pedagogues (Mo-rais & Neves, 2010) suggest that better conditions for learning, as well as high expectations, are important for better results. However, economic, social and cultural status is not the only predictor of success in education: immigrant stu-dents score an average 27 points lower than native stustu-dents, even ater account-ing for ESCS, in the OECD and 23.7 points lower in selected countries.
Table 5: Reading achievement of native students and students with an immigrant background who speak a language other than the language of instruction at home.
Country Second Gen-eration Students Speaking An-other Language at Home Second Generation Students Speaking the Language of
Assessment at Home Achievement Diference: Second Gen-eration Students Speaking and not Speaking the Language of
Assessment at Home
Achievement Diference: Native
Students and Im-migrant Students
who Speak a Language other than the Language
of Assessment at Home, ater Ac-counting for ESCS % of Students Score Points % of Students Score Points
Austria 50.6 428 18,3 441 13 31
Belgium 27.4 422 24.2 480 58 48
Finland 28.4 476 15.9 C C 69
Germany 33.1 448 33.3 483 35 33
Norway 35.0 453 18.1 484 31 40
Croatia 1.4 C 65.8 466 C C
Estonia 9.7 454 82.9 472 18 50
Hungary 1.7 C 41.0 527 C C
Serbia 1.1 C 53.5 466 C C
Slovenia 41.9 439 40.3 466 27 27
OECD Average 20.7 462 32.3 481 19 35
general population. he abbreviation Cdenotes missing data (see notes for Table 2). Data were obtained and calculated from the PISA 2009 database.
Another factor important for immigrant students’ achievements is lan-guage, particularly when the language spoken at home is diferent from that used at school. Ater accounting for socioeconomic background, immigrant students whose households speak a language other than the PISA assessment language tested on average 35 points lower than non-immigrant students who spoke the instruction language at home. In selected countries, the diference is smaller by one point. he language spoken at home accounts for the high-est number of score points of immigrant students in Finland (69 points), Es-tonia (50 points) and Belgium (48 points). It also explains a diference of 27 score points or more in other countries, except in Croatia, Hungary and Serbia, where the share of students speaking a diferent language at home is very small. In Hungary, slightly more than 6% speak a diferent language at home, and in Croatia and Serbia the share is 3% or less.
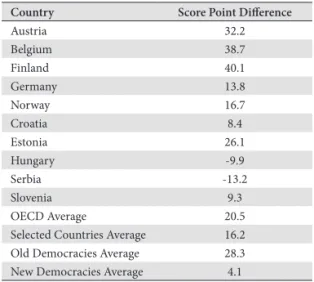
Table 6: Score point diferences in reading achievement for immigrant students ater accounting for enjoyment in reading and summarising strategies.
Country Score Point Diference
Austria 32.2
Belgium 38.7
Finland 40.1
Germany 13.8
Norway 16.7
Croatia 8.4
Estonia 26.1
Hungary -9.9
Serbia -13.2
Slovenia 9.3
OECD Average 20.5
Selected Countries Average 16.2 Old Democracies Average 28.3 New Democracies Average 4.1
Note: Data were obtained and calculated from the PISA 2009 database.
girls in reading and suggests that diferences in the way boys and girls approach learning, and how engaged they are in reading, account for most of the gap in reading performance(OECD, 2010d, p. 13). Stanat and Christensen (2006) claim that the PISA 2003 assessment depicts immigrant students as motivated learners and learners with positive attitudes toward school. Such motivation can hardly persist if the student does not enjoy reading. A review of the PISA 2009 assessment shows that in OECD countries immigrant students on average demonstrate lower levels of enjoyment in reading and use less eicient summa-rising strategies, both possibly contributing to decreased results of 20.5 points. he link is particularly strong in Finland, where engagement in reading and learning strategies account for 40.1 score points, although it also exceeds 30 points in Austria and Belgium. In Slovenia, immigrant students would perform 9.3 points better if they reached the same level of enjoyment and awareness of learning strategies as native students. In Croatia, Hungary and Serbia, immi-grant students enjoy reading and use afective learning strategies to a similar extent as native students. It is important to recall that immigrant students in the latter three countries have on average a similar socioeconomic status to their native peers, and that they nearly all speak the language of instruction at home as well. he importance of these factors is conirmed by the low achieve-ment gaps between native and immigrant students in all three countries. Be-cause learning dispositions tend to be co-dependent with language proiciency, countries where language and enjoyment in reading account for diferences between immigrant and native students should put more efort into improving the learning strategies and language skills of immigrant children, in order to, in turn, raise their level of learning enjoyment. In addition, children’s aspirations oten depend on the aspirations of their parents and those related to their socio-economic status (Rothon, 2007, p. 315), which again indicates the importance of the overall inclusion of immigrants in society.
Croatia, Serbia and Slovenia in the Migration Regime
Context
Assuming an accurate explanation of the respective diferences and similarities in education achievements requires more than just a European, so-cialist or Yugoslav comparison and context, the present section analyses the educational achievement of immigrant students in Slovenia, Croatia and Ser-bia, taking into account national peculiarities. he three countries with state-historical, linguistic and cultural ties are – twenty years ater Yugoslavia8 - new
European democracies and, ater wars, partitions, etc, the strongest economies emerging from the former common state. hey are, however, also countries with considerable diferences in their development and comparative educa-tional achievements. What is more, they have diferent immigration histories.
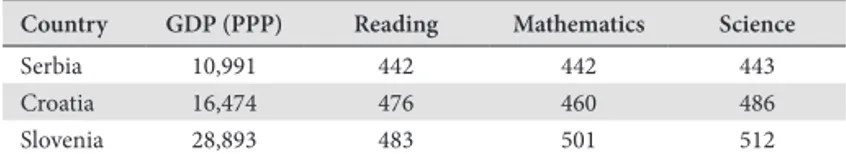
Table 7: GDP (PPP) per capita and average PISA achievements (score points) in Croatia, Serbia and Slovenia.
Country GDP (PPP) Reading Mathematics Science
Serbia 10,991 442 442 443
Croatia 16,474 476 460 486
Slovenia 28,893 483 501 512
Note: Data on GDP (PPP) are presented in International Dollars and were obtained from the World Economic Outlook Database (International Monetary Fund, October 2008). Reading
results were obtained from the PISA 2009 database, mathematics results from the PISA 2003 database, and science results from the PISA 2006 database.
We see that GDP (PPP) per capita for Slovenia is more than double of Serbia’s, while the GDP (PPP) per capita for Croatia is in between the two. heir PISA results are distributed in the same manner: Slovenia has the highest GDP and the highest average PISA results. However, Slovenia also demonstrates the largest diference between native and immigrant students’ achievement in read-ing, with an exceptionally low proportion of irst generation immigrant stu-dents reaching at least level 3 of reading proiciency. In Croatia, where GDP is somewhat lower than in Slovenia, the achievement gap between immigrant and native students is relatively small. Serbia has the lowest GDP of the three coun-tries, and immigrant students in Serbia perform better than their native peers.
Table 8: Reading achievement of native students compared to the average immigrant achievement in Croatia, Serbia and Slovenia (score points).
Country Native Students Immigrant Students
Serbia 443 457
Croatia 479 462
Slovenia 489 447.5
Note: Data were obtained from the PISA 2009 database.
Providing context for the PISA 2009 results in Serbia, Croatia and Slove-nia ofers some immediate explanations of the results. he facts presented indi-cate that the higher achievement of immigrant students in Serbia, the relatively small gap in Croatia and the considerable diference in Slovenia is not solely a function of the economy. It is also clear that the increased achievement gap is not a result of smaller diferences between native and immigrant students in formerly socialist countries. Another possibility could be that the results are a function of diferent education systems. Previous research suggests that a late school starting age and early school diferentiation have a negative impact on the achievement of immigrant children (Crul & Schneider, 2009; Schütz & Wöß-mann, 2005). However, comparison reveals that all three systems have main-tained their former structure, including prolonged primary education. he wid-er inclusion of children in Slovenia in pre-primary education9 and the structure of the education systems, including their inclusiveness, do not support the idea of any diference occurring as a result of diferent educational arrangements.
hus, another hypothesis emerges: in migration regimes, one should search for an explanation of diferent immigrant students’ achievements before consid-ering the educational reasons for the diference. Even though coherent national models of integration or incorporation are elusive (Freeman, 2004, p. 945), ren-dering it diicult to present coherent migration regimes, such categorisation can serve as a helpful tool in understanding state policies and their efects, even if they are not part of wider strategies. Coherence is not as important to this inquiry as the consequences of policies, practises or reactions in relation to questions of who
9 According to the Statistical Oice of Republic of Slovenia, 73.9% of children of an appropriate
age were included in pre-primary education in the school year 2009/2010 (http://www.stat. si/eng/novica_prikazi.aspx?id=3139). he Ministry of Science, Education and Sports of the
immigrates and why, and how immigrants are included and accepted in society.
Table 9: Share of immigrant students and reading achievement in Croatia, Serbia and Slovenia.
Country
Native Students First Generation
Students
Second Generation Students
First and Second Generation
% Score
Points %
Score
Points %
Score
Points %
Score Points
Croatia 89.3 479 3.5 452 7.2 465 10.7 461
Serbia 90.5 442 4.3 446 5.2 466 9.5 457
Slovenia 92.7 488 1.4 414 6.4 447 7.8 441
Note: Data were obtained and calculated from the PISA 2009 database.
Croatia and Serbia have only recently become countries of wider immi-gration. hey faced massive, mainly forced, migration following the wars in the 1990s. On the other hand, Slovenia was and is a country of low skilled labour immigration, which is procured directly via work permits for certain profes-sions only.10 What does PISA indicate in this regard? here are no considerable
diferences in the proportion of immigrant population in the respective coun-tries; however, Croatia and Serbia have an important share of irst generation students (33% and 45% of all immigrant students). Combining these facts with immigration statistics suggests that most immigrant students in Croatia and Serbia have a history of forced migration in their families. By contrast, Slovenia has only 18% irst generation immigrant students (cal. from OECD, 2010b, p. 170), and nearly all of them are children of labour immigrants.
Table 10: Native and immigrant students’ reading achievement before and ater accounting for economic, social and cultural status.
Country Diference in ESCS between
Na-tive/Immigrant Students
Immigrant Students’ Score Points Diference ater Accounting for ESCS
Croatia 0.26 8
Serbia 0.11 4
Slovenia 0.62 23
OECD Average 0.44 16
Note: Data were obtained from the PISA 2009 Database.
10 At the beginning of 2009, 14.6% of persons in employment in Slovenia were born abroad.
Comparing the economic, social and cultural statusof immigrant and native students in the respective countries (Table 10), the diferences are the highest in Slovenia, where ater accounting for ESCS the gap narrows to 23 points (8 points in Croatia and 4 points in Serbia). Even if forced migration is unplanned and unpredicted, it seems that it involves people whose average so-cioeconomic status is higher than in the case of low skilled labour immigration. However, PISA assessments do not gather data on the ESCSof immigrants at the time they entered the country. Furthermore, the socioeconomic position of immigrant families also depends on their further inclusion in society.
Castels (1995) deines three broad approaches to ethnic diversity, all of which are closely linked to historical patterns of nation-state formation: diferential exclusion (most clearly expressed in countries with “guest worker” immigration), assimilation (post-colonial countries) and multiculturalism (Australia, Canada, Sweden, USA). Applying this model to the PISA assessment results, immigrant students in general perform best in multicultural societies and worse under the pressure of diferential exclusion. he latter best describes the Slovenian pattern of integration. Croatia and Serbia may be classiied by introducing a further devel-oped and diferentiated concept of “new immigration states” (cf. OECD, 2006, pp. 18-21; OECD, 2010f, pp. 24-27), with immigration speciied as forced, of a wide social spectrum, with little or no language distance and occurring as part of a process of ethnic homogenisation. As a result, the inclusion of immigrants in Croatia and Serbia was faster and less problematic than in Slovenia. Since most immigrants were ethnic Croats or Serbs, they integrated and gained citi-zenship rights quickly. In Croatia in 1991 and 1992, more than 400,000 refugees from Bosnia and Herzegovina registered; it is estimated that 120,000 of these acquired Croatian citizenship (UNHCR, 2010).11 In 1996, Serbia received more
than half a million refugees, most of them ethnic Serbs from Croatia and Bos-nia and Herzegovina; more than 200,000 of them gained Serbian citizenship (Republika Srbija, 2008).12 On the other hand, immigrants in Slovenia are not
11 he Croatian census from 2011 reveals that the largest group of residents born outside the country were born in Bosnia and Herzegovina (456,580), Serbia and Monte Negro (86,830),
Slovenia (21,985) and Macedonia (10,329); other countries do not achieve a igure of 10,000 people. (Kupiszewski, 2010, p. 121.)
ethnic Slovenes. hey struggle for years to obtain citizenship13 and are excluded
from equal participation in the labour market and other spheres of social life, such as political participation. Of nearly 170,000 residents born in another country, the vast majority were born in one of the republics of former Yugo-slavia14 (SURS, 2002). Recalled data from PISA 2009 that are complementary
to the statistics presented above: 3% of immigrant students in Croatia and 2.7% in Serbia report that they speak a language other than the language of instruc-tion at home. In Slovenia, the share is considerably higher: 13.5% among irst generation and 41.9% among second generation students. By accommodating to the language of instruction and the rationale of national education, second generation students in Slovenia have closed the gap between themselves and native students by three quarters of a school year. his diference is consider-ably smaller in Croatia (14 points), while in Serbia irst generation immigrant students already outperform their native peers (Table 9). Here again diferences in the results arise from diferences in migration regimes and from the back-ground characteristics of the immigrant population.
It is important to note that the immigration regime in Slovenia was15 and is considered similar to German “guest worker” immigration. Slovenia has long considered immigrants to be “foreigners” and “others” whose presence is not permanent. Societal integration such as inclusion, education and enabling a place for immigrants to maintain an identity other than Slovenian have not been prime social or political goals. In parallel, in the time of Yugoslavia, im-migrants did not perceive Slovenia as a foreign country; while it actually wasn’t, their approach to teaching the Slovenian language and to education in general was indiferent. For the Slovenian population, political stratum, as well as for immigrants themselves, immigrants were and were not immigrants and none of them clearly decided how to treat the new situation (Kobolt, 2002). Ater the breakup of Yugoslavia, the political situation changed; Slovenia oicially became a foreign country, but the relationship of native Slovenes towards im-migrants and vice-versa did and did not change – both feel historically and
13 While most inhabitants with immigrant backgrounds do eventually receive Slovene citizenship (Bešter, 2003, p. 282), the “guest worker” logic persists. In 2010, a total of 40,688 work permits were issued; most people with these permits were workers who had already been working in
Slovenia for some time and were merely extending their employment (Employment, 2011). 14 67,670 were born in Bosnia and Herzegovina, 49,418 in Croatia, 6,437 in Yugoslavia (now the
independent countries of Serbia and Monte Negro) and 27,238 in Macedonia. (SURS, 2002). 15 From 1962 to 1990, some 270,000 immigrants from other Yugoslav republics moved to Slovenia
culturally connected, while at the same time treating each other as diferent. In a way, this makes the situation schizophrenic: achievement diferences of immigrant students are identiied but not properly addressed. he story is dif-ferent in the case of migration to Croatia and Serbia. here the immigration was mostly part of the enforced process of ethnic homogenisation. Accordingly, educational integration in Serbia and Croatia was conceptually and linguisti-cally less problematic than in Slovenia.
Conclusion
Achievement gaps between immigrant and native students indicate fail-ures in assuring educational equity in most countries assessed by PISA 2009 (42 score points in the OECD on average). Diferences of this extent put the future prospects of considerable and growing parts of the population, and the societies in which they live, at potential risk.
Analyses of PISA 2009 results for 10 selected European countries (Aus-tria, Belgium, Croatia, Estonia, Finland, Germany, Hungary, Norway, Serbia and Slovenia) reveal that on average native students perform better in old democracies. However, the achievement gap between native and immigrant students is on average larger in old democracies than in post-socialist coun-tries. he presented observation suggesting that the divide between old and new democracies could be one of the explanatory mechanisms is, however, also misleading, as, especially in the group of post-socialist countries, results vary considerably. Whereas the gaps in Estonia (35 points) and Slovenia (47 points) are close to the OECD average, the diference is considerably smaller in Croatia (18 points), while in Hungary and Serbia immigrant students perform better than native students.
Moreover, neither exceptionally good overall performance nor small achievement gaps guarantee a larger share of students with immigrant status achieving proiciency level 3, which promises professional success in the future. According to this criterion, old and new democracies perform similarly badly. For example, in Finland, the share of all students reaching proiciency level 3 is exceptionally high (76.1%), and even though it is low in Serbia (33.6%), the total proportion of immigrants reaching level 3 or more is similar in both countries (40.5% and 34.4% respectively).
particularly strong in Finland, Estonia and Belgium, and plays an important role in other countries, with the exception of Croatia, Hungary and Serbia, where the percentage of immigrant students speaking another language at home is low (6.6% in Hungary and 3% or less in Croatia and Serbia). From the results presented, initial policy recommendations can already be drawn. he governments of countries where the socioeconomic background of immi-grants plays a signiicant role in the achievement of immigrant students should consider strengthening the socioeconomic position of immigrant families and should reconsider their inclusion policies. Where language proiciency plays a role, eforts should focus on improving immigrants’ language skills. Language proiciency can also afect attitudes toward learning in general and impact the use and development of efective learning strategies, which is why immigrant students should be additionally encouraged to actively participate in the school process.
References
Bourdieu, P. (1991). Language and Symbolic Power. Harvard: HUP.
Castels, S. (1995). How nation-states respond to immigration and ethnic diversity. Journal of Ethnic
and Migration Studies, 21(3), 293-308.
Crul, M., & Schneider, J. (2009). Children of Turkish Immigrants in Germany and the Netherlands:
he Impact of Diferences in Vocational and Academic Tracking Systems. Journal of Teachers College
Record, the Voice of Scholarship in Education,11(6), 1508-1527.
DfES (2005). Ethnicity and Education: he Evidence on Minority Ethnic Pupils Aged 5-16. London: HMSO.
Employment Service of Slovenia (2011). 2010 Overview. Ljubljana: Employment Service of Slovenia. Freeman, G. P. (2004). Immigrant Incorporation in Western Democracies. International Migration
Review, 38(3), 945-969.
Gillborn, D., & Mirza, H. (2000). Educational Inequality: Mapping Race, Class and Gender. London:
Oice for Standards in Education.
Huttova, J., McDonald, C., & Harper, C. (2008). Making the Mark? An Overview of Current
Challenges in the Education of Migrant, Minority, and Marginalized Children in Europe. New York: OSI.
Kobolt, A. (2002). Zdej smo od tu. Ljubljana: i2
Kristen, C., & Granato, N. (2007). he educational attainment of the second generation in Germany: Social origins and ethnic inequality. Ethnicities, 7(3), 343-66.
Kupiszewski, M. (2010). Labour Migration Patterns, Policies and Migration Propensity in the Western
Balkans. Warsaw: IOM.
Liebig, T., & Sousa-Poza, A. (2004). Migration, Self-Selection and Income Inequality: An International Analysis. KYKLOS, 57(1), 125-146.
Morais, A. M., & Neves, I. P. (2010). Texte éducatifs et contexts favorisant l’apprentissage. Optimisation d’un modèle de pratique pédagogique. In D. Frandji, & P. Vitale (Eds.), Actualité de
Basil Bernstein – Savoir pédagogie et société. Rennes: PUR.
OECD (2006). Where Immigrant Students Succeed: A Comparative Review of Performance and
Engagement in PISA 2003. Paris: OECD Publishing.
OECD (2007). PISA 2006: Science Competencies for Tomorrow’s World. Vol. 1: Analysis. Paris: OECD. OECD (2010a). PISA 2009 at a Glance. Paris: OECD Publishing.
OECD (2010b). PISA 2009 Results: What Students Know and Can Do – Student Performance in
Reading, Mathematics and Science (Volume I). Paris: OECD Publishing.
OECD (2010c). PISA 2009 Results: Overcoming Social Background – Equity in Learning Opportunities
and Outcomes. Paris: OECD Publishing.
OECD (2010d). PISA 2009 Results: Learning to Learn – Student Engagement, Strategies and Practices.
Paris: OECD Publishing.
Paris: OECD Publishing.
OECD (2011). Lessons from PISA for the United States: Strong Performers and Successful Reformers in
Education. Paris: OECD Publishing.
Republika Srbija, Komesarijat za izbeglice (2008). Stanje i potrebe izbegličke populacije u republici
Srbiji. Retrieved 29. 07. 2011 from http://www.kirs.gov.rs/docs/StanjeIPotrebeIzbeglickePopulacije. pdf.
Rizman, R. (1999). Radical Right Politics in Slovenia. In S. P. Ramet (Ed.), he Radical Right in
Central and Eastern Europe since 1989 (pp. 147–170). Pennsylvania: Pennsylvania State University Press.
Rothon, C. (2007). Can achievement diferentials be explained by social class alone? An examination
of minority ethnic educational performance in England and Wales at the end of compulsory schooling. Ethnicities, 7(3), 306-322.
Schütz, G., & Wößmann, L. (2005). Wie lässt sich die Ungleichheit der Bildungschancen verringern?
ifo Schnelldienst, 58(21), 15-21.
Simon, P. (2003). France and the unknown second generation: Preliminary results on social mobility.
International Migration Review, 37(4), 1091-1119.
Stanat, P., & Christensen, G. (2006). Where immigrant students succeed - a comparative review of
performance and engagement in PISA 2003. Paris: OECD.
SURS (2002). Popis prebivalstva, gospodinjstev in stanovanj 2002: Priseljeni v Slovenijo po letu
priselitve, državi prvega prebivališča in spolu. Retreived 29. 07. 2011 from http://www.stat.si/ popis2002/si/rezultati/rezultati_red.asp?ter=SLO&st=16.
SURS (2010). Socioeconomic Characteristics of Population (1 January 2009) and of International Migrants (2009), detailed data, Slovenia - inal data. Retrieved 29. 07. 2011 from http://www.stat.si/
eng/novica_prikazi.aspx?id=3642.
UNCHR (2010). Submission by the United Nations High Commissioner for Refugees for the Oice
of the High Commissioner for Human Rights’ Compilation Report-Universal Periodic Review: he Republic of Croatia. Retrieved 29. 07. 2011 from http://www.internal-displacement.org/8025708F00
4CE90B/%28httpDocuments%29/031701D196320550C12577BB00334845/$ile/UNHCR,+Submissio n+by+the+United+Nations+High+Commissioner+for+Refugees+for+the+Oice+of+the+High+ Commissioner+for+Human+Rights+Compilation+Report+UPR+he+Republic+of+Croatia,+Mar
Biographical note
Iztok Šori is a researcher at the Department of Sociology of the Fac-ulty of Arts, University of Ljubljana. His main research interests are: equity and equality, migration, traicking in persons and prostitution. Contact: iztok. sori@gmail.com.
Nika Šušterič is a student of Special and Rehabilitation Education at the Faculty of Education, University of Ljubljana. Contact: susteric.nika@ gmail.com.