doi: 10.1590/S1984-46702011000500011
The caatinga, with an area of 735,000 km², covers most of the northeastern Brazilian territory. Located between lati-tudes 2°54’S and 17°21’S, it extends through the dry valley from the middle Jequitinhonha River, in the state of Minas Gerais. The typical caatinga vegetation is characterized by xerophytic, deciduous arboreal and shrub formations, with trees and shrubs bearing thorns (PRADO 2003, LEAL et al. 2005).
PRADO & GIBBS (1993) characterized the caatingas from the Brazilian Northeast as one of the largest areas of Seasonal Neotropical Dry Forests (SNDF) in South America. Other large SNDFs can be found in Misiones and Piedmont nuclei, and on the Caribbean coasts of Colombia and Venezuela. Smaller and more isolated SNDFs occur in dry valleys in the Andes in north-ern Bolivia, Peru, southnorth-ern Ecuador and the adjacent northnorth-ern Peru, Mato Grosso de Goiás in central Brazil, and scattered throughout the Brazilian Cerrado in areas of fertile soils (RATTER et al. 1978). SNDFs in the Neotropical region also occur in Mesoamerica, and in Florida (PENNINGTON et al. 2006).
The diversity, species richness and number of endemic species in the caatinga region have for a long time been con-sidered low (e.g., VANZOLINI et al. 1980, ANDRADE-LIMA 1982, PRANCE 1987). However, some recent studies have revealed significantly higher species richness in the region. As a consequence, the
need to preserve this important component of the Brazilian biodiversity has been widely acknowledged (LEALet al. 2003, SILVA et al. 2004, LEAL et al. 2005). The true number of species in the caatinga region, however, is potentially much greater than the present estimates, because 41% of the region has never been surveyed, and 80% of it has been only poorly investigated (TABARELLI & VICENTE 2004).
Even though the caatinga has been identified as an im-portant area of endemism for South American birds (MULLER 1973, CRACRAFT 1985, HAFFER 1985, RIZZINI 1997), the distribu-tion, evolution and ecology of its avifauna have been poorly investigated (SILVA et al. 2003).
Recently, SANTOS (2004) discussed the ecological prefer-ences of birds in two caatinga physiognomies in the state of Piauí. OLMOS et al. (2005) also discussed and compared the avi-fauna in different physiognomies in the states of Pernambuco and Ceará. However, our knowledge of how bird diversity is maintained in different caatinga environments is still incipi-ent. This biome has a variety of habitats and is subjected to extensive anthropic alterations.
In this study we present the results of a rapid survey in a caatinga area in the backwoods of the state of Alagoas, and discus the avifauna composition of the different environments we found.
Birds from open environments in the caatinga from state of Alagoas,
northeastern Brazil
Helder Farias Pereira de Araujo
1& Roberta Costa Rodrigues
21 Departamento de Ciências Biológicas, Centro de Ciências Agrárias, Universidade Federal da Paraíba. Campus II,
58397-000 Areia, PB, Brazil. E-mail: [email protected]
2 Programa de Pós-Graduação em Biologia Animal, Universidade Federal de Pernambuco. Cidade Universitária,
50670-901 Recife, PE, Brazil. E-mail: [email protected]
ABSTRACT. Even though the caatinga has been identified as an important area of endemism for South American birds, few studies have been conducted on the distribution, evolution and ecology of birds in this biome. Understanding how habitats contribute to maintain the regional bird diversity is extremely important. In this study, carried out in the backwoods of the state of Alagoas, we present a rapid survey of a caatinga area and discuss the composition of the avifauna in different habitats. From the record of 105 species, we estimated a local richness of 120 (± 5) species. Among the areas surveyed, the dense caatinga shrub areas contributed with more than 42% of the species, holding most of the forest-dependent birds. The open field areas and the vegetation patches contributed 26 and 24% of the observed richness, respectively. The bird community at the vegetation patches is more similar to that registered in the open caatinga shrub areas, than to the fauna of the open fields where these patches are located. Our results support the need to conserve environments which harbor typical caatinga vegetation, and also vegetation patches with those character-istics in greatly altered environments.
MATERIAL AND METHODS
We carried out our sampling at the adjacencies of the BR-316 road between the cities of Canapi and Inajá (37°40’21”W and 9°5’55”S), at the borders between the states of Alagoas and Pernambuco, at an area of approximately 63 km (Fig. 1). This area is inserted among the caatinga eco-regions from Planalto da Borborema and Depressão Sertaneja Sentetrional. It is also adjacent to the Raso da Catarina region (VELOSO et al. 2002).
utes, totaling 36 point counts in each season. During the point counts, conducted during the first three hours in the morning, sounds and visual records and counts of birds were marked at a 50 m fixed radius and at an unlimited radius (Adapted from HUTTO et al. 1986). We also conducted observations in random spots along the sampled road.
We grouped the recorded species into three categories according to habitat use, as follows: (IND) Independent: spe-cies associated only with open vegetation; (SMD) Semi-depen-dent: species occurring in mosaics formed in the contact areas between forests and open and semi-open vegetation; (DEP) Dependent: species found in forest habitats. Such classifica-tion was based on literature informaclassifica-tion (SILVA 1995, STOTZ et al. 1996, SILVA et al. 2003). Nomenclature follows CBRO (2009). We calculated the relative abundance (average number of individuals/point X 100) and frequency of occurrence of each species from records obtained within a 50 m radius, as well as the frequency of occurrence of data from unlimited radius, as recommended in an evaluation of the caatinga by the first author and collaborators (H.F.P. de Araujo unpubl. data). The total number of species observed at the point counts (Sobs) was represented by a rarefaction curve. The performance of this curve can help estimate the number of species that have not yet been observed in the study area (CHAZDON et al. 1998). To make this estimate, we used the Chao2 and Jack 1 richness estimators, which have performed better in the caatinga (H.F.P. de Araujo unpubl. data). The rarefaction curve and estimated richness were calculated using the software EstimateS 7.5 (COLWELL 2005).
Diversity measures and descriptive statistics were used to compare the avifauna and the percentage distribution of the categories of habitat use in the registered environments. Such environments were classified as: open caatinga (21 point Our sampling sites broadly correspond to two
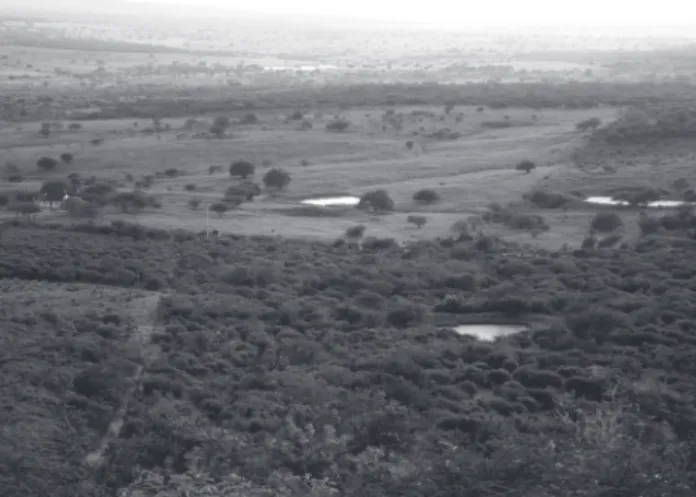
physiog-nomic landscapes. In the northern part of the road, on the mountains, the caatinga has open vegetation with shrubs and small trees, and some larger trees among them. In the surveyed central and southern parts of the road, we find open fields con-sisting of pastures and subsistence agricultural crops, with some shrub patches (Fig. 2). These open caatinga areas have been altered by wood removal, trails, and the presence of animals such as goats.
Sampling took place in January and May 2008, during the dry and rainy seasons, respectively. We applied 72 point counts, 200 m apart from one another, each lasting 10 min-Figure 1. Location of the study area. BR 316 (black line) and sampled area (white line) are detached.
counts sampled), open field (23 point counts), shrub patches in open fields (19 point counts) and aquatic environments (9 point counts).
In order to compare the proportion of each bird species in each of the different environment sampled, we used the Shannon’s diversity index estimate and 95% confidence inter-vals in each habitat. This estimate technique is based on sam-pling coverage and also includes species which were expected but not sampled (CHAO & SHEN 2003). These calculations and the Shannon estimates were performed using the SPADE – Spe-cies Prediction and Diversity Estimation software program and 95% confidence intervals (CHAO & SHEN 2003, 2005).
We compared the avifauna composition among differ-ent environmdiffer-ents using the Jaccard’s similarity index based on estimates, with abundance data. This index was modified from the classical Jaccard index by CHAO et al. (2005). The latter have adapted the Jaccard index to deal with abundance data, and have developed algorithms to calculate similarities between two assemblies that also take into account species which were not sampled. To this procedure uses “singletons” (species repre-sented by only one individual) and “doubletons” (species rep-resented by exactly two individuals). All similarity analysis was performed using the SPADE software. The similarity matrix obtained was subjected to ordination analysis using multidi-mensional scaling (MDS).
RESULTS
Using point counts and unsystematic observations, we recorded 105 bird species distributed in 38 families. Tyrannidae, with 20 registered species, was the most ubiquitous family, fol-lowed closely by Emberizidae (nine species) and Columbidae (six species).
Using the systematic method of point counts, we counted 97 bird species, representing 93.2% of the total previously re-corded for the area (Appendix 1). The rarefaction curve has shown that more, unrecorded species occur in the study area. However, a total species richness of about 120 (± 5) can be estimated with Chao2 and Jack 1 estimators (Fig. 3).
The number of species observed in the rainy period rep-resents 90.4% of the total number of species registered. In the dry season, by contrast, only 76.9% of the total number of species was found. The abundance curves of the species regis-tered in the two seasons are shown in figure 4. Two species, Sturnella superciliaris (Bonaparte, 1850) and Pitangus sulphuratus (Linnaeus, 1766), were amongst the five most abundant spe-cies only in the dry season. Zonotrichia capensis (Statius Muller, 1776) and Sicalis luteola (Sparrman, 1789), by contrast, appeared among the five most abundant during the rainy season only.
We recorded 11 species with restricted distribution in Bra-zil, according to RIDGELY & TUDOR (1994), SICK (1997) and RIDGELY et al. (2005). Seven are typical species from the Brazilian North-east: Caprimulgus hirundinaceus Spix, 1825 – typical species from
the caatinga region, registered in northern Espírito Santo (RIBON 1995); Pseudoseisura cristata (Spix, 1824) – endemic species which has been separated from the old combination Pseudoseisura cristata unirufa, and which occurs in the Pantanal and in Bolivia (ZIMMER & WHITTAKER 2000); Thamnophilus capistratus Lesson, 1840 – recently validated within the T. doliatus (Linnaeus, 1764) com-plex (ASSISet al. 2007); Compsothraupis loricata (Lichtenstein, 1819); Sporophila albogularis (Spix, 1825) – only two other records are from locations in northern Goiás and Mato Grosso (SILVA 1995); Paroaria dominicana (Linnaeus, 1758) and Agelaioides fringillarius (Spix, 1824). Two species are restricted to eastern Brazil: Heliomaster squamosus (Temminck, 1823) and Cantorchilus longirostris (Vieillot, 1819). Two other species have a slightly wider distribution in the Brazilian central-eastern territory: Nystalus maculatus (Gmelin, 1788) and Cyanocorax cyanopogon (Wied, 1821).
The areas from open caatinga have contributed with more than 42% of the observed species richness. In these areas, most species that are at least partially dependent on forest environ-ments were also observed (Fig. 5). The open fields, and shrub
0 20 40 60 80 100 120 140 160 180
1 6 11 16 21
Point counts number
Species
number
26 31 36 41 46 51 56 61 66 71 Sobs Chao 2 Jack 1
Coryphospingus pileatus Columbina picui
Columbina picui Zonotrichia capensis Sicalis luteola Pitangus sulphuratus
Species number
Individuals
per
point
3.5
3.0
2.5
2.0
1.5
1.0
0.5
0
Sporophila albogularis
Coryphospingus pileatus Sturnela sperciliares Sporophila albogularis
0 10 20 30 40 50 60 70
Figure 4. Abundance curve of bird species recorded with point counts (fixed radius of 50 m). Dry season (white squares) and rainy season (black circles).
patches found in the open fields contributed with about 26 and 24% of the observed richness, respectively. However, the percentages of species that are at least partially dependent on forests were greater in patches than in open fields (Fig. 5).
are inserted (Fig. 7). As expected, the avifauna composition of the aquatic environments differed from those of all other habi-tats the most.
Open caatinga Open field Shrub patches Aquatic environments IND SMD DEP Richness
Recorded
species
(%)
80
70
60
50
40
30
20
10
0
The estimated diversity index was significantly higher in the open caatinga areas than in any of the other habitats. The values of this index were greater in the open field areas and shrub patches than in the aquatic environments, but did not differ significantly from one another (Fig. 6).
Figure 5. Percentage of species richness and their categories of habitat use in the recorded habitats. Categories of habitat use: IND. forest independent, SMD. forest semi-dependent, DEP. for-est dependent.
Figure 6. Estimate of Shannon’s diversity index of bird species re-corded in each environment. The bars indicate the confidence intervals of 95%.
Open caatinga Open field Shrub patches
Estimated
Shannon
’s
Index
Water bodies 1.2
1.4 1.6 1.8 2.0 2.2 2.4 2.6 2.8 3.0 3.2 3.4 3.6 3.8 4.0
The avifauna composition in the shrub patches was more similar to the avifauna registered in the open caatinga areas than to that found in the open fields where the shrub patches
open caatinga
open field
shrub patches
aquatic environments
-1.0 -0.8 -0.6 -0.4 -0.2 0.0 0.2 0.4 0.6 0.8 1.0 1.2 1.4 1.6 -0.8
-0.6 -0.4 -0.2 0.0 0.2 0.4 0.6 0.8 1.0 1.2
0.7773 0.5004 0.3908 <0.031
Stress: 0,00
The differences and similarities among open caatinga, shrub patches and open fields can be demonstrated using their most abundant species. Approximately after the 10th most
abun-dant species, there is a sharp fall in the species abundance curves for open field and shrub patches. For this reason, we used the 10 most abundant species to compare among the habitats (Figs 8-11). Four species were among the 10 mostabundant in the three habitats: Columbina picui (Temminck, 1813), Mimus saturninus (Lichtenstein, 1823), Zonotrichia capensis (Statius Muller, 1776) and Sporophila albogularis (Spix, 1825). The abun-dance curve of the open caatinga area shows a more equitable distribution when compared with the other two habitats. This area has four exclusive species among the 10most abundant: Pseudoseisura cristata (Spix, 1824), Stigmatura napensis Chapman, 1926, Tyrannus melancholicus Vieillot, 1819 and Progne tapera (Vieillot, 1817). The record of Progne tapera among the most abundant may be the result of the presence of a single flock in the area. The open field area also presents four exclusive spe-cies among the 10 most abundant: Pitangus sulphuratus (Linnaeus, 1766), Ammodramus humeralis (Bosc, 1792), Sicalis luteola (Sparrman, 1789) and Sturnella superciliaris (Bonaparte, 1850). Even in the shrub patches, only Polioptila plumbea (Gmelin, 1788) appears exclusively among the 10most abun-dant, the others are among the most abundant in both open caatinga and open field areas (Figs 8-11).
DISCUSSION
The great number of species in Tyrannidae, Emberizidae and Columbidae had been previously observed in other com-munities in the caatinga by TELINO-JÚNIOR et al. (2005) and ROOS et al. (2006). NASCIMENTO et al. (2000) and SANTOS (2004) also recorded the Tyrannidae and the Emberizidae among the three largest families in their surveys. However, the Thamnophilidae, Furnariidae, Trochilidae and Accipitridae in the first, and Thamnophilidae, Furnariidae in the second, were better repre-sented than the Columbidae; in OLMOSet al. (2005) the Trochilidae was better represented than Emberizidae and Columbidae. In those examples, only in the Chapada do Araripe – Ceará (NASCIMENTO et al. 2000) and areas in Piauí (SANTOS 2004) a pattern for the best represented families that resembles the pattern found for the entire caatinga (SILVA et al. 2003) has been found. Thus, even though some species seem to occur only in certain areas and have restricted distribution, they are impor-tant representatives of the regional richness.
The estimated richness of 120 (+5) species is comparable to that found in previous surveys conducted in areas of the
caatinga. Bird counts in protected areas, however, have revealed a higher richness of species, as follows: OLMOS (1993) registered 208 species in Serra da Capivara, Piauí; NASCIMENTO et al. (2000) registered 193 species in Chapada do Araripe; NASCIMENTO (2000) registered 154 in the Estação Ecológica de Aiuaba, Ceará; LIMA et al. (2003) registered 191 in the Raso da Catarina, Bahia; TELINO -JUNIOR et al. (2005) have registered 145 species in a private re-serve in the state of Paraíba; and FARIAS et al. (2006) registered 193 species in Serra das Almas, Ceará. Also, higher species rich-ness (155 species) have been reported by SANTOS (2004) for un-protected caatinga areas in Piauí; by ROOS et al. (2006) (145 species) in the Sobradinho region, Bahia, and by FARIASet al. (2006) (65species) in Betânia, Pernambuco. In the Ecological Station from Seridó, Rio Grande do Norte, NASCIMENTO (2000) registered 116 bird species, a number similar to ours. However, when our results are compared with the species richness esti-mated for other locations under human impact, they are equiva-lent or lower. For instance, OLMOS et al. (2005) after surveying eight areas in the states of Ceará and Pernambuco, found 96, 109, 102, 101, 72, 93, 94 and 125 species; FARIAS et al. (2006) found 94 species in the Curimataú, Paraíba; and FARIAS (2007) Figures 8-11. (8) Abundance curves of recorded species in each habitat and the ten species more abundant; (9) open caatinga; (10) open field; (11) shrub patches.
Individuals per point Open caatinga Open field Shrub parches Species number
0 10 20 30 40 50 60 70
listed 106 in Caraíbas, 92 in Brígida, 58 in Icó Mandante and 56 species in Apolônio Sales, Pernambuco. Even though these comparisons may not be appropriate because curves based on effort and/or estimates is lacking for several contributions, they offer an overview of the distribution of species richness in a geographical scale, which is consistent with the conservation status of different areas.
Species that varied considerably in abundance between the dry and rainy season, for instance S. superciliaris, P. sulphuratus, Z. capensis and S. luteola, are not known to be mi-gratory. Their variation in abundance can be explained by changes in their spatial distribution between seasons. Some species may be found grouped in habitats where resources are concentrated during the dry period and spaced across the land-scape in the rainy season, when resources and humidity are more widely available (SILVA et al. 2003, OLMOS et al. 2005). How-ever, our results have revealed the importance of conducting systematic studies over a longer period of time in the caatinga in order to understand more fully the dynamics of frequency and abundance of bird species.
Our lack of knowledge about inter-tropical migrations and other smaller scale displacements makes it difficult for us to classify the species we found as migratory with broad dis-placements, or small seasonal migrants in the caatinga region (OLMOS et al. 2005). However, 18 species recorded by us either performed displacements related to water availability, or are known to be migratory:
– Tachybaptus dominicus (Linnaeus, 1766), Porphyrio martinica (Linnaeus, 1766), Megaceryle torquta (Linnaeus, 1766), Chloroceryle americana (Gmelin, 1788) and Fluvicola albiventer (Spix, 1825) are species associated with aquatic environ-ments and only occurred in the study area during the rainy season.
– Zenaida auriculata (Des Murs, 1847), in spite the few indi-viduals spotted in the two sampling periods, is a typical migratory species in the caatinga, performing displacements according to the rain (AZEVEDO JÚNIOR & ANTAS 1990). Per-sonal observations in the state of Paraíba have registered large flocks of Z. auriculata in the second half and in the end of the rainy season, when seeds, an important dietary item for the species, are more widely available. The fact that sampling in Alagoas occurred in the first half of the rainy season may explain the observation of only a few individu-als of this species.
– Coccyzus melacoryphus Vieillot, 1817, Myiopagis viridicata (Vieillot, 1817), Euscarthmus meloryphus Wied, 1831, Cnemotriccus fuscatus (Wied, 1831) and Pachyramphus polychopterus (Vieillot, 1818) are species that migrate among different areas in the Neotropical region, they occurred mainly in the caatinga during the rainy season.
– Five Tyrannidae species registered, Elaenia spectabilis Pelzeln, 1868, Camptostoma obsoletum (Temminck, 1824), Phaeomyias murina (Spix, 1825), Empidonomus varius (Vieillot, 1818) and
Tyrannus melancholicus Vieillot, 1819 are mentioned in the literature as migratory. However, their higher frequencies in the dry season may have resulted from the fact that they passed through the study area just before the beginning of the rainy season, because sampling in the dry season was performed near the beginning of the rainy season in the region.
– The hummingbird Chrysolampis mosquitus (Linnaeus, 1758) and the bay-winged Agelaioides fringillarius (Spix, 1824) were seen during the rainy season. Due to variations in their abun-dance and frequency in the area and in other caatinga areas (personal observations), we suggest that displacements in these two species are seasonal.
– Volatinia jacarina (Linnaeus, 1766) varied in abundance and frequency, and were observed more often during the rainy season; therefore, we suggest that displacements of this spe-cies are seasonal, as mentioned by OLMOS et al. (2005).
Other species registered only in one sampling period, for instance Patagioenas picazuro (Temminck, 1813) and Leptotila verreauxi Bonaparte, 1855, are more prone to local displace-ments to habitats where water and resources concentrate than to wider migrations (pers. obs.). The low richness or abundance of aquatic species in caatinga areas is most likely due to the scarcity of aquatic environments (OLMOS et al. 2005). The open caatinga from the backwoods of Alagoas maintains greater bird diversity, with almost twice as many species as registered in open fields, or in the small shrub patches found in these fields. A more equitable distribution of the abundance curve of birds that occur in areas of open caatinga shows a greater heteroge-neity in the community and supports the idea that this envi-ronment is the most diverse among the three evaluated.
OLMOS et al. (2005) commented that some species which are endemic or almost endemic to the caatinga seem to benefit from anthropogenic habitats, where their populations are denser. They mention P. dominicana and A. fringillarius as ex-amples. In our study area, P. dominicana was among the ten most abundant in the open fields and shrub patches, but was the 25th in abundance in the open caatinga. Sporophila
albogularis, which was more abundant in the open fields and shrub patches, had a similar abundance value as other most abundant species in the open caatinga.
maintenance of vegetation patches in altered habitats may also help some species which occur in forest areas and do not thrive in areas as open fields used for pasture and agriculture.
The results of this study also suggest that researchers try-ing to evaluate species richness or similarities in the composi-tion of the avifauna at a regional scale within a historical framework should take into consideration the fact that some places in the caatinga have been altered to the point that they longer harbor their original fauna.
ACKNOWLEDGEMENTS
This study was conducted as part of the environmental assessment to evaluate the impact of the proposed paving of BR 316 carried by Consultoria Ambiental Ltda and ECOPLAN Engenharia Ltda. We thank Emmerson Santos and Gentil Filho by suggestions in the English text.
LITERATURE CITED
ANDRADE-LIMA, D. 1982 Present-day forest refuges in northeastern Brazil, p. 123-135. In: G.T. PRANCE (Ed.). Biological
diversification in the tropics. New York, Columbia
University Press.
ASSIS, C.; M. RAPOSO; R. STOPIGLIA & R. PARRINI. 2007. Validation of Thamnophilus capistratus Lesson, 1840 (Passeriformes: Thamnophilidae). The Auk 124 (2): 665-676.
AZEVEDO JÚNIOR, S.M & P.T. ANTAS. 1990. Novas informações so-bre a alimentação de Zenaida auriculata no Nordeste do Bra-sil, p. 59-64. In: Anais do IV Encontro Nacional dos
Anilhadores de Aves. Recife.
CBRO. 2009. Lista das aves do Brasil. Comitê Brasileiro de Registros Ornitológicos. Available online at: http:// www.cbro.org.br/CBRO/listabr.htm [Acessed in 05/X/2009] CHAO, A. & T.J. SHEN. 2003. Nonparametric estimation of Shannon’s index of diversity when there are unseen species en sample. Environmental and Ecological Statistcs 10: 429-443.
CHAO, A. & T.J. SHEN. 2005. Program SPADE (species prediction and diversity estimation). Program and user’s guide. (2003-2005). Available online at: http://chao.stat.nthu.edu.tw [Acessed in 15/XI/2009]
CHAO, A.; R.L. CHAZDON; R.K. COLWELL & T.J. SHEN. 2005. A new statistical approach forassessing similarity of species composition with incidence and abundance data. Ecology
Letters 8: 148-159.
CHAZDON, R.L.; R.K. COLWELL; J.S. DENSLOW & M.R. GUARIGUATA. 1998. Statistical methods for estimating species richness of woody regeneration in primary and secondary rain forests of NE Costa Rica, p. 285-309. In: F. DALLMEIER & J.A. COMISKEY (Eds). Forest biodiversity research, monitoring and modeling: Conceptual background and Old World case
studies. Paris, Parthenon Publishing.
COLWELL, R.K. 2005. User’s guide to EstimateS7.5 statistical.
Estimation of species richness and shared species from
samples. Version 7.5.
CRACRAFT, J. 1985. Historical biogeography and patterns of differentiation within the South American avifauna: areas of endemism. Ornithological Monographs 36: 49-84. FARIAS, G.B. 2007. Avifauna em quatro áreas de caatinga strictu
senso no centro-oeste de Pernambuco, Brasil. Revista
Bra-sileira de Ornitologia 15: 53-60.
FARIAS, G.B.; W.A. GIRÃOE SILVA & C.G. ALBANO. 2006. Diversida-de Diversida-de aves em áreas prioritárias para conservação Diversida-de aves da Caatinga, p. 204-226. In: F.S. ARAUJO, M.J.N. RODAL & M.R.V. BARBOSA (Eds). Análise das variações da biodiversidade do bioma caatinga. Suporte a estratégias regionais de
con-servação. Brasília, Ministério do Meio Ambiente.
HAFFER, J. 1985. Avian zoogeography of the Neotropical lowland.
Ornithological Monographys 39: 113-146
HUTTO, R.L.; S.M. PLETSCHET & P. HENDRICKS. 1986. A fixed-radius point count method for nonbreeding and breeding season use. The Auk103: 593-602.
LEAL, I.R.; M. TABARELLI & J.M.C. SILVA. 2003. Ecologia e
conser-vação da Caatinga. Recife, Editora Universitária,
Universi-dade Federal de Pernambuco.
LEAL, I.R.; J.M.C. SILVA; M. TABARELLI & T.E. LACHER. 2005. Changing the course of biodiversity conservation in the Caatinga of Northeastern Brazil. Conservation Biology 19 (3): 701-706. LIMA, C.P.; S.S. SANTOS & R.C. LIMA. 2003. Levantamento e anilhamento da ornitofauna na pátria da arara-azul-de-Lear (Anodorhynchus leari, Bonaparte, 1856): um complemento ao levantamento realizado por H. Sick, L. P. Gonzaga e D. M. Teixeira, 1987. Atualidades Ornitológicas 112: 11-22 MULLER, P. 1973. Dispersal centers of terrestrial vertebrates in
the Neotropical. Biogeografica 2: 1-244.
NASCIMENTO, J.L.X. 2000. Estudo comparativo em duas Estações Ecológicas da Caatinga: Aiuaba e Seridó. Melopsittacus 3: 12-35.
NASCIMENTO, J.L.X.; I.L.S. NASCIMENTO & S.M. AZEVEDO-JÚNIOR. 2000. Aves da Chapada do Araripe (Brasil): biologia e conserva-ção. Ararajuba 8: 115-125.
OLMOS, F. 1993. Birds of Serra da Capivara National Park, in “caatinga” of north-eastern Brazil. Bird Conservation
International 3: 21-36.
OLMOS, F.; W.A. GIRÃOE SILVA & C.G. ALBANO. 2005. Aves de oito áreas de Caatinga no sul do Ceará e oeste de Pernambuco, Nordeste do Brasil: composição, riqueza e similaridade.
Pa-péis Avulsos de Zoologia 45 (14): 179-199.
PENNINGTON, R.T.; G.P. LEWIS & J.A. RATTER. 2006. An overview of the plant diversity, biogeography and conservation of Neotropical Savannas and Seasonally Dry Forests, p. 1-29. In: R.T. PENNINGTON, G.P. LEWIS & J.A. RATTER (Eds). Neotropical
Savannas and Seasonally Dry Forests: plant diversity,
biogeography and conservation. New York, CRC Press
PRADO, D. 2003. As caatingas da América do Sul, p. 3-73. In: I.R. LEAL, M. TABARELLI & J.M.C. DA SILVA (Eds). Ecologia e
conser-vação da Caatinga. Recife, Editora Universitária,
Universi-dade Federal de Pernambuco.
PRADO, D.E. & P.E. GIBBS. 1993. Patterns of species distributions in the dry seasonal forests of South America. Annals of the
Missouri Botanical Garden 80: 902-927.
PRANCE, G.T. 1987. Vegetation, p. 28-45. In: T.C. WHITMORE & G. T. PRANCE (Eds). Biogeography and Quaternary history in tro-pical America. Oxford Science Publications.
RATTER, J.A.; G.P. ASKEW; R. MONTGOMERY & D.R. GIFFORD. 1978. Observations on forests of some mesotrophic soils in cen-tral Brazil. Revista Brasileira de Botânica 1: 47-58. RIBON, R. 1995. Nova subspécie de Caprimulgus (Linnaeus) (Aves,
Caprimulgidae) do Espírito Santo, Brasil. Revista Brasileira
de Zoologia 12 (2): 229-232.
RIDGELY, R.S. & G. TUDOR. 1994. The Birds of South America: The
Suboscine Passerines. Austin, University Texas Press, vol. 2.
RIDGELY, R.S.; T.F. ALLNUTT; T. BROOKS; D.K. MCNICOL; D.W. MEHLMAN; B.E. YOUNG & J.R. ZOOK. 2005. Digital Distribution
Maps of the Birds of the Western Hemisphere. Arlington,
NatureServe, version 2.1.
RIZZINI, C.T. 1997. Tratado de Fitogeografia do Brasil. Rio de Janeiro, Editora Âmbito Cultural, 2nd ed.
ROOS, A.L.; M.F.C. NUNES; E.A. SOUZA; A.E.B.A. SOUZA; J.L.X. NASCI -MENTO & R.C.A. LACERDA. 2006. Avifauna da região do Lago de Sobradinho: composição, riqueza e biologia. Ornithologia 1
(2): 135-160.
SANTOS, M.P.D. 2004. As comunidades de aves em duas fisionomias da vegetação da Caatinga no estado do Piauí, Brasil. Ararajuba 12 (2): 113-123.
SICK, H. 1997. Ornitologia brasileira. Rio de Janeiro, Nova
Fron-teira.
SILVA, J.M.C. 1995. Birds of the Cerrado Region, South America.
Steenstrupia 21: 69-92.
SILVA, J.M.C.; M.A. SOUZA; A.G.D. BIEBER & C.J. CARLOS. 2003. Aves da Caatinga: status, uso do habitat e sensitividade, p. 237-273. In: I.R. LEAL; M. TABARELLI & J.M.C. DA SILVA (Eds).
Ecolo-gia e Conservação da Caatinga. Recife, Editora
Universitá-ria da Universidade Federal de Pernambuco.
SILVA, J.M.C.; M. TABARELLI; M.T. FONSECA & L. LINS. 2004. Biodiversidade da Caatinga: áreas prioritárias para conser-vação. Brasília, Ministério do Meio Ambiente.
STOTZ, B.F.; J.W. FITZPATRICK; T.A. PARKER III & D.K. MOSKOVITZ. 1996.
Neotropical birds: Ecology and Conservation. Chicago,
University Chicago Press.
TABARELLI, M. & A. VICENTE. 2004. Conhecimento sobre plantas lenhosas da Caatinga: lacunas geográficas e ecológicas, p. 101-111. In: J.M.C. DA SILVA; M. TABARELLI; M.T. FONSECA & M.T. LINS (Eds). Biodiversidade da Caatinga: áreas prioritárias
para conservação. Brasília, Ministério do Meio Ambiente.
TELINO-JÚNIOR, W.R.; R.M. LYRA-NEVES & J.L.X. NASCIMENTO. 2005. Biologia e composição da avifauna em uma Reserva Particular de Patrimônio Natural da caatinga paraibana. Ornithologia 1
(1): 49-57.
VANZOLINI, P.E.; A.M.M. RAMOS-COSTA & L.J. VITT. 1980. Répteis das
Caatingas. Rio de Janeiro, Academia Brasileira de Ciências.
VELOSO, A.L.; E.V.S.B. SAMPAIO & F.G.C. PAREYN. 2002. Ecorregiões
propostas para o Bioma Caatinga. Recife, Associação
Plan-tas do Nordeste, Instituto de Conservação Ambiental, The Nature Conservancy do Brasil.
ZIMMER, K.J. & A. WHITTAKER. 2000. The Rufous Cacholote (Furnariidae: Pseudoseisura) is two species. The Condor 102: 409-422.
Appendix 1. Bird species recorded along the BR 316 road in the west of state of Alagoas, northeast Brazil. Record: S. sound, V. visual. Environment: habitat where the species occurred: (1) open caatinga, (2) open fields, (3) shrub patches, (4) aquatic environments. Habitat use: (IND) forest independent, (SMD) forest semi-dependent, (DEP) forest dependent. Med/pont: individuals number per point in the 50 m radius (x100); freq.(50m): proportion of point counts in which the species was detected within the 50 m radius; freq.(ilim.): proportion of point counts in which the species was detected in the unlimited radius. The ‘x’ marked in some freq(ilim.) fields corresponds to the occurrence record in samplings of the respective periods but out of the point counts.
Taxon Record Environment Habit. Use Dry season Rainy season
med/pont freq.(50m) freq.(ilim.) med/pont freq.(50m) freq.(ilim.)
Tinamidae
Crypturellusparvirostris (Wagler, 1827) S 2 IND 0.03 2.78 8.33 16.67
Crypturellustataupa (Temminck, 1815) VS 1 3 DEP 8.33 0.06 5.56 19.44
Nothuraboraquira (Spix, 1825) S 3 SMD 5.56
Podicipedidae
Tachybaptusdominicus (Linnaeus, 1766) V 4 IND x
Ardeidae
Butoridesstriata (Linnaeus, 1758) VS 4 IND 2.78 x
Bubulcusibis (Linnaeus, 1758) V 2 IND 2.78 x
Ardeaalba Linnaeus, 1758 V 4 IND 8.33 x
Egrettathula (Molina, 1782) V 4 IND x x
Cathartidae
Cathartesaura (Linnaeus, 1758) V 1 2 IND 0.11 8.33 8.33 2.78
Cathartesburrovianus Cassin, 1845 V 1 2 IND 0.03 2.78 2.78 0.03 2.78 2.78
Coragypsatratus (Bechstein, 1793) V 1 2 IND 0.06 2.78 5.56 0.08 2.78 2.78
Accipitridae
Elanusleucurus (Vieillot, 1818) V 1 2 IND 0.03 2.78 2.78
Rupornismagnirostris (Gmelin, 1788) VS 1 2 IND 0.14 11.11 13.89 0.08 8.33 16.67
Falconidae
Caracaraplancus (Miller, 1777) VS 1 2 IND 0.11 8.33 13.89 5.56
Herpetotherescachinnans (Linnaeus, 1758) S 1 SMD 5.56
Falcosparverius Linnaeus, 1758 VS 2 IND x 0.06 5.56 5.56
Rallidae
Porphyriomartinica (Linnaeus, 1766) V 4 IND x
Cariamidae
Cariamacristata (Linnaeus, 1766) S 1 IND 0.06 2.78 2.78
Charadriidae
Vanelluschilensis (Molina, 1782) VS 2 4 IND 13.89 0.11 5.56 30.56
Jacanidae
Jacanajacana (Linnaeus, 1766) V 4 IND x x
Columbidae
Columbinaminuta (Linnaeus, 1766) VS 1 3 IND 0.72 27.78 27.78 0.50 27.78 30.56
Columbinasquammata (Lesson, 1831) S 1 IND 2.78
Columbinapicui (Temminck, 1813) VS 1 3 IND 0.75 30.56 44.44 1.06 47.22 58.33
Patagioenaspicazuro (Temminck, 1813) S 1 SMD 0.08 2.78 2.78
Zenaidaauriculata (Des Murs, 1847) V 2 3 IND x x
Leptotilaverreauxi Bonaparte, 1855 S 1 SMD 0.08 8.33 8.33
Psittacidae
Forpusxanthopterygius (Spix, 1824) VS 1 2 IND 0.11 5.56 11.11 0.33 11.11 13.89
Appendix 1. Continued.
Taxon
Record Environment Habit. Use
Dry season Rainy season
med/pont freq.(50m) freq.(ilim.) med/pont freq.(50m) freq.(ilim.)
Cuculidae
Coccyzusmelacoryphus Vieillot, 1817 S 1 3 SMD 2.78 0.06 2.78 5.56
Crotophagaani Linnaeus, 1758 VS 2 IND 2.78 0.06 2.78 16.67
Guiraguira (Gmelin, 1788) VS 2 IND 0.06 2.78 11.11 0.14 5.56 11.11
Taperanaevia (Linnaeus, 1766) S 1 2 IND 2.78 0.03 2.78 11.11
Strigidae
Athenecunicularia (Molina, 1782) VS 1 2 IND 2.78 0.03 2.78 2.78
Caprimulgidae
Caprimulgushirundinaceus Spix, 1825 V 1 IND x
Trochilidae
Eupetomenamacroura (Gmelin, 1788) V 1 2 IND 0.08 8.33 8.33 0.03 2.78 2.78
Chrysolampismosquitus (Linnaeus, 1758) V 1 IND 0.06 5.56 5.56
Chlorostilbonlucidus (Shaw, 1812) VS 1 2 SMD 0.25 25.00 25.00 0.28 25.00 27.78
Amazilia sp. V 3 ? 0.03 2.78 2.78
Heliomastersquamosus (Temminck, 1823) VS 1 DEP 0.03 2.78 2.78
Alcedinidae
Megaceryletorquata (Linnaeus, 1766) VS 4 IND 2.78
Chloroceryleamericana (Gmelin, 1788) VS 4 SMD 0.03 2.78 2.78
Bucconidae
Nystalusmaculatus (Gmelin, 1788) VS 1 2 3 SMD 0.11 8.33 30.56 0.19 16.67 33.33
Picidae
Veniliornispasserinus (Linnaeus, 1766) VS 1 SMD 0.06 5.56 13.89 0.08 8.33 8.33
Colaptesmelanochloros (Gmelin, 1788) V 1 SMD x
Thamnophilidae Swainson, 1824
Thamnophiluscapistratus (Lesson, 1840) VS 1 3 SMD 0.19 16.67 25.00 0.11 8.33 25.00
Myrmorchilusstrigilatus (Wied, 1831) S 1 3 SMD 0.17 13.89 30.56 0.06 5.56 13.89
Formicivoramelanogaster Pelzeln, 1868 VS 1 3 SMD 0.33 33.33 36.11 0.25 16.67 19.44
Dendrocolaptidae
Lepidocolaptesangustirostris (Vieillot, 1818) VS 1 3 IND 0.06 5.56 8.33 0.06 5.56 5.56
Furnariidae
Furnariusleucopus Swainson, 1838 S 1 SMD 2.78 x
Synallaxisfrontalis Pelzeln, 1859 S 1 DEP 0.03 2.78 2.78
Synallaxisalbescens Temminck, 1823 VS 1 3 IND 0.14 8.33 8.33
Phacellodomusrufifrons (Wied, 1821) S 1 3 SMD 0.06 2.78 5.56 2.78
Pseudoseisuracristata (Spix, 1824) VS 1 2 3 IND 0.39 19.44 58.33 0.33 13.89 38.89
Tyrannidae
Hemitriccusmargaritaceiventer (d'Orbigny e Lafresnaye, 1837)
VS 1 3 SMD 0.14 13.89 13.89 0.11 11.11 11.11
Todirostrumcinereum (Linnaeus, 1766) VS 1 2 SMD 0.28 25.00 25.00 0.17 16.67 16.67
Phyllomyiasfasciatus (Thunberg, 1822) VS 1 SMD 2.78
Myiopagisviridicata (Vieillot, 1817) VS 1 DEP 0.08 5.56 5.56
Elaeniaflavogaster (Thunberg, 1822) S 1 3 SMD 0.06 2.78 2.78 x
Elaeniaspectabilis Pelzeln, 1868 S 1 3 DEP 0.08 8.33 8.33 0.06 5.56 5.56
Appendix 1. Continued.
Taxon Record Environment Habit. Use Dry season Rainy season
med/pont freq.(50m) freq.(ilim.) med/pont freq.(50m) freq.(ilim.)
Camptostomaobsoletum (Temminck, 1824) S 1 3 IND 0.08 8.33 11.11 0.03 2.78 2.78
Phaeomyiasmurina (Spix, 1825) S 1 3 IND 0.33 27.78 27.78 0.11 11.11 13.89
Euscarthmusmeloryphus Wied, 1831 VS 1 3 SMD 0.47 25.00 25.00
Stigmaturanapensis Chapman, 1926 VS 1 3 IND 0.53 36.11 44.44 0.61 38.89 44.44
Tolmomyiasflaviventris (Wied, 1831) S 1 DEP 0.03 2.78 2.78
Cnemotriccusfuscatus (Wied, 1831) VS 1 DEP 0.11 8.33 8.33
Xolmisirupero (Vieillot, 1823) VS 1 3 IND 0.03 2.78 2.78 0.03 2.78 2.78
Fluvicolaalbiventer (Spix, 1825) VS 4 IND x
Fluvicolanengeta (Linnaeus, 1766) VS 2 4 IND 0.25 16.67 16.67 0.03 2.78 2.78
Myiozetetessimilis (Spix, 1825) V 2 3 SMD 0.03 2.78 2.78
Pitangussulphuratus (Linnaeus, 1766) VS 1 2 IND 0.78 47.22 61.11 0.31 16.67 19.44
Empidonomusvarius (Vieillot, 1818) VS 1 2 SMD 0.03 2.78 2.78 0.03 2.78 2.78
Tyrannusmelancholicus Vieillot, 1819 VS 1 2 3 IND 0.33 25.00 44.44 0.39 30.56 33.33
Myiarchustyrannulus (Statius Muller, 1776) VS 1 2 SMD 0.14 13.89 19.44 0.06 5.56 5.56
Tityridae
Pachyramphuspolychopterus (Vieillot, 1818) VS 1 3 SMD 0.08 8.33 8.33
Vireonidae
Cyclarhisgujanensis (Gmelin, 1789) S 1 3 SMD 0.11 8.33 19.44 0.08 8.33 22.22
Hylophilusamaurocephalus (Nordmann, 1835) VS 1 2 DEP 0.11 11.11 13.89 0.06 5.56 5.56
Corvidae
Cyanocoraxcyanopogon (Wied, 1821) VS 1 SMD 0.11 2.78 2.78 2.78
Hirundinidae
Prognetapera (Vieillot, 1817) V 1 2 IND 0.56 2.78 2.78
Prognechalybea (Gmelin, 1789) V 2 IND x
Tachycinetaalbiventer (Boddaert, 1783) VS 4 IND 0.03 2.78 2.78 x
Troglodytidae
Troglodytesmusculus Naumann, 1823 VS 1 2 3 IND 0.28 22.22 22.22 0.11 8.33 16.67
Cantorchiluslongirostris (Vieillot, 1819) VS 1 3 DEP 0.42 38.89 38.89 0.44 36.11 44.44
Polioptilidae
Polioptilaplumbea (Gmelin, 1788) VS 1 3 SMD 0.64 52.78 52.78 0.31 27.78 38.89
Turdidae
Turdusrufiventris Vieillot, 1818 VS 1 3 IND 0.06 5.56 11.11 0.03 2.78 5.56
Mimidae
Mimussaturninus (Lichtenstein, 1823) VS 1 3 IND 0.50 27.78 41.67 0.64 38.89 38.89
Motacillidae
Anthuslutescens Pucheran, 1855 VS 1 3 IND 2.78
Coerebidae
Coerebaflaveola (Linnaeus, 1758) VS 1 2 SMD 0.06 2.78 2.78 0.03 2.78 2.78
Thraupidae
Compsothraupisloricata (Lichtenstein, 1819) S 2 SMD 0.17 2.78 2.78
Tachyphonusrufus (Boddaert, 1783) VS 1 DEP 0.06 5.56 5.56
Thraupissayaca (Linnaeus, 1766) VS 1 2 SMD 0.19 11.11 13.89 0.06 2.78 2.78
Appendix 1. Continued.
Taxon
Record Environment Habit. Use
Dry season Rainy season
med/pont freq.(50m) freq.(ilim.) med/pont freq.(50m) freq.(ilim.)
Emberizidae
Zonotrichiacapensis (Statius Muller, 1776) VS 1 2 3 IND 0.58 38.89 41.67 1.00 61.11 75.00
Ammodramushumeralis (Bosc, 1792) VS 2 IND 0.44 25.00 38.89 0.39 36.11 44.44
Sicalisflaveola (Linnaeus, 1766) VS 2 IND x
Sicalisluteola (Sparrman, 1789) VS 2 3 IND 0.22 2.78 2.78 0.86 19.44 19.44
Volatiniajacarina (Linnaeus, 1766) VS 2 3 IND 0.06 5.56 5.56 0.22 16.67 16.67
Sporophilaalbogularis (Spix, 1825) VS 1 2 3 IND 2.86 38.89 41.67 1.69 50.00 50.00
Sporophilabouvreuil (Statius Muller, 1776) VS 2 IND 0.03 2.78 2.78
Coryphospinguspileatus (Wied, 1821) VS 1 3 SMD 2.14 72.22 72.22 0.92 41.67 44.44
Paroariadominicana (Linnaeus, 1758) VS 1 2 3 IND 0.61 27.78 30.56 0.25 19.44 22.22
Cardinalidae
Cyanoloxiabrissonii (Lichtenstein, 1823) VS 1 3 DEP 0.06 5.56 5.56 0.03 2.78 2.78
Icteridae
Icteruscayanensis (Linnaeus, 1766) VS 1 3 SMD 0.08 5.56 5.56 x
Agelaioidesfringillarius (Spix 1824) VS 2 IND 0.17 2.78 2.78
Molothrusbonariensis (Gmelin, 1789) VS 1 2 IND 0.17 5.56 5.56 x
Sturnellasuperciliaris (Bonaparte, 1850) VS 2 IND 1.78 16.67 16.67 0.14 5.56 8.33
Fringillidae
Euphoniachlorotica (Linnaeus, 1766) VS 1 3 IND 0.11 8.33 13.89 0.03 2.78 5.56
Passeridae