INFERÊNCIA DA LOCALIZAÇÃO DE
RESIDÊNCIA DE USUÁRIOS DE REDES SOCIAIS
TATIANA PONTES SOARES ROCHA
INFERÊNCIA DA LOCALIZAÇÃO DE
RESIDÊNCIA DE USUÁRIOS DE REDES SOCIAIS
A PARTIR DE DADOS PÚBLICOS
Dissertação apresentada ao Programa de Pós-Graduação em Ciência da Computação do Instituto de Ciências Exatas da Univer-sidade Federal de Minas Gerais como re-quisito parcial para a obtenção do grau de Mestre em Ciência da Computação.
Orientador: Jussara Marques de Almeida Gonçalves
Co-Orientador: Ponnurangam Kumaraguru
Belo Horizonte
TATIANA PONTES SOARES ROCHA
INFERRING HOME LOCATION OF SOCIAL
NETWORK USERS FROM PUBLIC DATA
Dissertation presented to the Graduate Program in Ciência da Computação of the Universidade Federal de Minas Gerais in partial fulfillment of the requirements for the degree of Master in Ciência da Com-putação.
Advisor: Jussara Marques de Almeida Gonçalves
Co-Advisor: Ponnurangam Kumaraguru
Belo Horizonte
Rocha, Tatiana Pontes Soares
R672i Inferring Home Location of Social Network Users from Public Data / Tatiana Pontes Soares Rocha. — Belo Horizonte, 2013
xxiv, 78 f. : il. ; 29cm
Dissertação (mestrado) — Universidade Federal de Minas Gerais
Orientador: Jussara Marques de Almeida Gonçalves
Co-Orientador: Ponnurangam Kumaraguru
1. Computação Teses. 2. Redes sociais online -Teses. 3. Foursquare - -Teses. I. Título.
Aos meus pais, meus amores Gui e Jack.
Acknowledgments
Eu gostaria de agradecer, em primeiro lugar, à minha orientadora Jussara Almeida pelos últimos quatro anos em que trabalhamos juntas. Além da imensa admiração pela sua competência e comprometimento, sou muito grata por todas as oportunidades que ela me ofereceu durante toda a minha carreira acadêmica. Fica aqui o meu “muito obrigada” pela amizade, pela confiança depositada em mim, pela atenção constante, pelos nossos artigos, pelo grande aprendizado.
Um agradecimento especial ao professor Virgílio Almeida, que esteve sempre pre-sente, apesar da agenda bastante requisitada. É um privilégio ter trabalhado com ele.
My sincere thanks also to my co-advisor, the professor Ponnurangam Kumaraguru, who has motivated the research topic of this dissertation and was actively involved in the development of this work.
Gostaria de agradecer aos colegas, professores e funcionários do DCC/UFMG por serem tão atenciosos e prestativos comigo. Aos amigos do CAMPS, que fizeram meu dia-a-dia mais leve e divertido. Sem dúvida, os momentos mais agradáveis no DCC foram com Gabriel, Giovanni, Geraldo, Tiago, Pesce, Rapha, Las Casas, Saulo, Matheus, Fabrício, Evandro, Rauber e Emanuel. Agradeço também à Marisa, pelo companheirismo e pelas conversas no caminho de casa.
Não poderia deixar de expressar minha enorme gratidão aos meus pais, Gui e Jack, pelo imenso amor e por me motivarem todos os dias. Aos meus irmãos, Bruno e Kaká, e à minha cunhadinha Mari por acreditarem em mim. Às minhas vovós queridas, Jane e Darcy, pela torcida e por estarem sempre presentes. E aos tios e primos, pelo carinho e apoio.
Aos meus amigos, meu agradecimento pelos momentos de descontração e muitas risadas que aliviaram o stress.
A todos vocês, obrigada por fazerem parte desse sonho, agora concretizado.
“Keep your thoughts positive because your thoughts become YOUR WORDS. Keep your words positive because your words become YOUR BEHAVIOUR. Keep your behaviour positive because your behaviour becomes YOUR HABITS. Keep your habits positive because your habits become YOUR VALUES. Keep your values positive because your values become YOUR DESTINY.”
(Mahatma Gandhi)
Resumo
A crescente acessibilidade às mídias sociais atrelada à facilidade de uso dos serviços de compartilhamento têm propiciado a geração voluntária de um grande volume de dados pessoais nesses ambientes. As informações compartilhadas, que variam de fotos do cotidiano a associações profissionais, podem ser exploradas para os mais diversos fins. Ao mesmo tempo em que esses dados criam oportunidades para os usuários for-talecerem seus laços nas redes sociais, eles também favorecem o desenvolvimento de mecanismos personalizados e estratégias de recomendação mais eficientes. Entretanto, esses mesmos dados podem ser manipulados de forma maliciosa e indesejada para promover marketing viral ou acessar informações confidenciais sobre os usuários. A violação de privacidade ocorre frequentemente devido ao desconhecimento e descuido das pessoas em relação àquilo que divulgam e tornam público. Com o aumento de serviços baseados em localização, um aspecto adicional é incluído ao dado referente à informação geográfica, o que torna a discussão sobre privacidade ainda mais inci-siva, visto que tais dados podem colocar em risco a integridade física dos usuários, permitindo que eles sejam rastreados. Neste trabalho, analisamos uma das mais pop-ulares redes sociais baseadas em localização, o Foursquare, com o intuito de investigar como os seus membros exploram os recursos públicos do sistema (especificamente os atributos que possuem informação geográfica associada). A caracterização do compor-tamento humano no Foursquare consiste de um estudo que agrega cerca de 13 milhões de usuários e visa observar o potencial dos atributos geográficos do sistema em agir como fontes de vazamento de informação. Nesse contexto, propomos variados modelos de inferência na tentativa de revelar a localização da residência dos usuários a partir de dados geográficos publicamente disponibilizados. Apesar dos modelos serem genéri-cos e poderem gerar inferências em diferentes níveis espaciais, focamos nas inferências mais refinadas, nas granularidades de cidade e de coordenada geográfica, que, se bem sucedidas, representam riscos maiores à privacidade individual. Nossa avaliação ex-perimental indica que os modelos propostos são capazes de inferir facilmente a cidade onde os usuários moram com uma precisão de cerca de 78% dentro de um raio de 50
um raio de 5 quilômetros.
Palavras-chave: privacidade, inferência, redes sociais, foursquare, residência, locali-zação.
Abstract
The increasing access to social media, associated to the ease of use of sharing ser-vices, have fostered the voluntary generation of a large amount of personal data in these environments. The shared information, which vary from photos of everyday life to professional associations, can be exploited for various purposes. While these data provide opportunities for users to strengthen their ties in social networks, they also favour the development of personalised mechanisms and more efficient recommenda-tion strategies. However, the same data can also be manipulated to promote malicious and unwanted viral marketing or access sensitive information about users. The privacy breach frequently occurs due to unawareness and carelessness of people about making information publicly available. With the rise of the location-based services, an addi-tional aspect is added to the data related to geographic information, which makes the discussion about privacy even more incisive, since such data can endanger the physical safety of users, allowing them to be tracked. In this dissertation, we explore one of the most popular location-based social networks, Foursquare, aiming at investigating how its members exploit public system resources (specifically the attributes that are associated to geographic information). The characterisation of human behaviour in Foursquare consists of a study which aggregates about 13 million users and aims to observe the potential of geographic attributes in the system to act as sources of infor-mation leakage. In this context, we propose various inference models in an attempt to reveal the home location of users through their geographic data publicly available. Although the models are generic, being able to produce inferences at various scales, we focus on finer-grained inferences at the city and geographic coordinate levels that, if successful, represent greater risks to individual privacy. Our experimental evaluation indicates that the proposed models can easily infer the city where users live with an accuracy of about 78% within a radius of 50 kilometres. At an even finer scale, we correctly infer the coordinates of the users’ home with approximately 60% accuracy within a 5 kilometres radius.
List of Figures
3.1 Snapshot of the Profile Page of a Foursquare User. . . 17
3.2 Cumulative Distribution of the Location-based Attributes per User. . . 22
3.3 Cumulative Distribution of the Location-based Attributes per City. . . 23
3.4 Global Distribution of Users and Venues Location across Cities. . . 24
3.5 Global Distribution of the Location-based Attributes across Cities. . . 25
3.6 Tag Cloud of the Words Present in Tips. . . 27
3.7 Cumulative Distribution of Displacements Between Consecutive Tips/Likes Posted per User. . . 28
3.8 Cumulative Distribution of Time Interval Between Consecutive Tips/Likes Posted per User. . . 29
3.9 Distribution of Returning Times. . . 30
4.1 Successful Example of Iterative_MVS Approach to Solve Ties among Lo-cations. . . 37
4.2 Summarisation of the Home Location Inference Models. . . 42
5.1 Impact of the Parameter min_evidence. . . 49
5.2 Impact of the Parameter min_votes. . . 50
5.3 Cumulative Distribution of the Distances Between the Declared and the Inferred User Home City for the Mayorship model. . . 54
5.4 Cumulative Distribution of the Number of Candidates for Neighbours for bothLocal_KNN and Global_KNN Approaches. . . 56
5.5 Cumulative Distribution of the Number of Users per Venue and Venues per Users. . . 56
5.6 Impact of the Parameter K forGlobal_KNN and Local_KNN Approaches. 58 5.7 Impact of the Parameter min_friends. . . 60
5.8 Impact of the Parameter min_mutual. . . 61
List of Tables
3.1 Summary of Statistics about our Foursquare Dataset. . . 18 3.2 Availability of Geographic Information (GI). . . 20 3.3 Quality of the Valid and Unambiguous Geographic Information. . . 21
5.1 Summary of the Results Obtained for the Original_MVS Approach for
Home City Inferences. . . 47 5.2 Summary of the Results Obtained for the Iterative_MVS Approach for
Home City Inference. . . 51 5.3 Results of the Global_KNN Approach for Home City Inference. . . 56 5.4 Results of the Local_KNN Approach for Home City Inference. . . 57 5.5 Summary of the Results Obtained for the Home Inference in the Geographic
Coordinate Level. . . 63
Contents
Acknowledgments xi
Resumo xv
Abstract xvii
List of Figures xix
List of Tables xxi
1 Introduction 1
1.1 Context . . . 2 1.2 Motivation / Purpose . . . 3 1.3 Objectives . . . 4 1.4 Contributions . . . 5 1.5 Organisation . . . 6
2 Literature Review 7
2.1 Location-Based Social Networks – LBSNs . . . 7 2.2 Location-Aware Recommendation Services . . . 9 2.3 Privacy in Online Systems . . . 10 2.4 Home Location Inference Strategies . . . 12
3 Foursquare Dataset 15
3.1 Foursquare: Key Elements and Features . . . 15 3.2 Crawling Methodology . . . 17 3.3 Dataset Overview . . . 18 3.4 Geographically Referenced Information . . . 19 3.5 Attribute Characterisation . . . 21 3.6 Spatial Analysis . . . 27
4 Home Location Inference Models 33 4.1 Problem Statement . . . 33 4.2 Inference Models at the City Level . . . 34 4.2.1 The Majority Voting Scheme . . . 35 4.2.2 The K-Nearest Neighbour Approach . . . 38 4.3 Inference Models at the Geographic Coordinate Level . . . 40 4.4 Evaluation Methodology . . . 40
5 Experimental Evaluation 45
5.1 Inference Results at the City Level . . . 45 5.1.1 MVS Inference Models . . . 45 5.1.2 KNN Inference Models . . . 54 5.2 Inference Results at the Geographic Coordinate Level . . . 62 5.2.1 Experimental Setup . . . 63 5.2.2 Results . . . 63 5.2.3 Discussion . . . 65
6 Conclusions and Future Work 67
6.1 Main Contributions . . . 67 6.2 Limitations . . . 69 6.3 Future Work . . . 69
Bibliography 71
Chapter 1
Introduction
The human history has always given evidence that human nature demands the creation of ties among people. In fact, life in society already means that the socialisation is expectable and needed. It is almost impossible to deny this instinct, once people live in contact with groups in the most varied environments such as at home with a family, in the work place with colleagues, or even in the bus with other passersby. Thus people end up establishing new relationships and eventually increasing their social network. Even in the Age of Technology, human nature remains in the virtual world finding alternative ways of communication and interaction, through Online Social Networks
(OSNs).
Initially OSNs were designed to link close friends, but gradually new systems arose with different purposes, attracting users with different needs and reasons to sign up to this kind of system. Facebook 1
, Twitter 2
, LinkedIn 3
and Pinterest 4
are cur-rently the most popular applications amongst Internet users [Alexa, 2013] allowing them to connect to a huge network of people spread throughout the world and to share an infinity of personal information, including photos, topics of interest, age, relation-ship status, and address. Due to the great popularity of these systems, becoming a member is a matter of time motivated by several reasons, including the efficient way to communicate and relate with others on an unprecedented rate, the possibility to share content in large scale, the opportunity of self-promotion, commercial interests, as well as the simple intent of socialisation [Tang et al., 2010].
1
www.facebook.com 2
www.twitter.com 3
www.linkedin.com 4
www.pinterest.com
1.1
Context
Due to the rapid growth in the use of smart devices equipped with Global Positioning System (GPS) receivers, location-based services (LBS) have become prevalent, raising the interest of the research community. Similarly, they have also motivated the creation of the Location-Based Social Networks (LBSNs) [Zheng, 2011], which are specialised systems in creating new means for online interaction based mostly on the geographic lo-cation of their registered users. LBSNs allow users to associate geographic information with the content they share, a feature that is being embedded also in OSNs.
Out of the various existing LBSNs, such as Yelp 5
, Google Latitude 6
and In-stagram 7
, Foursquare 8
is currently among the most popular ones. 9
Its overall goal revolves around location sharing while users accumulate special awards for visiting specific places registered in the system. Such appeal encourages users to voluntarily make more personal information publicly available, such as their favourite places to visit, mobility patterns and behavioural habits. The availability of such data in the Web supports the design of several mechanisms and solutions that are of interest to the user, such as the development of personalisation mechanisms and tools to locate nearby friends according to the current user location [Berjani and Strufe, 2011], as well as urban planning models [Cranshaw et al., 2012], and more effective recommendation and advertisement strategies [Ye et al., 2010].
Meanwhile, improving the users’ experience in the system and with the surround-ing community through services and features which demand the disclosure of location information raises user exposure to a varied audience, possibly spread in many differ-ent systems. This overexposure potdiffer-entially touches privacy concerns, creating oppor-tunities for unauthorised usage of personal data [Ruiz Vicente et al., 2011]. Privacy attacks may occur in different fronts, as through the access of personal data [Fried-land et al., 2011], or even via social network, due to information leakage provided by friends [Sadilek et al., 2012; Pesce et al., 2012]. These violations are typically result of privacy breaches which offer ways to gather user information from different sources unveiling sensitive data which, in turn, may contain revealing information such as the exact location and time of where and when a photo was taken.
Privacy breaches on LBSNs may favor positive and negative uses of personal
5 www.yelp.com 6 www.google.com/latitude 7 www.instagram.com 8 www.foursquare.com 9
1.2. Motivation / Purpose 3 data. At the point of view of police officers, criminals and suspect individuals could be investigated through the data disclosed on these kind of system, while overprotective parentes could take advantage of the availability of their kids’ location information to track them being aware of where they have been and when. On the other hand, privacy violations may harm users making them more vulnerable to the action of robbers and kidnappers who previously observed a user habit to act in the most convenient time.
1.2
Motivation / Purpose
Social networking sites, in particular LBSNs, provide a range of increasingly more sophisticated security and privacy settings, aiming to empower their members as man-agers of their own exposition. Nevertheless, these settings are often confusing, unknown to all users, difficult to be applied, and often inefficient in controlling each possible sink-hole of information leakage [Gundecha et al., 2011]. Thereby, users also need to strike the right balance between concealment and disclosure in an attempt to meet their indi-vidual privacy requirements goals [Quercia et al., 2012]. Combining such scenario with the Web’s tendency to “never forget” [Friedland et al., 2011], which can make shared data live forever, privacy violations may cause irreversible damage.
The diversity of user-supplied content – text, location, and photos – shared in a fast pace across systems creates a cloud of information about individuals. Taken together, the pieces of information disclosed on the Web can reveal a quite comprehen-sive picture of a person in ways that are hard to intuitively grasp, even if individually none of these pieces may be worrisome on their own [Friedland et al., 2011]. Therefore, users are constantly threatened by the potential of their own data in unveiling private information by the creation of inference chains formed with data correlation, friends that may reveal user data in their profiles, or simply by public attributes that are, by nature, not protected. This leakage of information can certainly tell much more about individuals than they are really aware of revealing.
[2011] proved that a single vulnerable user can place all his friends at risk since he may be a source of information leakage, thus we can say that a user’s privacy protection goes beyond his privacy settings and becomes a social networking problem. Privacy attacks are potentially more harmful in LBSNs in which the geographic aspect of the data can be explored. The analysis of location data permits the discovery of mobil-ity patterns [Cheng et al., 2011b] and behavioural habits [Noulas et al., 2011]. Going further, the collation of geographic attributes may enable inferences about where a user lives. Once again, this kind of discovery is possible through user-generated data publicly available, such as the vocabulary in textual content [Cheng et al., 2010], friend characteristics [Davis Jr. et al., 2011], and the user’s own traits [Mahmud et al., 2012]. Still, online privacy research in LBSNs clearly has not been sufficiently addressed in order to help developers to create safer systems or to alert users about protecting themselves properly from unexpected harm. This discussion has so far ignored an area that is poised to open up a new category of powerful privacy attacks based on global inferences resulting from automated content analysis, enabling cross-site correlation of personal information. The risks and implications of these attacks can also extrapolate the boundaries of the virtual world, making users physically vulnerable to robbery and kidnapping.
1.3
Objectives
In a world where confidentiality is something required in employment agreements that keep the company’s information in secret from the public, finding a user’s home location seems to be a much more invasive privacy breach, especially when it is uncovered by public data. In this context, the present dissertation aims to bring up a large-scale study on inferring the location of user homes in Foursquare through publicly available attributes.
Therefore, we guide a study that consists of three main steps. First, collecting the public information provided by users, building a dataset containing data on millions of users. Second, perform a basic characterisation of data that are potentially relevant in revealing private user information, in particular, the home location. Finally, we propose and evaluate alternative models that, based on data that are shared with everyone in the system, infer the user home location.
1.4. Contributions 5 refined inference levels which represent more serious privacy violations, since they are closer to revealing the exact location of the user residence.
1.4
Contributions
Since LBSNs are an emerging kind of system in the web, studies in this field are considered innovative and relevant. The novelty is due to the fact that a large amount of data produced by their users is associated to geographic information – something new compared to the data shared in the original OSNs. Thereby, exploring the locational aspect of users’ content is valuable in the sense that it can be used for various purposes. Thus, knowing where a user lives, for instance, may provide improvements in various research areas, ranging from the development of models for human occupation in a city to the creation of more efficient strategies for recommendation and personalised advertisement systems – as reviewed in Chapter 2.
Our first efforts in inferring user home city (and also state and country) were presented in the Workshop on Location-Based Social Networks (LBSN’12) held in con-junction with the 2012 ACM International Joint Conference on Pervasive and Ubiq-uitous Computing (UbiComp’12 ) [Pontes et al., 2012b]. Then, an extension of this preliminary study was published in the Workshop of Privacy in Social Media (Pin-SoDa’12 ) in conjunction with the 2012 IEEE International Conference on Data Mining (ICDM’12) [Pontes et al., 2012a], in which we improve our last models to perform a finer-grained inference in the level of geographic coordinate of the user’s residence. In both studies, we consider the same Foursquare dataset of millions of users and our inferences are applied in a global scale, not restrict to a specific region or country.
1.5
Organisation
Chapter 2
Literature Review
User behaviour and information diffusion in online systems is a very active and rele-vant research area, with a rich set of studies. Since location-aware services and social networks are getting even more popular, there is a great interest in analysing how users explore the new resources available in such systems and which kind of information they are geographically tagging (topic discussed in Section 2.1). This increasing amount of user information on the web relights the investigation of contrasting uses of such data: for good faith purposes – as the creation of new recommendation strategies and more effective personalisation mechanisms (covered in Section 2.2), and for suspect purposes – as opportunistic actions (e.g., the development of methods capable of tracing users or to infer sensitive information through publicly available data) facilitated through privacy breaches caused by high exposure on the system (in Section 2.3). In this con-text, this Chapter is concluded with a deep discussion about an important privacy concern related with location: the home location inference. The state-of-the-art infer-ence models (tackled in Section 2.4) are presented with an emphasis on the techniques and features used to reveal where a user lives.
2.1
Location-Based Social Networks – LBSNs
Sharing the current location or some other geotagged information like photos, status and videos associated with some specific place is the new tendency among users in the LBSNs. These systems provide services which allow users to associate location information to the shared data, creating a map of places where they have left some virtual footprints. Therewith, some questions arise: Why do users share their own location in social networks? and What can researchers do with the increasing amount of geographic-tagged information available?
In an attempt to understand the reasons why users share their location, Tang et al. [2010] proposed a study which discusses the purpose and social-driven aspects of shar-ing. Some location sharing applications like Reno [Iachello et al., 2005], WatchMe [Mar-masse et al., 2004] and the Whereabouts Clock [Brown et al., 2007] are all motivated by scenarios which have a more utilitarian perspective – purpose-driven. Thus, the requests for a user location focus on pragmatic issues, including activities such as planning a meeting, checking for availability, coordinating transportation routes and estimating traffic delays. Hence, users detain the power to decide whether to share, for which reason, with whom, and in which level of precision. These applications are in distinct contrast from current LBSNs that support location sharing within social net-works. Foursquare, Loopt1
, Yelp2
, and Locaccino3
are some examples ofsocial-driven
systems which emphasise the “social factor” of sharing related to more subjective as-pects. This is also confirmed by Lindqvist et al. [2011], which justifies that users might announce their current location not because someone needs to know but because it is a way of fun, boosts self-presentation, signalises friends’ availability and sustains the so-cial capital within one’s network. Thereby, we see a clear shift in location sharing from theone-to-one approach to the current LBSNs’ approach (one-to-many orone-to-all), where members can share location with a much wider and more diverse audience.
In this context, several recent studies have focused on investigating geographic user information to understand aspects related to human mobility [Cheng et al., 2011b; Cho et al., 2011; Sadilek et al., 2012], user behaviour patterns [Noulas et al., 2011; Vas-concelos et al., 2012], cross-cultural peculiarities in the usage of online systems [Magno et al., 2012], places modelling through geotagged photos [Crandall and Snavely, 2012], city dynamics [Silva et al., 2012b] and urban development [Cranshaw et al., 2012], and natural event detection [Sakaki et al., 2010]. These studies consider users to be like web sensors [Silva et al., 2012a; Pozdnoukhov and Kaiser, 2011; Lathia et al., 2012] that are potentially social indicators of topics associated with particular places and times. Observing users’ visits to different places, Cheng et al. [2011b] have shown that the movements performed by users follow simple reproducible patterns explained by social status, in addition to geographic and economic factors. Also, Cho et al. [2011] have proposed a human mobility model based on a combination of periodic short-ranged movements both geographically and temporally limited, and seemingly random jumps (due to long distance travels) highly influenced by user friendships. Noulas et al. [2011] and Vasconcelos et al. [2012] have focused on Foursquare, analysing the dynamics of
2.2. Location-Aware Recommendation Services 9 collective user activity and uncovering distinct behaviour profiles, while Magno et al. [2012] have addressed Google+, showing the various usage patterns of the services available across different cultures. In particular, the usage of geographic tags in photos is explored by Crandall and Snavely [2012], who leverage such information to identify famous places and regions (highly photographed) and create 3D versions of landmarks. They also have observed that when two people are photographed at about the same place and time on five distinct occasions, they have nearly 60% of chances of being friends. Finally, Cranshaw et al. [2012] have proposed an online system able to por-trait the rhythm of human steps, in near real time, throughout different parts of a city. This kind of monitoring also motivated Sakaki et al. [2010] to create mechanisms to detect earthquake promptly, to broadcast timely notifications.
The study proposed in this dissertation explores the Foursquare LBSN. We anal-yse the geographic and temporal aspects of user activity in the system through publicly available personal attributes. Such analysis of our dataset provides a proper under-standing about how users behave in the system, in terms of how (and whether) they use these attributes, giving enough subsidies for us to propose and develop home location inference models – described in Chapter 4.
2.2
Location-Aware Recommendation Services
Making recommendations or offering suggestions to users in order to increase their de-gree of engagement is a very common practice for websites. Moreover, the phenomenal participation of users in OSNs, and specially in LBSNs, has given a tremendous hope for designing a new type of user experience based on both thesocial and thespatial as-pects. While traditional recommenders provide default and generic results to everyone, social network-aware and location-aware systems can bring forth more targeted recom-mendations based on information gathered from friends and places visited [Vögele and Schlieder, 2003]. Particularly for users whose activity is little to none in a system (cold starters), social recommendations are notably interesting, since they enhance the input
data for a recommender with more information, increasing the chances to achieve an appropriate and effective suggestion. Also, considering the location associated with the available data can be useful to drive the suggestions towards a geographically limited space where a user will probably move.
num-ber of times a user has visited specific places. Ye et al. [2010] have also developed a recommender based on the social and spatial ties among users and their visited locations – they argue that friends share more common locations than non-friends, and nearby friends tend to share more commonly visited locations. Knowing this, Quercia and Capra [2009] have recommended friends using short-range technologies (e.g., bluetooth) on mobile phones based on social network theories of “geographic proximity” and “link prediction”. Furthermore, complementarily, Cheng et al. [2011a] have found that traffic patterns revealed through Foursquare history of visits to places can identify semanti-cally related locations, thus favouring the creation of a traffic-driven location clustering algorithm to group semantically related locations with high confidence, which, in turn, may be naturally incorporated into location-based recommenders. Other types of rec-ommendation are also possible, as the suggestion of social events proposed by Quercia et al. [2010]. Authors agree that there is a clear relationship between preferences for social events and geography and it also contributes to the recommendation of users to events. Saez-Trumper et al. [2012] show that individuals tend to go to a venue not only because they like it but also because they are close by.
Since this dissertation intends to present different ways to infer the real home lo-cation of users in Foursquare, we can say that the result offered by our proposed models may help researchers and system developers to improve the current recommendation strategies in this LBSN. Knowing the location where a user lives, whether at city level or at finer-grained granularities, favours the systems to perform nearby suggestions discarding misplaced options such as recommendations for places located too far from the user’s home location.
2.3
Privacy in Online Systems
2.3. Privacy in Online Systems 11 collation of a set of public user attributes in a system to uncover private information. Recently, due to the amazing popularity of the LBSNs, studies which involve privacy related with the disclosure of some geographic information have also become a topic of interest for the research community [Wagner et al., 2010; Fusco et al., 2011].
Barkhuus and Dey [2003], as well as Gross and Acquisti [2005], have studied how users deal with privacy concerns in online systems. They observed that frequently there is not much concern regarding this topic, since users are more interested in the quality of the services offered in these environments than in protecting their data. In this context, and also due to the complexity of expressing privacy preferences on various applications [Benisch, 2011], only a small minority of users makes some effort to change the highly invasive privacy settings. Moreover, Li and Chen [2010] have shown that there are correlations among the user’s vulnerability and his personal characteristics, which include factors like age, gender, friendships, mobility patterns, and others.
Although many users do not seem to worry about their high exposition in the system, Choudhury et al. [2010] agree that, many times, users are not aware of the risks involved. One of the main threats to user privacy is derived from inferences, which consist in combining pieces of explicit information in attempt to generate new conclusions, sometimes not so evident, which can reveal implicit and sensitive data and make users more vulnerable. It is known, for instance, that individual preferences can be deduced from friends which in general share similar preferences, as revised by Gun-decha et al. [2011] and Li and Chen [2010]. Likewise, Mislove et al. [2010] and Zheleva and Getoor [2009] claim that user homophily does influence the information diffusion in social networks, suggesting that people with common characteristics and similar tastes are more likely to become friends, and therefore end up creating dense and ho-mogeneous communities. Thus, this scenario where similar users are clearly grouped is quite favourable for the successful application of the inferences. Pesce et al. [2012] have demonstrated, in particular, that a simple tagged photo could reveal private user attributes that are extremely sensitive. Conclusively, users see themselves in a blind alley, since their efforts against information leakage may be insufficient to keep them protected. Indeed, Lam et al. [2008] and He et al. [2006] have shown that users are fre-quently unaware of information leaks through social relationships, which characterise involuntary violations.
dis-sertation proposes, Jin et al. [2012] have provided an analysis of user activity involving residential venues in Foursquare, aiming to identify system vulnerabilities and privacy risks. Although the numerous concerns associated with location sharing, Barkhuus and Dey [2003] have shown that users are often more worried about services that trace locations (location-tracking) than the ones that only request instant location ( position-aware). Also, Lindqvist et al. [2011] have observed that only a small minority of users change their privacy settings and the ones who are concerned with privacy usually opt not to share their current location, omitting this data from their profiles.
In this dissertation, we discuss privacy-related issues regarding the geographic attributes present in Foursquare. Our study was carried out with a view to provide valuable insights to drive future systems designs and optimisations towards maintaining a fair and acceptable balance between the users’ exposure and the quality of the services in LBSNs.
2.4
Home Location Inference Strategies
The literature has various studies on whether it is possible to infer a user’s home location from various features (or attributes) with some geographical information as-sociated. Backstrom et al. [2010] have measured the relationship between spatial and social proximity among Facebook users observing that the probability of a friendship drops monotonically as a function of distance – a finding that motivated the authors to introduce an algorithm based on a maximum likelihood approach to predict the location of an individual. Similarly, Davis Jr. et al. [2011] have also proposed a model for inferring the location of Twitter users assuming that reciprocal relationships in that system usually consists of people who are likely to be geographically close. The lack of geographic-based features on Twitter has fostered the design of inference models based on the tweet textual content. Cheng et al. [2010] have created a model based on the common vocabulary of users from the same geographical region, while Hecht et al. [2011] and Mahmud et al. [2012] have used machine learning strategies to infer the lo-cation where users live by only looking at what they tweet. Likewise, a recent study on Twitter demonstrated that distinct sets of relevant keywords may be associated with different locations [Ikawa et al., 2012], thus favouring guesses about the location of a tweet based only on the set of words it contains.
2.4. Home Location Inference Strategies 13 (friends) and user-centric data (tweets) into a unified probabilistic framework to profile the users’ home location. Similarly, Sadilek et al. [2012] have also explored patterns in friendship formation, but here in conjunction with the content of people’s tweets and their reported locations, showing that the combination of all these predictors result in a stronger and more accurate inference model. Finally, Lieberman and Lin [2009] have suggested that a wealth of information about contributors on Wikipedia 4
can be gleaned from edit histories, revealing that it is often possible to associate contributors with relatively small geographic regions, usually corresponding to where they were born or where they presently live.
As in these previous studies, this dissertation aims at proposing models to infer user home location. However, unlike them, we here focus on one of the most popular LBSNs, Foursquare. To our knowledge, no previous work has addressed this problem in this social network before. Our proposed models are based only on publicly available attributes which are specific of Foursquare, namely mayorships, tips and likes (detailed in Chapter 3). Basically, all these attributes are related with web pages that represent real places registered in the system: mayorships are titles given to the most frequent visitor of a place, tips are comments left by users about their previous experiences and opinions about the place, while likes are a sign of approval marked in a previously posted tip. These three types of information are locatable, since they are associated with the location (geographic coordinates) of the place to which they refer. Note that although various similar efforts [Hecht et al., 2011; Ikawa et al., 2012; Mahmud et al., 2012] have mostly explored the textual content of attributes, we here consider the location associated with attributes, proposing inference models that use them either in isolation or jointly. The techniques explored here – Majority Voting Scheme and the machine learning K-Nearest Neighbour algorithm – have also been adopted by some previous studies [Davis Jr. et al., 2011; Hecht et al., 2011]. However, we here apply these techniques to a dataset of millions of Foursquare users, providing inferences at a global scale, as opposed to previous efforts [Cheng et al., 2010; Backstrom et al., 2010; Sadilek et al., 2012] that restrict their inferences to a specific region.
4
Chapter 3
Foursquare Dataset
In this Chapter, we review the main elements and features of the LBSN Foursquare (Section 3.1) providing a description about some basic aspects of the system and also the terminology used throughout this dissertation. We also detail our crawling method-ology (Section 3.2) and present some properties of the dataset used in our experimental evaluation (Section 3.3). Then, we characterise our Foursquare dataset in terms of the main user attributes, which are publicly available through the system’s API and are geographically-referenced. Our goal is to assess how users can use these attributes, which are the basic input to our home location inference models, presented in Chap-ter 4. First, we standardise the location information associated with these attributes and analyse the quality of the data in terms of the level of spatial granularity
(Sec-tion 3.4). Then, in Sec(Sec-tion 3.5, we characterise those attributes assessing their usage around the world. We also perform a spatial and temporal analysis of the data to un-cover human mobility patterns and common behaviours. These results are discussed in Sections 3.6 and 3.7 respectively. And finally, we summarise our findings in Section 3.8.
3.1
Foursquare: Key Elements and Features
Foursquare, currently one of the largest and most popular LBSNs, was launched in early 2009 providing support to members location sharing with friends through check ins. Check ins are only performed on devices equipped with GPS or other service
reported location, in which a user may select a location from a list of places or he may create a page for his actual location, named venue. Thus, venues are places of a
wide variety of categories, such as restaurants, airports or residences, that represent real (physical) locations previously registered in the system. Examples are Taj Mahal (Agra, India) and Paradiso Restaurant (Belo Horizonte, Brazil). Foursquare has a
playful aspect that gives incentives to users who share more locations. Thus, the larger the number of check ins a user does, the more incentives she may earn to continue sharing. As incentives, Foursquare offers, for instance,badges and mayorships. Badges
are like medals earned if a user checks ins at specific venues or achieves some predefined number of check ins. Mayorships, in turn, are titles given to the most frequent visitor of a given venue in the last 60 days. Venue mayors are often granted rewards, promotions, discounts or even courtesies by business and marketing managers who own the venue. Although Foursquare was initially created with the primary intention of promoting a game between users competing for check ins as well as badges and mayorships, it also includes attributes (tips and likes) that favour the recommendation of places
among users. Tips are comments posted by users on specific venues which reflect their experiences and opinions about some aspect of visited places (e.g., the quality of service or availability of parking space in a restaurant or even instructions about how to find the place). Users can also keep track of previously posted tips, marking them as “like” to signal their agreement with the content of a tip.
Users in Foursquare can be categorised as standard user, celebrity or brand page.1 Standard users are common members, celebrities are standard users who achieved more than 1,000 friends2
and brand pages represent companies or shops. The main difference among them is the type of social relationship they can have: friendship and/or relation of following and being followed. Thus, while celebrities can have both friends and followers, brand pages can have just followers and standard users can have only friends. In the context of this dissertation, our focus is on publicly available attributes associated to some location information. Thus, for each user in our dataset, we consider the history of mayorships, tips and likes, all related with a venue, which in turn has necessarily a public geographic position declared in its Foursquare web page. Likewise, we also consider the user friends list, since they are associated with a home location, represented as a public and optional field in their profile page. Check ins are not considered, since they are a necessarily private attribute.
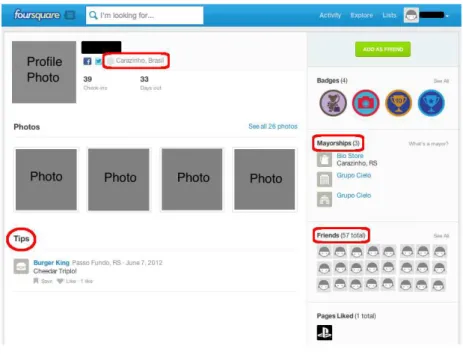
Note that mayorships, tips and likes are publicly available in Foursquare, and they are also broadcast to friends, appearing in their news feed. Figure 3.1 illustrates a system snapshot showing that the lists of mayorships, tips and friends (circled in red) are presented in the front page of a user profile – likes, on the other hand, only appear in feeds. Although optional, user home location is a public attribute and also appears in the profile page (next to the profile photo). Note that we cannot visualise the history
1
http://aboutfoursquare.com/user-type-comparison/ 2
3.2. Crawling Methodology 17
Figure 3.1. Snapshot of the Profile Page of a Foursquare User.
of check ins since it is a private information only visible by the user’s friends, who also receive notifications about their friends’ visits to venues.
3.2
Crawling Methodology
Our study is based on a large dataset crawled using Foursquare API from August to October 2011. We collected user profile data including home city, list of friends, mayorships, tips, likes, and total number of check ins. We also collected information associated with the venues visited by each user (i.e., venues linked to tips, likes and mayorships of the user), such as their location, category and total number of check ins and unique visitors. Recall that check ins were not collected, since they are not publicly available in the system, thus a private attribute.
Foursquare API to gather information about the corresponding user.
We send HTTP GET requests to the pages of specific users identified by their IDs (we tried increasing values, starting with 0) to verify their existence. The largest ID for which we did get a response corresponding to a valid webpage was 20 million. Although we experimented with many IDs greater than that value, in all those cases, the response wasNot Found. Therefore, we speculate that, at the time of our crawling,
20 million was about the largest user ID in Foursquare. We thus set this value as an estimate of the largest ID in the system and used it as input to our crawler.
3.3
Dataset Overview
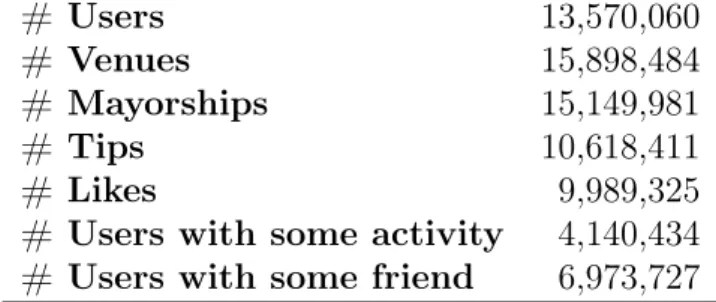
# Users 13,570,060
# Venues 15,898,484
# Mayorships 15,149,981
# Tips 10,618,411
# Likes 9,989,325
# Users with some activity 4,140,434 # Users with some friend 6,973,727
Table 3.1. Summary of Statistics about our Foursquare Dataset.
Table 3.1 provides some statistics about our Foursquare dataset. Our entire data consists of 13,570,060 users, which we believe represent a large fraction of the total user population of the system by the time it was crawled.3
It also includes 15,898,484 venues, which are in turn associated to users’ attributes, namely mayorships, tips and likes. Although Foursquare was fairly new during the crawling process, the amount of data collected about the user activity in the system, represented by his attributes, was noticeably significant since, in total, we collected 35,757,717 attributes, including mayorships, tips and likes. In summary, 30.5% of the entire user population in our dataset have some activity (in terms of the collected features) in the system, with 2,873,883 unique users having at least one mayorship and 2,396,013 and 1,802,997 with some tip and like, respectively. We also looked into the user’s list of friends and found that 51.4% of users are not isolated and have a social network.
3
3.4. Geographically Referenced Information 19
3.4
Geographically Referenced Information
The attributes considered in the proposed home location inference models are all geographically-referenced and publicly available in Foursquare. These attributes – de-scribed in detail in Section 3.1 – are the home city field, related to the location where a user lives, and the list of mayorships,tips and likes which, in turn, are associated with
the location of specific venues in the system. 4
Recall that the information supplied as the home location of users and venues are both free-form, which means that they are open text fields whose validity is not enforced by the system. Indeed, they may carry noise and invalid locations.
The user’s home city, in particular, is limited to 100 characters and is not required to be filled. It is expected that users provide the name of the city where they live, although the system provides neither a rule to guarantee it nor any automatic tool to help users fill out the field (e.g., a predefined list of cities from which the user could choose one). Thus, users are free to provide this location information at various granularities, ranging from specific addresses, to city, state and country names, or even regions of the planet (e.g., “North Pole”). We also observed some home city fields filled with emails, phrases, or even numbers in our dataset. Similarly, the location associated with a venue, and thus, indirectly, with mayorships, tips and likes of that particular venue, is also an open text field. Unlike the user home city, the address and the city of a venue must be filled at the moment of the creation of the venue page. Moreover, it is necessary to set a pin in a map to update the venue’s location, in which a pin is essentially a point in geographic coordinates. 5
However, once again, users may choose to provide invalid addresses and city names, or mark arbitrary locations in the map.
To standardise and filter location names of users and venues, we used theYahoo! PlaceFinder geocoding API.6
The tool was used to perform disambiguation, that is, to uniquely identify a city despite the existence of multiple name variations (e.g., NY, New York City, etc). It was also used to verify whether some locations provided by users are actually valid. For example some users claim to live in imaginary or non-locatable places such as “around”, “everywhere”, or even “at Justin Bieber’s heart” [Hecht et al., 2011]. The use of the Yahoo! PlaceFinder tool allowed us to identify and disregard
those non-valid places.
4
Check ins andBadgesare private attributes, and thus, it is not possible to access the geographic location associated with them.
5
The availability of location information in the form of coordinates opens an opportunity for more specific inferences regarding user home location, such as the inference of the user residence location, as discussed in Section 4.3.
6
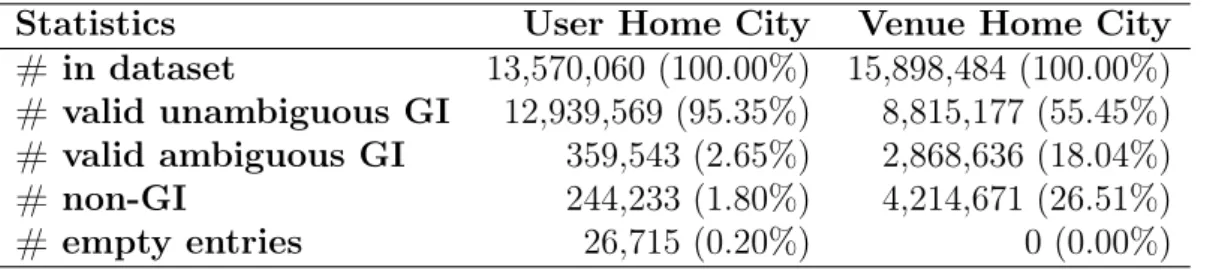
Statistics User Home City Venue Home City # in dataset 13,570,060 (100.00%) 15,898,484 (100.00%) # valid unambiguous GI 12,939,569 (95.35%) 8,815,177 (55.45%) # valid ambiguous GI 359,543 (2.65%) 2,868,636 (18.04%)
# non-GI 244,233 (1.80%) 4,214,671 (26.51%)
# empty entries 26,715 (0.20%) 0 (0.00%)
Table 3.2. Availability of Geographic Information (GI).
Basically, for a given query (text), the tool either returns some geographic data, in case the query consists of a valid location, or an error, otherwise. For queries consisting of valid locations, the tool’s response depends on the quality indicator of the query,
which, in turn, is an integer value between 0 - 99 that represents the finest spatial granularity (e.g., street, city, state, country) that matched the corresponding location information provided in the query. For instance, for the query “Belo Horizonte”,Yahoo! PlaceFinder would provide the query’s quality (equal to 40, indicating that it is at the
city level), the corresponding default geographic coordinates (the pair of latitude and longitude: -19.945360, -43.932678), a standardised city name (“belo horizonte”, in this case) as well as the state and country names (“minas gerais” and “brazil”).
Table 3.2 provides the distribution of the geographic information (GI) of all con-sidered attributes in the dataset. We present the total number of users and venues in the dataset, as well as the percentages of those users and venues that correspond to valid geographic information (real location), non-geographic information (e.g., emails, phrases) and no information declared (empty entries). The valid geographic informa-tion can be unambiguous or ambiguous. Ambiguous informainforma-tion correspond to locainforma-tion names that, though identified as valid, can refer to multiple places. One example is “Springfield” which is the name of ten different cities in the United States. In those cases,Yahoo! PlaceFinder is unable to decide which one is correct. Observe that tips,
likes and mayorships were grouped as venue attributes, while user attributes correspond only to the home city field.
3.5. Attribute Characterisation 21 decided to disregard users and venues with ambiguous geographic information as home city, which correspond to 2.65% and 18.04% of all users and venues, respectively, in our dataset.
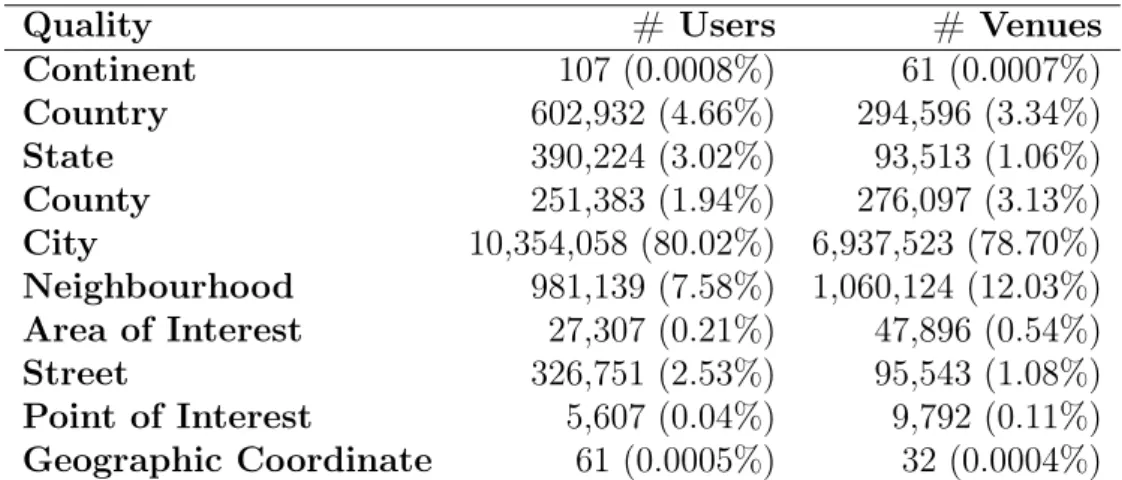
Quality # Users # Venues
Continent 107 (0.0008%) 61 (0.0007%)
Country 602,932 (4.66%) 294,596 (3.34%)
State 390,224 (3.02%) 93,513 (1.06%)
County 251,383 (1.94%) 276,097 (3.13%)
City 10,354,058 (80.02%) 6,937,523 (78.70%)
Neighbourhood 981,139 (7.58%) 1,060,124 (12.03%) Area of Interest 27,307 (0.21%) 47,896 (0.54%)
Street 326,751 (2.53%) 95,543 (1.08%)
Point of Interest 5,607 (0.04%) 9,792 (0.11%) Geographic Coordinate 61 (0.0005%) 32 (0.0004%)
Table 3.3. Quality of the Valid and Unambiguous Geographic Information.
Next, we analyse thequality indicator of the valid (and unambiguous) geographic
information available in the dataset. In Table 3.3, we present the distributions of the home location of users and venues across ten different quality levels, ranging from conti-nent to specific geographic coordinates. It is clear that the vast majority of Foursquare users and venues have location information at the city level or at finer granularities. However, over 1.2 million users provide home location information at coarser granular-ities (often at country level) letting inferences at finer-grained levels even more invasive in revealing sensitive information. Thus, in sum, for our inferences we consider loca-tions in the level of city or in finer granularities. Since each location is modelled for our inferences as a triple with the corresponding names of its city, state and country, 11,522,201 users and 8,127,790 venues are part of our experimental analysis.
Although we check the validity of the geographic information associated to the public user attributes, in this study we do not verify the veracity of the information. This means that fake attributes may exist in our dataset. Since the task to detect these attributes is not trivial, we do not apply any filter to remove them.
3.5
Attribute Characterisation
attributes for inference purposes in terms of the fraction of users we would cover as well as how those users and locations are spread around the world.
0 0.2 0.4 0.6 0.8 1
100 101 102 102 104 105
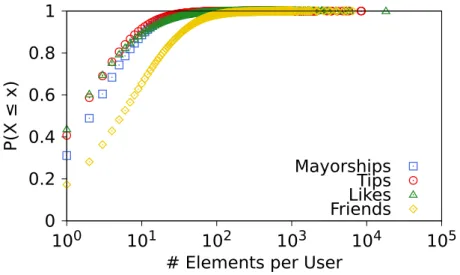
P(X
≤
x
)
# Elements per User Mayorships
Tips Likes Friends
Figure 3.2. Cumulative Distribution of the Location-based Attributes per User (log scale in the x-axis).
Considering the entire dataset (without any filtering), we observe that almost 4.2 million users, or around 30% of all users in our dataset, have at least one mayorship, tip or like. Out of these, around 1 million have only mayorships, 670 thousand have only tips and 367 thousand have only likes, whereas 890 thousand users have all three attributes. Beyond that, almost 7 million users (about 51% of the total number of users in the dataset) have at least one friend in the system, being around 47% of them with some activity represented by the attributes mentioned (mayorships, tips and likes). Thus, exploiting all these attributes to infer a user home city is promising as the required information is available in a large fraction of the whole dataset. Moreover, as shown in Figure 3.2 and consistent with previous analyses of Foursquare [Noulas et al., 2011; Vasconcelos et al., 2012], the distributions of the numbers of these attributes per user are very skewed, with a heavy tail, implying that few users have many mayorships (tips, likes or friends) while the vast majority have only one mayorship (tip, like or friend). Indeed, for users that have one mayorship (tip, like or friend), we find that 69% (59%, 56% and 83%) of the users have 2 or more mayorships (tips, likes and friends).
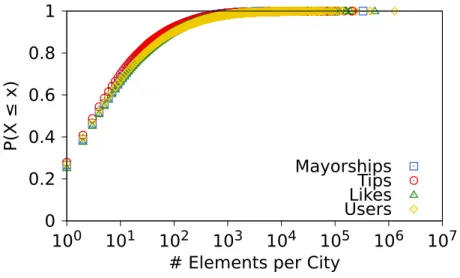
Figure 3.3 shows the distributions of numbers of mayorships, tips, likes and users per city7
, considering only cities with at least one instance of the attribute – in total,
7
3.5. Attribute Characterisation 23 0 0.2 0.4 0.6 0.8 1
100 101 102 102 104 105 106 107
P(X
≤
x
)
# Elements per City
Mayorships Tips Likes Users
Figure 3.3. Cumulative Distribution of the Location-based Attributes per City (log scale in the x-axis).
our dataset includes references to 100,629 different cities around the world. For such analysis, we only considered those attributes which are associated with real locations – validated by the process described in Section 3.4. As shown, the distributions are also very skewed, with a few cities having as many as 100 mayorships, tips, likes or users.
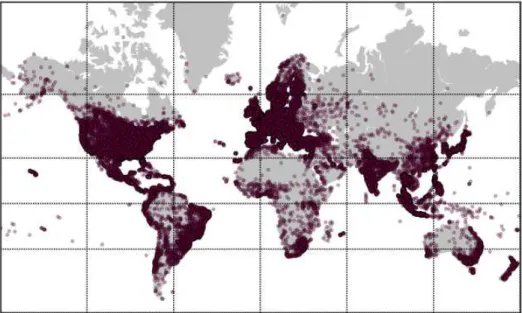
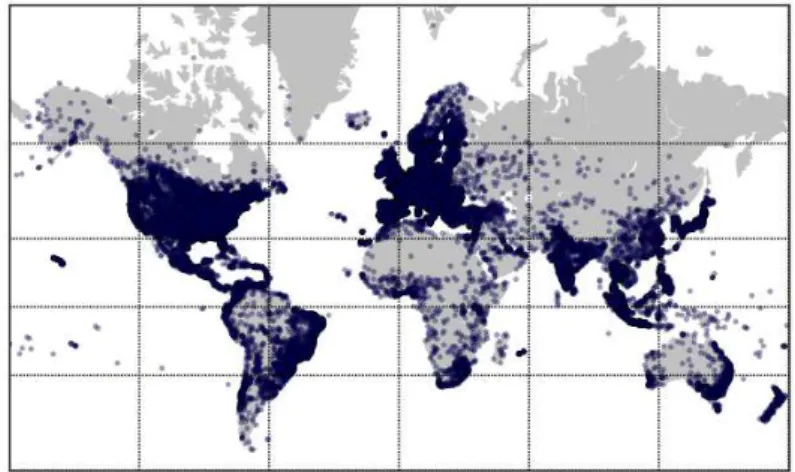
We now discuss the distribution of cities with users and venues around the world. Furthermore, we also show in distinct maps the cities with venues where users have mayorships, tips and likes. Once again, we only consider users and attributes associ-ated with real cities as location (validassoci-ated byYahoo! PlaceFinder). Figures 3.4 and 3.5 show these distributions in maps of the globe 8
, with each point representing a city. 9 As the maps show, Foursquare users and venues are spread all over the world, including remote places such as Svalbard, an archipelago in the Arctic Ocean, with coordinates (78.218590,15.648750). Moreover, all five maps are very similar, with most incidences of points in America, Europe and Southeast Asia. The distribution of venues, in Figure 3.4(a), aggregates the highest number of distinct cities (82,248) among all dis-tributions, showing that there are cities which host venues, but have no user registered in the system (since users comprise less cities, 76,918 in total – Figure 3.4(b)). We also observe that the distribution of mayorships, shown in Figure 3.5(a), is denser, with a total number of unique cities (75,169) much larger than in the distributions
compute the number of users per city, we counted the amount of all users with home location in each city.
8
The maps were plotted using theBasemappackage from Python’s library (http://matplotlib. org/basemap/users/geography.html)
9
(a) Venues.
(b) Users.
3.5. Attribute Characterisation 25
(a) Mayorships.
(b) Tips.
(c) Likes.
of tips and likes, which cover a total of 51,394 and 29,092 unique cities, respectively. The somewhat sparser map built from tips (Figure 3.5(b)) indicates that there are many cities, particularly in Canada, Australia, central Asia and Africa, where, despite the existence of venues and mayors, users do not post tips. The distribution of likes, shown in Figure 3.5(c), reveals an even sparser map, with most activity concentrated in touristic or developed areas, such as USA, western Europe and southeast Asia. We note that a similar map was produced for check ins in [Cheng et al., 2011b]. Even though both datasets were collected at different times, we find that their main areas of concentration do overlap.
We found that the cities with the largest numbers of mayorships tend also to have large numbers of tips and likes, although some interesting differences are worth noting. For instance, mayorships are more concentrated in Southeast Asia, in cities like Jakarta, Bandung and Singapore, which are the top three cities in number of mayorships, jointly having more than 500 thousand mayorships. Tips, in turn, are concentrated in different locations around the Earth: the top three cities in number of tips are New York, Jakarta and São Paulo, with a total of about 600 thousand tips. Likes, on the other hand, tend to be concentrated in venues in the United States, in cities like New York, Chicago and San Francisco, which jointly received around 1 million likes. Just as these attributes, users are also spread through the globe, being New York the city with the greatest concentration of members, around 1.3 million users – which is nearly three times more users than the second city with more users in the rank (Jakarta). Somewhat unexpected, New York is not the city which hosts the highest number of venues, being the fifth in the rank after three asian cities (Jakarta, Bandung, Singapore) and São Paulo.
3.6. Spatial Analysis 27 to the number of venues (ρ= 0.85and ρ= 0.80). Furthermore, the correlations among mayorships, tips and likes are betweenρ = 0.79andρ= 0.85. In contrast, the number of users across cities presents a slightly weaker (though still reasonably strong) posi-tive correlation (0.64≤ρ≤0.68) with the quantities of the other attributes, pointing out that the most active users in the system do not necessarily live in the cities that aggregate the most popular and touristic venues in the world.
ρ= P
i(xi−x)(yi−y)
q P
i(xi −x)2Pi(yi−y)2
(3.1)
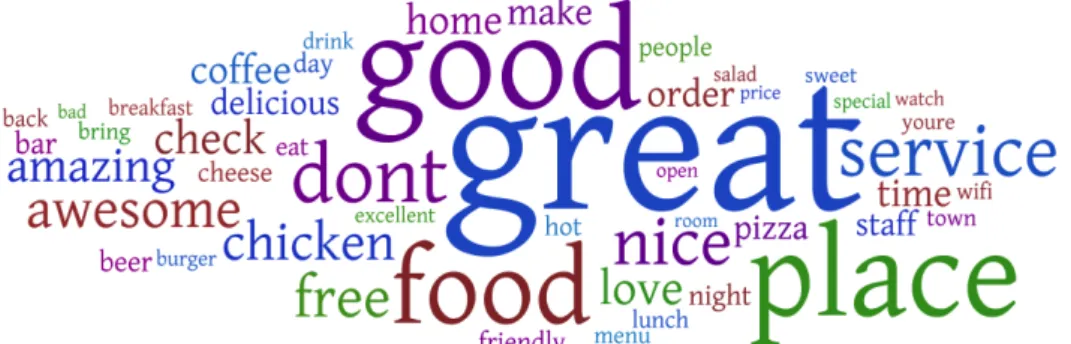
We also observe that most words extracted from tips in our dataset are adjectives or are related to food, services and generic places where one can eat or drink, as shown in Figure 3.6. We note that, although other studies [Cheng et al., 2011b] have exploited textual features to analyse user location, we here chose not to exploit the tip’s content as they are often targeted towards more generic topics such as food and service quality.
Figure 3.6. Tag Cloud of the Words Present in Tips.
3.6
Spatial Analysis
In this Section, we perform a spatial analysis of user activity in terms of tips and likes aiming at investigating how far users “move” between consecutive tips/likes. To that end, we make use of the venue location where the tip (or like) was left – to identify the geographic coordinate of the location considered, and the timestamp associated with tips and likes – to rank them into consecutive events in time. 10
10
0 0.2 0.4 0.6 0.8 1
0 2000 4000 6000 8000 10000 12000 14000 16000 18000 20000
2(X
≤
x
)
Displacement (Km)
Minimum Median Average Maximum
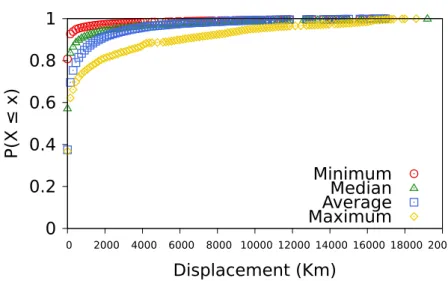
Figure 3.7. Cumulative Distribution of Displacements Between Consecutive Tips/Likes Posted per User.
We analyse the displacement between two venues visited in sequence by the user, as indicated by consecutive tips and/or likes of the user. For this analysis, we consider only users with at least two activities, provided that the venues associated with these activities have valid locations – validated by the procedure detailed in Section 3.4, with
quality of city level or finer granularities. Our dataset contains almost 1.5 million users
in this group. For these users, we computed the displacements between consecutive tips/likes by taking the difference between the geographic coordinates of the associated venues. We summarise user activity computing the minimum, median, average and maximum displacement per user. Figure 3.7 shows the distributions of these measures for all analysed users.
Around 37% of the users have average and maximum displacements of 0 kilome-tres, indicating very short distances (within a few meters). Moreover, 90% of the users have minimum displacements of up to 40 kilometres, which could be characterised as within the metropolitan area of a large city. Also, 70% of the users have an average displacement of at most 150 kilometres, possibly the distance between neighbouring cities. However, there are exceptions. Note that about 10% of the users have a maxi-mum displacement of at least 6,000 kilometres.11
Thus, overall, consecutive tips/likes of a user are often posted at places near each other. Such finding motivates the use of tips and likes in the proposed inference models as these attributes tend to be concentrated in specific regions. Although the exceptions
11
3.7. Temporal Analysis 29 represented by huge displacements beyond 6,000 kilometres (a possibly indication of a travel), on average, the majority of user displacements consist of short distances.
3.7
Temporal Analysis
Here, we perform a temporal analysis of user activity in terms of tips and likes aiming to analyse how often users leave tips/likes. To that end, we again make use of the timestamp associated with each tip and like to identify consecutive events in time and measure the interval between such events.
0 0.1 0.2 0.3 0.4 0.5 0.6 0.7 0.8 0.9 1
0 2000 4000 6000 8000 10000
P(X
≤
x
)
Temporal Difference (hour) Minimum
Median Average Maximum
Figure 3.8. Cumulative Distribution of Time Interval Between Consecutive Tips/Likes Posted per User.
0 0.2 0.4 0.6 0.8 1
0 24 48 22 96 120 144 168 192 216 240 264 288 312 336 360
Fr
eq
uen
cy
(t)
%
t (hour)
Figure 3.9. Distribution of Returning Times.
between consecutive tips/likes posted at the same venue by the same user. This anal-ysis is focused on 813,606 users, who have at least two tips/likes in the same venue, and cover more than 3 million returns. We here choose to show the distribution of all measured returning times, as opposed to summarising them per user first, so as to compare our results against previous findings of check in patterns [Cheng et al., 2011b]. Figure 3.9 shows the distribution, focusing on returning times under 360 hours, which account for 69.7% of all measured observations. The curve shows clear daily patterns with returning times often being multiples of 24 hours, which is very similar to the distribution of returning times computed based on check ins [Cheng et al., 2011b]. We note, however, that 50% of the measured returning times are within 1 hour, which can-not be seen in the Figure as its y-axis is truncated at 1% so that the rest of the curve could be distinguished. Moreover, out of these observations, 90% of them are at most 10 minutes. Thus, returning times, in general, tend to be very short. If we analyse the behaviour per user, we note that most users have very short minimum returning times, which is below 1 hour for 62% of the users. However, consistently with results in Figure 3.8, on average, median and maximum, users do tend to experience longer returning times. For instance, 52% of the users have average returning times of at least 168 hours.
3.8
Summary of this Chapter
3.8. Summary of this Chapter 31 Foursquare users in relation to their publicly available attributes in the system, namely home city field, history of mayorships, tips and likes, as well as list of friends. Since our focus is on the location information associated with attributes to build models to infer a user’s home location, we evaluate the validity and the quality of the locations declared for users and venues. Our findings show that:
• the vast majority of users provide valid locations in the home city field (98% of our dataset);
• despite the large fraction of non-geographic locations associated with venues (27%), about 73% of them are associated with valid geographic locations;
• 90% and 92% of user and venue locations, respectively, are in the level of city or in finer granularities.
We also characterised user activity in the system, showing that mayorships, tips, likes as well as friends are promising sources of information about a user’s home location as:
• 30% of the users in our dataset have some activity;
• almost 7 million users in our dataset have a non-empty list of friends;
• there are friends, mayorships, tips and likes spread all over the world, thus infer-ences using such attributes may be performed at a global scale (not limited to a specific region).
Finally, the study of the patterns followed by users in terms of their attributes can tell much about one’s behaviour whereas common observations reflect relevant insights to the development and analysis of home location inference models. Our main conclusions in this direction are:
• users tend to post tips and likes in a limited region, exhibiting short distances among displacements between consecutive attributes. This spatial locality might imply that these attributes are somewhat related with the location where the user lives;
Chapter 4
Home Location Inference Models
In this Chapter, we start by presenting our problem statement in Section 4.1. In Sections 4.2 and 4.3, we describe the techniques used to make inferences at the city and geographic coordinate levels, respectively. Then, in Section 4.4, we discuss the methodology adopted in our study, focusing on how we defined our ground truth and the metrics used to evaluate the proposed inference models.
4.1
Problem Statement
Location sharing can be exploited for several new services, such as targeted recommen-dation and advertisement, as well as to improve existing services (e.g., personalised search). Our focus here is on the implications of location sharing as to privacy vio-lation. Our main goal, in this dissertation, is to investigate whether it is possible to infer, with reasonable accuracy, the home location of Foursquare users using only pub-licly available attributes. Since Foursquare is in essence a LBSN, several features in the system have embedded geographic information, creating opportunities to explore the spatial aspect associated with each member. In this sense, we aim to aggregate every single piece of location information associated with a user (notably information associated with her lists of mayorships, tips, likes and friends) in an attempt to show the potential of the shared data in revealing virtual footprints, which in turn can guide us to where a user actually lives in the physical world. Moreover, we intend to exploit only publicly available user attributes to show to which extent such inferences can be made by anyone (as opposed to a friend of the user in the system).
The key assumption behind this study is that users tend to have mayorships, tips and likes in venues at the same location (e.g., city) where they live, and they also are likely to have friends living nearby. At first, one might think that the mayorship