SRef-ID: 1680-7359/adgeo/2006-7-31 European Geosciences Union
© 2006 Author(s). This work is licensed under a Creative Commons License.
Geosciences
The structure of convective rain cells at mid-latitudes
N. Rebora1and L. Ferraris1,2
1CIMA, University of Genoa and University of Basilicata, Savona, Italy 2DIST, University of Genoa, Genoa, Italy
Received: 11 November 2005 – Revised: 23 November 2005 – Accepted: 6 December 2005 – Published: 23 January 2006
Abstract. Rain cells are structures which represent an im-portant component of convective precipitation and a study of their properties represents a necessary step both towards improved stochastic models of small-scale precipitation and for the verification of deterministic high resolution local-area models. The case of intense convective precipitation in the tropics has been analysed in a recent study (von Hardenberg et al., 2003). Here we extend the analysis to mid-latitudes and we present results on the structure of convective rain cells observed by radar measurements in Italy. In particu-lar we consider the average shape of precipitation cells and its dependence on radar resolution and the distributions of el-lipticities.
1 Introduction
Intense rainfall events, both in the tropics and at midlatitudes, are dominated by the presence of convective rain cells. These structures may cause sudden floods in small catchments typ-ical of the Mediterranean environment and various hydroge-ological natural disasters in the these areas and in the Alps have been linked to strong convective precipitation (Hagen et al., 2000).
The study of the spatio-temporal structure of rain cells can be of relevance for the development of stochastic techniques for precipitation nowcasting or dowscaling (Ferraris et al., 2003) and for improving and verifying deterministic high-resolution limited area models (Parodi, 2005).
Rain cells are intense rainfall structures with spatial di-mensions of about 5–10 km that appear to be embedded in regions of more widespread rainfall. The cells tend to last around 30 min and to produce a peak precipitation of about 50–100 mm/h (Austin and Houze, 1972).
One of the basic properties of rain cells is the distribu-tion of the precipitadistribu-tion around the intensity peak. This
dis-Correspondence to:N. Rebora
(nicola@cima.unige.it)
tribution, i.e. the ”shape” of the rain cell, is an important free parameter for stochastic models for nowcasting or down-scaling (e.g. LeCam, 1961; Waymire et al., 1984; Eagleson et al., 1987; Anagnostou and Krajewski, 1997). Different shapes have been proposed in the past: simple top-hat pro-files (Cox and Isham, 1988; Wheater et al., 2000), Gaus-sian (Waymire et al., 1984; Eagleson et al., 1987), power-law (Ferraris et al., 2003) or exponential shapes (Capsoni et al., 1987). Non-gaussian cell shapes have been used in some stochastic rainfall models proposed both for hydrolog-ical purposes and for studies on propagation of electromag-netic waves; However only few works delved into the issue of determining the shape of these cells directly from observed radar rainfall fields (Feral et al., 2000; von Hardenberg et al., 2003).
In this work, we extend to mid-latitude radar observations the analysis procedure used by von Hardenberg et al. (2003) for tropical convective precipitation data, by considering a set of precipitation fields measured by an Italian meteorological radar. We identify the cells’ centers and we analyze the spa-tial distribution of precipitation intensity around each center. We show the effect of changing radar resolution and rain-fall estimation algorithm on some cells properties such as el-lipticities, precipitation volumes, peak intensities and shape found for the precipitation cores. The results are compared with the previous results obtained from the tropical TOGA-COARE dataset analysis.
2 Radar datasets
km
km
(a)
−30 −20 −10 0 10 20 30
30
20
10
0
−10
−20
−30 10
20 30 40 50 60 70 80 90
km
km
(b)
−30 −20 −10 0 10 20 30
30
20
10
0
−10
−20
−30 10
20 30 40 50 60 70 80 90
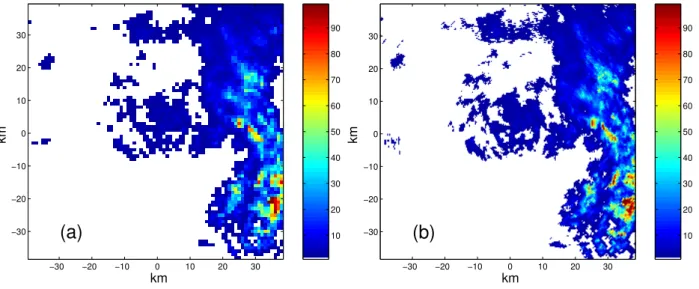
Fig. 1. Example of precipitation fields measured by Mount Settepani radar. Panel(a)shows a 1 km×1 km field (low-resolution) while in panel(b)the corresponding high-resolution (300 m×300 m) precipitation map, is presented. The colorbars indicate the precipitation intensity in mm/h.
x[km]
y[km]
−9 −6 −3 0 3 6 9
9
6
3
0
−3
−6
−9 10
20 30 40 50 60 70 80 90
Fig. 2. Example of high-intensity precipitation cell measured by Mt. Settepani radar. The colorbar indicates the precipitation inten-sity in mm/h.
fall precipitation at mid-latitudes and it includes a strong con-vective component.
The radar data considered here are measured every 10 min at two different spatial resolutions, 300 m and 1 km. We cre-ate three precipitation datasets by using both high- and low-resolution reflectivity (Z) and differential reflectivity (Zdr) fields:
– Z-R dataset, called LR1. The precipitation field, at a resolution of 1 km in space and 10 min in time, has been derived fromZ measurements by using the Marshall-Palmer relationship (R(Z)=0.0365Z0.625).
– (Z, Zdr)-R dataset (low resolution), called LR2. The precipitation field, at a resolution of 1 km in space and 10 min in time, has been derived by applying the follow-ing blended algorithm that accounts for bothZandZdr:
R(Z, Zdr)=0.0058Z0.91100.209Zdr (Bringi and Chan-drasekar, 2001).
– (Z, Zdr)-R dataset (high resolution), called HR. The precipitation field, at a resolution of 300 m in space and 10 min in time, has been derived by using the blended algorithm described above.
Figure 1 shows an example of high- and low-resolution precipitation fields obtained by using the (Z, Zdr)-R algo-rithm.
As a reference data set we consider also spatial maps of precipitation intensity measured during the TOGA-COARE campaign (Short et al., 1997). These fields have been ob-tained from radar reflectivity maps at a spatial-temporal reso-lution of 2 km and 10 min in the period from November 1992 to February 1993.
3 The shape of mid-latitude convective cells
0 0.1 0.2 0.3 0.4 0.5 0.6 0.7 0.8 0.9 1 0
0.5 1 1.5 2 2.5 3
ε=σm/σM
pdf(
ε
)
Settepani (Z)−R, LR1 Settepani (Z,Zdr)−R, LR2 Settepani (Z,Zdr)−R, HR TOGA−COARE
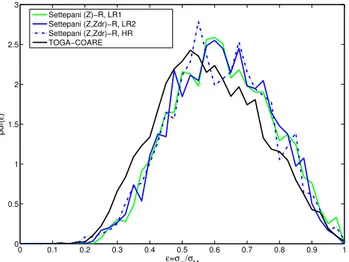
Fig. 3. Distribution of rain cells ellipticities. The different lines refer to the four datasets considered: light, green line,Z-R, low-resolution (LR1) dataset; continuous blue line: (Z, Zdr)-R, low
resolution (LR2) dataset; dashed blue line: (Z, Zdr)-R,
high-resolution dataset (HR);black line:TOGA-COARE.
The procedure identifies 1557 rain cells for the LR1 dataset, 1192 rain cells for the LR2 dataset, 947 rain cells for HR dataset and 3740 rain cells for TOGA-COARE fields. As an example, Fig. 2 shows a precipitation cell extracted from the high-resolution precipitation fields (HR dataset).
The selected rain cells are characterized by different ori-entations, areas, ellipticities and total precipitation volumes. We use the lengths of the the two principal moments of iner-tia of each cell,σMandσm, to characterize the lengths of the major and minor axes respectively.
The distributions of ellipticities,ǫ=σm/σMof the cells are reported in Fig. 3. As is clear from this figure, both the choice of the algorithm used for precipitation estimation and spatial resolution have not a significant effect on the cells axis ra-tio. TOGA-COARE cells have a distribution which is only slightly shifted towards lower ellipticities with respect to the distributions for Mt. Settepani fields. The average elliptic-ity of the TOGA-COARE rain cells isǫ=0.59 and the me-dian value isǫ0=0.57; for the LR2 dataset we haveǫ=0.62 andǫ0=0.62, similar results are obtained for the other dataset considered. To complete the overview on the properties of precipitation cells, in Fig. 4 are shown the probability butions of precipitation volumes (upper panel) and the distri-butions of peak intensities (lower panel).
In order to obtain an average shape characterizing cells in each field, we follow the same procedure as in von Harden-berg et al. (2003). Each rain cell is rotated aligning its major and minor axes with the same directions. Thei-th cell in the rotated reference system can be written as
Ri(x, y)=Vi8i(r, θ ), (1) whereViis the cell rainfall volume and8i(r, θ )is a function that represents the shape of the cell as a function of the radial
0 1000 2000 3000 4000 5000 6000 7000 8000 0
0.5 1 1.5 2 2.5x 10
−3
V, precipitation volume [mm/h]
p(V)
Settepani Z−R, LR1 Settepani Z−R, LR2 Settepani Z−R, HR TOGA COARE
0 50 100 150 200
0 0.01 0.02 0.03 0.04 0.05 0.06 0.07
I, precipitation intensity peak [mm/h]
p(I)
Settepani (Z)−R, LR1 Settepani (Z,Zdr)−R, LR2 Settepani (Z,Zdr)−R, HR TOGA COARE
Fig. 4.Distribution of rain cells precipitation volumes (upper panel) and distribution of rain cells intensity peaks (lower panel). The dif-ferent lines refer to the four datasets considered: light, green line, Z-R, low-resolution (LR1) dataset;continuous blue line:(Z, Zdr
)-R, low resolution (LR2) dataset; dashed blue line: (Z, Zdr)-R,
high-resolution dataset (HR);black line:TOGA-COARE.
distance from the cell center,r= q
x2/σ2
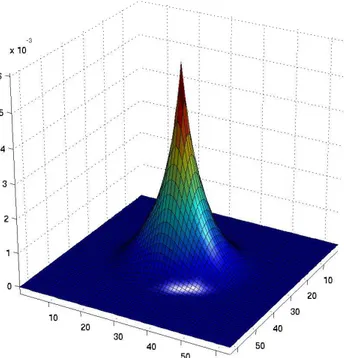
M+y2/σm2, and of the angular coordinate,θin the rotated reference frame. Accord-ingly the average cell shape can be obtained by rescaling the rotated cells to have unitary volume and rescaling the major and minor axes to unitary lengths. These rescaled and nor-malized cells can then be averaged to find an average shape
Fig. 5.Average shape of cells extracted from the LR2 dataset.
Fig. 6. The radial-averaged rainfall intensity profiles for the four datasets considered in this work. The different lines refer to the four datasets considered: light, green line, Z-R, low-resolution (LR1) dataset; continuous blue line: (Z, Zdr)-R, low resolution (LR2)
dataset; dashed blue line: (Z, Zdr)-R, high-resolution dataset
(HR);black line:TOGA-COARE.
present; future works will be devoted on investigating the de-pendence of rain cells shape on spatial resolution and on al-gorithms for precipitation estimation.
4 Conclusions
This preliminary work aims at investigating the behavior of mid-latitudes precipitation cells measured by a meteorologi-cal radar.
To evaluate the sensitivity of cell properties (ellipticity, volume, intensity peak and shape) to different methods of rainrate estimate and to radar resolution, we compare cells extracted from three different datasets derived from the same event measured by Mt. Settepani radar in North-Western Italy where two different rainrate estimate methods and two different resolutions were used. As reference dataset we use the rainfall fields measured during the TOGA-COARE cam-paign.
From this preliminary analysis we may conclude that the distributions of ellipticities, precipitation volumes and inten-sity peaks are not significantly sensitive to changes in radar resolution and do not have a clear dependence on the algo-rithm chosen for estimating rainrate field. The ellipticity dis-tributions found for Mt. Settepani rain cells are also very close to that obtained for the tropical precipitation cells mea-sured during the TOGA-COARE campaign.
The mid-latitude precipitation cells considered in this work show an average cell shape that is close to an exponen-tial profile. This result is consistent with those derived from the analysis of tropical precipitation cells (von Hardenberg et al., 2003). Future work will be devoted on investigating the dependence of rain cells shape on spatial resolution and on algorithms for precipitation estimation that use a full set of polarimetric variables.
Acknowledgements. We thank F. Marzano, J. von Hardenberg, M. Montopoli and F. Silvestro for interesting discussions. This work has been supported by Regione Liguria. We acknowledge also Regione Liguria and Regione Piemonte for providing us with data of Mt. Settepani polarimetric radar.
Edited by: V. Kotroni and K. Lagouvardos Reviewed by: S. Michaelides
References
Anagnostou, E. and Krajewski, W. F.: Simulation of radar reflectiv-ity fields: Algorithm formulation and evaluation, Water Resour. Res., 33, 1419–1428, 1997.
Austin, P. and Houze, R.: Analysis of stucture of precipitation pat-terns in New England, J. Appl. Meteorol., 11, 926–934, 1972. Bringi, V. and Chandrasekar, V.: polarimetric doppler weather
radar, principles and applications, Cambridge university Press, Cambridge, 2001.
Capsoni, C., Fedi, F., Magistroni, C., Paraboni, A., and Pawlina, A.: Data and theory for a new model for the horizontal structure of rain cells for propagation applications, Radio Sci., 22, 395–404, 1987.
Cox, D. R. and Isham, V.: A simple spatio-temporal model of rain-fall, Proc. R. Soc. Lond., 415(A), 317–328, 1988.
Eagleson, P., Fenessey, N., Quiliang, W., and Rodriguez-Iturbe, I.: Application of spatial Poisson models to airmass thunderstorm rainfall, J. Geophys. Res., 92(D8), 9961–9978, 1987.
Ferraris, L., Gabellani, S., Rebora, N., and Provenzale, A.: A com-parison of stochastic models for spatial rainfall downscaling, Wa-ter Resour. Res., 39, 1368–1384, 2003.
Hagen, M., Schiesser, H.-H., and Dorninger, M.: Monitoring of mesoscale precipitation systems in the Alps and the nothern alpine foreland by radar and rain gauges, Meteorol. Atmos. Phys., 72, 87–100, 2000.
LeCam, L.: A stochastic description of precipitation, in Proc. 4th Berkeley symposium on mathematical statistics and probability, Vol 3, pp. 125–151, University of California Press, 1961. Parodi, A.: Dynamics of intense convective rain cells, Adv. Geosci.,
2, 1–6, 2005.
Short, D. A., Kucera, P. A., Ferrier, B. S., Gerlach, J. C., Rut-ledge, S. A., and Thiele, O. W.: Shipboard Radar Rainfall Pat-terns within the TOGA COARE IFA, Bull. Am. Met. Soc., 78, 2817–2836, 1997.
von Hardenberg, J., Ferraris, L., and Provenzale, A.: The shape of convective rain cells, Geophys. Res. Lett., 30, 10.1029/2003GL018 539, 2003.
Waymire, E., Gupta, V., and Rodriguez-Iturbe, I.: A spectral theory of rainfall intensity at the meso-beta scale, Water Resour. Res., 20, 1483–1465, 1984.