Mária HOMIŠINOVÁ1
PERCEPTION OF SOCIAL DISCRIMINATION IN RESULTS OF THE
EUROPEAN SOCIAL SURVEY
2Summary. Empirical indices concerning social discrimination were applied repeatedly in the extensive sociological research (within The European Social Survey). They were applied in individual six rounds (in two-year cycles). The aim was to determinate the rate of generally perceived discrimination and to find particular reasons (forms) of discrimination (race, nationality, religion, language, ethnicity, age, gender, sexuality).
The aim of the study is to inform technical community on the knowledge in the socio-scientific field (perception of social discrimination in Slovakia and in other European countries) and to contribute to the enrichment of information base in the research sphere as well as to bring near sciences of different orientation.
Key words: all-European project ESS, social discrimination, empirical results.
POSTRZEGANIE DYSKRYMINACJI SPO
Ł
ECZNEJ NA PODSTAWIE
WYNIKÓW EUROPEJSKIEGO SONDA U SPO
Ł
ECZNEGO
Streszczenie. W metodyce obszernych badań socjologicznych (w ramach Europejskiego Sonda u Społecznego) w poszczególnych sze ciu edycjach (w cyklach dwuletnich) zostały zastosowane wska niki empiryczne, dotycz ce postrzegania dyskryminacji społecznej. Były one ukierunkowane na okre lenie stopnia ogólnie odczuwanej dyskryminacji oraz znalezienie konkretnych powodów (form) dyskryminacji (rasa, obywatelstwo, religia, język,
przynale-no ć etniczna, wiek, płeć, orientacja seksualna).
Celem artykułu jest zapoznanie tak e rodowiska technicznego z dorobkiem z dziedziny nauk społecznych i wzbogacenie w ten sposób bazy informacyjnej w sferze badawczej oraz zbli enie ró nych gałęzi nauki.
Słowa kluczowe: ogólnoeuropejski projekt ESS, dyskryminacja społeczna, wyniki empiryczne.
1
Institute of Social Sciences, Slovak Academy of Sciences, Karpatská 5, 040 01 Košice, Slovak Republic E-mail: homisin@saske.sk
2
1. INTRODUCTION
Discrimination is in modern democratic societies considered unacceptable and at least its above mentioned forms are at present forbidden by laws and international agreements. When Slovakia joined the European Union, it made a commitment to respect the legal system of European Union and to act in accordance with it. In Slovakia, besides Charter of Fundamental Rights and Freedoms, discrimination is forbidden by a number of other legislative rules. In 2004, Slovakia accepted so called Antidiscrimination Law No. 365/2004 Coll., which is based on an antidiscrimination guidance of European Union 2000/43/ES, 2000/78/ES. The law deals with the discrimination issue especially in the sphere of social security, health care, education, industrial relations and provisions of goods and it imposes an obligation to respect the principle of equal treatment. Besides the law, there are several sectoral laws and the labour code which also deal with discrimination.
European Union Law defines the following six discrimination reasons which secure stricter legal protection than other discrimination reasons:
- gender,
- race and ethnic origin, - age,
- health disability or adverse health, - sexual orientation,
- religion, belief or the fact that the person is not a believer.
2. METHODICS AND THE RELATION FRAMEWORK OF ANALYSES
In ESS methodics two variables dealing with the perception of social discrimination were repeatedly used.
To determine the rate of generally perceived discrimination, inhabitants of various countries (respondents) were asked the following question: Would you consider yourself a member of a group which is discriminated in your country? The use of a dichotomic scale (yes/no) enabled to differentiate the members who consider themselves discriminated?
To identify the particular forms of discrimination, the question was: Based on what is your group discriminated? In accordance with the valid law of EU the question defines eight forms of discrimination: race, nationality, religion, language, ethnic origin, age, gender and sexuality. Studying the discrimination reasons as independent research variables (items) enables us to find the rate of their individual action as well as to identify the most frequent form of discrimination (globally and within individual countries).
3. RESULTS
General perception of social discrimination with Slovak respondents, as individual research variables, enables us to find the rate of their individual action as well as to identify the most frequent discrimination form with Slovak respondents. We were also interested in results concerning respondents from other participating countries.
3.1. Perception of social discrimination
To make the orientation in research data easier, we present analysis results of generally perceived discrimination within the research files concerning all participating countries in individual research rounds.3 The results show that the representation of respondents who consider themselves discriminated does not vary considerably. In individual rounds discrimination was perceived with less than one tenth of respondents, between 6-8% from the overall number of respondents from all participating countries (average of individual rounds 6.7%). With each round the perceived discrimination increases and in the 6th round it reaches the average of M=7.6%.
Studying the middle values of the index of social discrimination, a slight tendency in increase (M 6.2 – 7.6%) within the rounds may be noticed. Great Britain and France are countries with the highest percentage of respondents who confirmed discrimination (without giving a reason) within five rounds of ESS.4 Highly ranked were countries including: Israel, Turkey, Estonia, Russia, Bulgaria.
Slovakia ranks among countries with a lower rate of perceived discrimination (average of percentage values in individual rounds is 4.9%).
Table 1 Countries with the leading percentage of respondents who confirmed discrimination
in their country
Rounds
Countries
ranked 1st %
Countries
ranked 2nd %
Countries
ranked 3rd %
1st round Israel 19.3 Great Britain 13.8 France 9.5
2nd round Turkey 13.1 Great Britain 10.2 Estonia 9.8
3rd round Estonia 14.5 Great Britain 13.7 France 10.2
4th round Great Britain 13.5 Russia 11.4 France 9.9
5th round Israel 16.5 Great Britain 11.6 Bulgaria 9.7
6th round Israel 16.9 Island 15.0 Kosovo 13.2
In Slovakia, compared to the overall tendency of discrimination perception some deviations were found. While in rounds 2 and 3 the percentage of Slovak respondents reaches 6%, in rounds 4 and 5 there was a decrease in the number of respondents perceiving their own discrimination and the perceived discrimination falls below 4%. In the 6th round the number of respondents perceiving discrimination increases slightly to 4.9%. The data show certain variation in general discrimination perception, which is caused by various socio-economical, political and other circumstances. In the following paragraph we take a closer look at the results identifying the reasons/forms of discrimination.
3.2. Forms of social discrimination
In the following analyses we were interested in the particular reasons of discrimination and in the fact they are ranked in the overall hierarchy of identified forms of discrimination. We focus on the global results concerning the respondents from all participating countries.
3
We present results from rounds 2-6. Slovakia was a participating country. 4
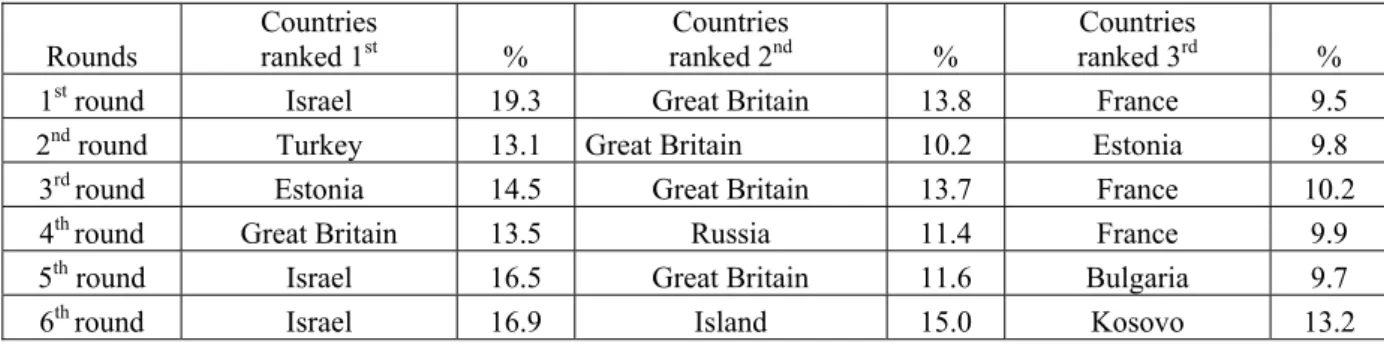
Fig. 1 shows results identifying the reasons of discrimination within the all file (respondents of all participating countries) according to individual rounds within 2004 -2012 (rounds 4-6). Results are presented in table 3 and fig. 1.
As far as discrimination forms are concerned, it is clear that nationality was the main reason of discrimination (individual rounds average – 19.3%). It was followed by age (15%), religion (14.4%) race (13.4%), ethnic origin (12.8%), language (11.2%), gender (9.6%) and sexuality (4.2%). The highest rate of discrimination was found in round 5, with the nationality discrimination reaching 21.7%.
Table 2 Forms of discrimination considered globally regarding individual rounds and participating
countries (%).
Country Race Nationality Religion Language Ethnicity Age Gender Sexuality
Round 2 11.7 18.6 12.9 11.5 7.9 13.8 9.7 4.3
Round 3 14 18 11.8 10.3 11.9 15 11.4 4.1
Round 4 12.7 18.4 14.6 12.1 14.2 18.9 10.5 4.1
Round 5 16.5 21.7 16.7 10.1 16.1 14.2 8 3.9
Round 6 12.3 19.6 16 11.9 13.8 13.2 8.7 4.5
% mean 13.4 19.3 14.4 11.2 12.8 15 9.6 4.2
Note: Percentage values are calculated from the overall number of affirmative answers given to a particular form of discrimination including affirmative answers to an option “other”.
Fig. 1. Discrimination reasons in all countries in individual rounds (%)
Rys. 1. Powody dyskryminacji we wszystkich krajach uczestnicz cych w sonda u, podział na po- szczególne edycje
Comparing answers concerning both indices of discrimination perception, it is necessary to emphasize that in each round the overall percentage of affirmative answers concerning identification of a discrimination form is higher than it results from the general question to mark a member of a group who perceives discrimination in the country. The reason for it is that several forms of discrimination could be given. For example, in round 6, 7.6% (N=3457) of respondents of all countries considered themselves discriminated. However, regarding the
Diskrimination reasons in all countres in individual rounds (%)
0 5 10 15 20 25
Race Nationality Religion Language Ethnicity Age Gender Sexuality
definition of a particular form of discrimination, as many as 11% of inhabitants (N=5099) perceived to be discriminated.
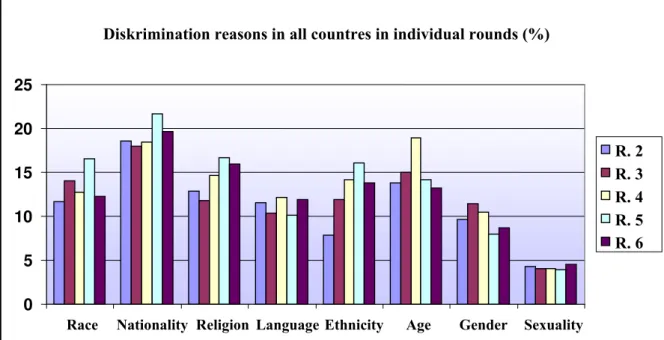
Slovak respondents in the course of rounds 2-6 assess discrimination forms differently compared to the overall file (table 4, fig. 2). The main discrimination reasons are: race, age, ethnicity followed by nationality, gender, religion, language and sexuality.
Table 3 Discrimination forms considered globally according to individual rounds in Slovakia
Formy dyskryminacji ocena globalna podział na poszczególne edycje na Słowacji
Slovakia Race Nationality Religion Language Ethnicity Age Gender Sexuality
Round 2 23.8 7.1 1.3 2.4 14.3 19 8.3 0
Round 3 23.6 17.3 6.4 9.1 22.7 22.7 16.4 0.9
Round 4 17.1 21.4 2.9 10 20 12.9 5.7 2.9
Round 5 25.4 11.9 2.9 0 17.9 19.4 4.5 0
Round 6 23.4 10.8 3.6 2.7 15.4 18.9 2.7 0.9
% mean 22.7 13.7 6.0 4.8 18.1 18.6 7.5 0.9
Note: In rounds 2-6 the percentage remaining to 100 % consists of respondents who chose another form of discrimination.
Fig. 2. Discrimination reasons in Slovakia in individual rounds of ESS (%)
Rys. 2. Powody dyskryminacji na Słowacji, podział na poszczególne edycje ESS (%)
In Slovakia, as well as in other countries, the overall percentage of positive answers to the identification of discrimination form is higher than it results from the question referring to the perception of general discrimination. In round 6, 4.9% (N=89) of respondents considered themselves discriminated (table 3). However, taking into account a particular form of discrimination, as many as 6% of respondents see themselves discriminated.
Results showing the discrimination forms in Slovakia present more significant deviations towards both positive and negative poles. While with race, ethnic and age discrimination there is an increase in discrimination cases compared to overall average, with nationality, religion and language discrimination, there is a fall in more than 6% (with each form). Gender discrimination reaches 2% and sexuality as a form of discrimination is perceived in rare cases. For your information, table 5 displays countries in which a certain form of discrimination
Discrimination reasons in Slovakia in individual round of ESS (%)
0 5 10 15 20 25 30
Race Nationality Religion Language Ethnicity Age Gender Sexuality
dominates among other forms, i.e. reaches the highest percentage in round 6 of ESS.
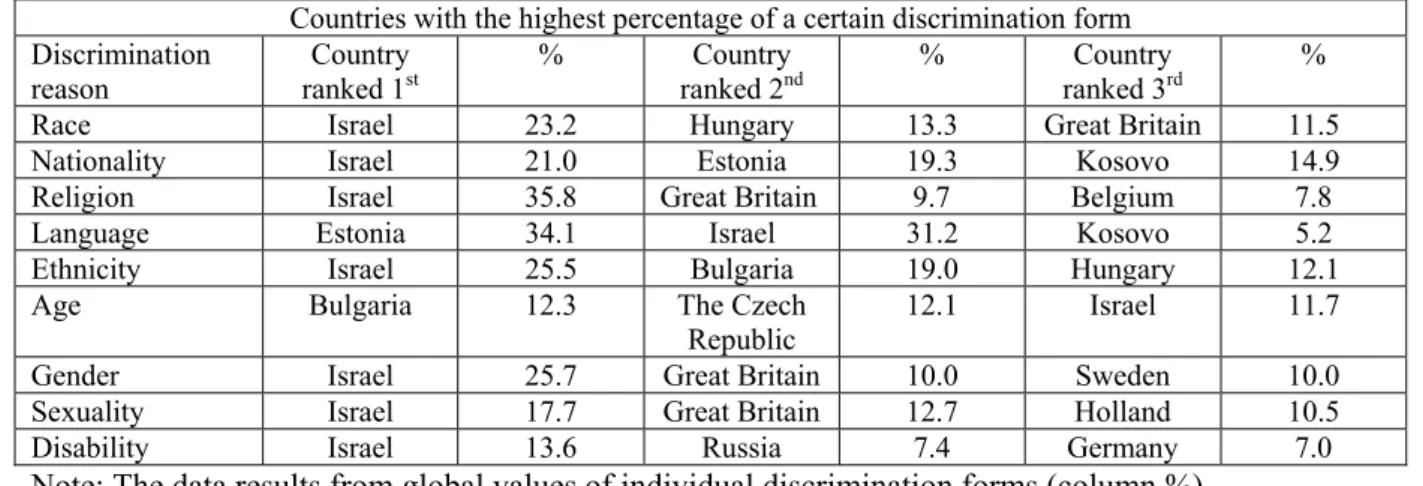
The table shows changes with the dominant countries, but at the same time it enables us to identify countries in which the perceived discrimination occurs in several forms. Discrimination reasons are dominant with respondents from Israel who reached top positions with each of discrimination form. Respondents from Great Britain strongly perceived discrimination forms of race, belief, gender and sexuality. Countries with two dominant forms are Estonia (nationality, language), Hungary (race, ethnicity), Kosovo (nationality, language). Other countries ranked top positions with only one discrimination form. The Czech Republic (age), Holland (sexuality), Germany (disability), Belgium (belief), Russia (disability) and Sweden (gender).
Table 4 Countries with the highest percentage with a certain discrimination form
Countries with the highest percentage of a certain discrimination form Discrimination
reason
Country ranked 1st
% Country ranked 2nd
% Country ranked 3rd
%
Race Israel 23.2 Hungary 13.3 Great Britain 11.5
Nationality Israel 21.0 Estonia 19.3 Kosovo 14.9
Religion Israel 35.8 Great Britain 9.7 Belgium 7.8
Language Estonia 34.1 Israel 31.2 Kosovo 5.2
Ethnicity Israel 25.5 Bulgaria 19.0 Hungary 12.1
Age Bulgaria 12.3 The Czech
Republic
12.1 Israel 11.7
Gender Israel 25.7 Great Britain 10.0 Sweden 10.0
Sexuality Israel 17.7 Great Britain 12.7 Holland 10.5
Disability Israel 13.6 Russia 7.4 Germany 7.0
Note: The data results from global values of individual discrimination forms (column %).
Data about Slovakia compared to other countries are as follows: race: 5.3%, nationality: 1.5%, religion (belief): 0.6%, ethnicity: 3.1%, age: 4.0%, gender: 0.9%, sexuality: 0.6%, disability: 4.0%.
Slovakia does not belong among countries with a dominant form of discrimination. Data from the table confirm that the percentage of respondents perceiving a discrimination form is compared to other dominant countries lower. On the other hand, especially the perception of race, nationality and ethnic discrimination confirms a long lasting inner-policy and foreign policy tension (especially with Hungary) in the regions referred to.
4. CONCLUSION
Bibliography
1. Antidiskriminačný zákon č. 365/2004, Z.z.
2. Gyárfášová O., Sekulov M.: Diskriminácia a viacnásobná diskriminácia. Inštitút pre verejné otázky, Bratislava 2010, www.ivo.sk.
3. Homišinová M.: Vnímanie sociálnej diskriminácie. Fedáková D., Kentoš M.: Sociálne procesy a osobnosť 2010. Zborník príspevkov [elektronický dokument]. Košice: Spoločenskovedný ústav SAV, 2011, s. 145-154.
4. Homišinová M.: Štátna, etnická a náboženská identita – ako samostatné charakteristiky a formy diskriminácie [In:] J. Výrost a kol.: Európska sociálna sonda (ESS) 5. kolo na Slovensku/ European Social Survey Round 5, SvÚ SAV, Prešov: Universum, 2012, p. 107-136.
5. Kentoš M.: Bezpečnosť, indikátory kvality života a religiozita. [In:] J. Výrost (ed.): Európska sociálna sonda 3. kolo na Slovensku. Prešov: Universum, 2008, p. 100-131. 6. Ma íková H., Petrusek M., Vodáková A.: Veľký sociologický slovník. I. a II. diel. Praha:
Karolinum, 1996.