www.nat-hazards-earth-syst-sci.net/9/441/2009/ © Author(s) 2009. This work is distributed under the Creative Commons Attribution 3.0 License.
and Earth
System Sciences
Heavy rains and extreme rainfall-runoff events in Central Europe
from 1951 to 2002
M. M ¨uller1,2, M. Kasˇpar1, and J. Matschullat3
1Institute of Atmospheric Physics AS CR, Prague, The Czech Republic 2Charles University, Faculty of Science, Prague, The Czech Republic 3TU Bergakademie, Freiberg, Germany
Received: 27 November 2008 – Revised: 12 February 2009 – Accepted: 24 February 2009 – Published: 19 March 2009
Abstract. Runoff data were used to better select histori-cally significant precipitation events. The suggested crite-rionQxexpresses the increase of a stream runoff over up to four days in a row. Tests confirmed thatQx maxima cor-respond to maxima of areal precipitation in the respective catchment. Ten significant precipitation events in summer half-years from 1951 to 2002 were selected in 25 catchments each, and further studied in respect to spatial extent, simul-taneous occurrence in various river basins, seasonal distribu-tion, and temporal variability. Four regions were recognised within Central Europe that show related seasonality and si-multaneous occurrence of events. The main coincidence of significant precipitation events was confirmed between the Austrian Alps and Bohemia and Saxony on one hand, and Moravia, Silesia, and Western Slovakia on the other hand. Significant events typically emerge here during peak sum-mer, in the south-eastern area of the Alps during autumn months, in the South-Eastern Carpathians from May to July, and in Western Germany in spring or autumn. Episodes with less significant precipitation events (around 1960 and 1990) alternate with inverse episodes (1970’s, second half of the 1990’s). A reasonable selection of reference events opens the door to a quantitative evaluation of dynamic and thermo-dynamic conditions typical for heavy rains in various parts of Central Europe.
1 Introduction
Significant and serious floods of major Central-European rivers (with catchments of at least several thousand km2) are connected with heavy precipitation events. These events
Correspondence to:M. M¨uller (muller@ufa.cas.cz
coincide with specific conditions in the related river basin, primarily snow melt in winter and spring, and possibly in-creased preceding soil saturation in summer. The events are characterized by (i) above average high precipitation sums and intensities for both time of year and for the given region, by (ii) a duration of several days, and (iii) by a relatively large area impacted by the precipitation. Such events are usually connected to typical synoptic-scale structures, e.g., cyclones, atmospheric fronts, etc.
Relations between circulation conditions and hydromete-orological consequences are generally studied by several ap-proaches, like real data analysis (e.g.,Rez´aˇ cov´a et al., 2005),ˇ
442 M. M¨uller et al.: Heavy rains and extreme rainfall-runoff events in Central Europe Heavy precipitation cannot hit all of Central Europe
si-multaneously. Thus, significant precipitation events have to be studied in individual sub-regions. To comply with hy-drological applications, these sub-regions should correspond to large river basins rather than administrative units. How-ever, to compute the areal precipitation amounts within many catchments across Central Europe, precipitation data from thousands of stations would be needed. These data are gen-erally not accessible or even available. Significant precip-itation events can be identified not only by a direct eval-uation of precipitation measurements but also through the analysis of runoff responses. If used correctly, the latter ap-proach may express the hydrological effect of the precipi-tation event even better – the main objective of this study. This work aims at (i) proposing a method to assess the ex-tremity of areal precipitation within a river basin through runoff data, (ii) verifying the method by comparison with the precipitation-based approach, (iii) presenting significant pre-cipitation events in 25 independent Central-European river basins (Fig. 1), and (iv) studying them from the perspec-tive of seasonal and inter-annual distribution, simultaneous occurrence etc. Since snow characteristics can strongly in-fluence related results, this study was restricted to the sum-mer half-years (May–October), when significant snowfall in precipitation or significant snow melt processes can be ne-glected.
2 Data and selection methods for significant events
Significant precipitation events with corresponding hydro-logical responses were selected using runoff data, while pre-cipitation data were used for evaluating the results within several river basins. Available data series from both rain gauge and discharge gauge stations were of variable length. The period from 1951 to 2002 was selected as a compro-mise between length of the period and completeness of the data sets. Within 52 summer half-years, 10 significant events were chosen from each river basin to obtain a meaningful re-turn period of such an event of approximately at least five years.
2.1 Selection based on runoff data
The hydrological data needed to select significant precipita-tion events were provided by the Global Runoff Data Cen-tre (GRDC) in Koblenz, Germany. That database comprises values of mean daily flow (Qd) for many rivers worldwide. Here, river basins were selected, based upon catchment area and length of the data series. Areas up to ca. 25 000 km2 seemed to be most promising. Transformation processes of flood waves in larger catchments are usually too complex, thus preventing the use of these data as an indicator for the extremity of a precipitation event that caused a flood. All
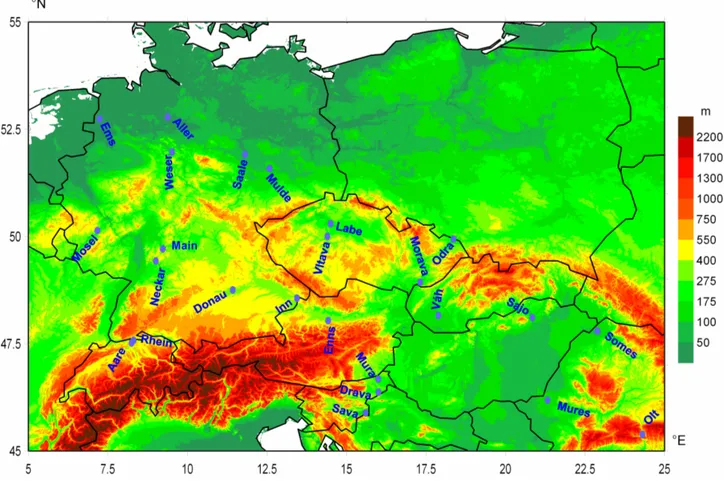
selected river basins and gauge stations are listed in Table 1 and depicted in Fig. 1.
When evaluating the extremity of precipitation events us-ing runoff data, the rainfall impact must be distus-inguished from other effects that influence runoff, mainly the preced-ing soil saturation. Such effects can be filtered by selectpreced-ing an appropriate hydrological indicator. Several ones of these are discussed here in respect to their ability to express the extremity of precipitation events:
– Qmax. . .local maximum of absoluteQdvalues; – Qmax−Qmin. . .difference between a Qmax value and
the Qd minimum, registered from 1 to 4 days before (∼Qmin);
– Qmax/Qmin. . .ratio of these maxima and minima ofQd. The criterionQmaxcould not be used because runoff max-ima do not necessarily coincide with precipitation maxmax-ima. Qmax−Qminseems to be more suitable but obviously under-emphasizes the role of the preceding saturation. When using this indicator, events with the same difference between the QmaxandQminvalues are assessed as identically extreme in-dependent fromQmin(Fig. 2). In fact, a precipitation amount Rusually produces comparatively higher discharge increase withQmin(A)than withQmin(B)ifQmin(A)>Qmin(B) be-cause less precipitation water is retained in the catchment.
Inversely,Qmax/Qminoveremphasizes the role of the an-tecedent saturation because if, e.g., Qmin(A)=2Qmin(B), thenQmax(A) would be lower than 2Qmax(B). The iden-tical extreme events should lie on parabolic lines in Fig. 2, since the role of the antecedent saturation relatively drops with higherQmin. Therefore, a compound criterionQxwas designed that combines information of both the difference and the proportion betweenQmax andQmin. The criterion Qxis calculated according to
Qx=
(Qmax−Qmin)Qmax
Qmin+Qmed , (1)
Fig. 1.Discharge gauge stations, closing particular river basins, where significant precipitation events were identified. The position of the river name and its direction relatively to the station suggest the course of the river up to the station.
2.2 Selection based on precipitation data
To verify the selection method presented above, the extrem-ity of large-scale precipitation in several river basins was studied using areal precipitation amounts. First, daily pre-cipitation totals from gauge stations were interpolated by kriging into a regular grid. Then, areal daily precipitation amounts within a river basin were expressed as the mean precipitation total, calculated from grid-points located within the river basin.
Daily precipitation totals do not represent significant pre-cipitation events adequately because such an event usually lasts for several days. Thus, periods of three days were used to evaluate the extremity of precipitation events. Neverthe-less, the temporal distribution of the precipitation in these days has to be observed since a temporal concentration of rain makes an event more dangerous from the hydrological point of view. The mean value does not express this, leading to the criterion:
Rx=
3Rmax+2Rmed+Rmin
6 , (2)
where Rmax is the maximum daily areal precipitation amount, Rmed is the medium daily areal precipitation
amount, andRmin is the minimum daily areal precipitation amount in the three-day period. Further details are discussed in Kaˇspar and M¨uller (2008).
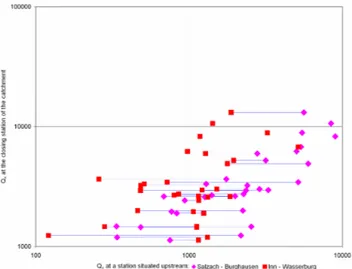
2.3 Discussion and comparison of the selection methods It should be discussed first whether the selection of Qx is representative enough for a river basin when data from a sin-gle discharge gauge station are used. A comparison of high Qxvalues at three stations in the Inn River catchment is pre-sented: Passau (located close to its mouth into the Danube: 26 084 km2) Wasserburg (located upstream from the conflu-ence with the Salzach: 11 983 km2); Burghausen (located on the Salzach: 6 649 km2). Figure 3 shows that particu-larly highQx values at the closing station of the river basin are accompanied by high values of Qx at least at one of the stations upstream. The cases with values ofQx at one of the stations upstream (Wasserburg or Burghausen) higher than downstream (Passau) can be explained by transforma-tion processes of flood waves.
444 M. M¨uller et al.: Heavy rains and extreme rainfall-runoff events in Central Europe
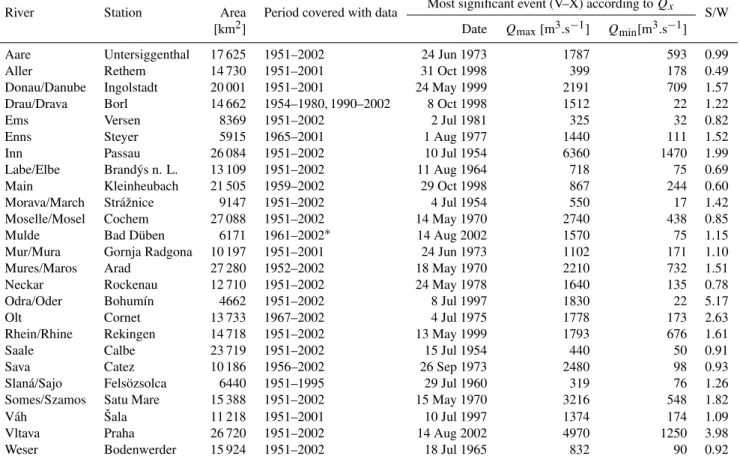
Table 1.River basins and discharge gauge stations. The last column indicates the proportion between maximalQdin summer and in winter half-years.
River Station Area Period covered with data Most significant event (V–X) according toQx S/W [km2] Date Qmax[m3.s−1] Qmin[m3.s−1]
Aare Untersiggenthal 17 625 1951–2002 24 Jun 1973 1787 593 0.99 Aller Rethem 14 730 1951–2001 31 Oct 1998 399 178 0.49 Donau/Danube Ingolstadt 20 001 1951–2001 24 May 1999 2191 709 1.57 Drau/Drava Borl 14 662 1954–1980, 1990–2002 8 Oct 1998 1512 22 1.22
Ems Versen 8369 1951–2002 2 Jul 1981 325 32 0.82
Enns Steyer 5915 1965–2001 1 Aug 1977 1440 111 1.52 Inn Passau 26 084 1951–2002 10 Jul 1954 6360 1470 1.99 Labe/Elbe Brand´ys n. L. 13 109 1951–2002 11 Aug 1964 718 75 0.69 Main Kleinheubach 21 505 1959–2002 29 Oct 1998 867 244 0.60 Morava/March Str´aˇznice 9147 1951–2002 4 Jul 1954 550 17 1.42 Moselle/Mosel Cochem 27 088 1951–2002 14 May 1970 2740 438 0.85 Mulde Bad D¨uben 6171 1961–2002∗ 14 Aug 2002 1570 75 1.15 Mur/Mura Gornja Radgona 10 197 1951–2001 24 Jun 1973 1102 171 1.10 Mures/Maros Arad 27 280 1952–2002 18 May 1970 2210 732 1.51 Neckar Rockenau 12 710 1951–2002 24 May 1978 1640 135 0.78 Odra/Oder Bohum´ın 4662 1951–2002 8 Jul 1997 1830 22 5.17 Olt Cornet 13 733 1967–2002 4 Jul 1975 1778 173 2.63 Rhein/Rhine Rekingen 14 718 1951–2002 13 May 1999 1793 676 1.61 Saale Calbe 23 719 1951–2002 15 Jul 1954 440 50 0.91 Sava Catez 10 186 1956–2002 26 Sep 1973 2480 98 0.93 Slan´a/Sajo Fels¨ozsolca 6440 1951–1995 29 Jul 1960 319 76 1.26 Somes/Szamos Satu Mare 15 388 1951–2002 15 May 1970 3216 548 1.82 V´ah ˇSala 11 218 1951–2001 10 Jul 1997 1374 174 1.09 Vltava Praha 26 720 1951–2002 14 Aug 2002 4970 1250 3.98 Weser Bodenwerder 15 924 1951–2002 18 Jul 1965 832 90 0.92
∗
Precipitation data 1951–2002.
and precipitation data were at our disposal. If the selection result were identical for both criteria, every catchment would be represented by ten symbols, and higherRx values would correspond to higherQx values in Fig. 4a. However, if the selection by both criteria were completely different, every catchment would be represented by up to twenty symbols. Ten of these would be located in the upper left part, the others in the bottom right part of the diagram.
The main conclusions are as follows:
– significant events selected by bothRx andQx is very similar in mountain and rather homogeneous catch-ments such as of the Mulde and the Odra rivers. The maxima of both criteria correspond; the sets of signifi-cant events in terms ofRx andQx are almost identical but their ranking can be somewhat different;
– the criteriaRx andQx are also related when a stream is significantly influenced by reservoirs (like Vltava in Prague); however, some events with highRxfollowing after a dry period are characterised by rather lowQx because the flood wave could be transformed;
– in catchments representing extensive lowlands (e.g., Labe/Elbe), processes of flood wave transformation play a significant role. Thus, the sets of significant events in terms ofRxandQxpartly differ;
– event rankings byRx andQx can strongly differ in a complex catchment such as the Morava River. This can be explained by the crucial precipitation effect in the orographically exposed Beˇcva sub-catchment on the
flow of the Morava in Str´aˇznice. Thus, the ranking of precipitation events byQxof the Morava in Str´aˇznice is more similar to the ranking of precipitation events byRx in the Becva river basin as compared to the entire catch-ˇ
ment. Thus, when selecting byQx, significant events can be characterized by extreme precipitation amounts only in a crucial part of the catchment, not within the entire catchment.
Fig. 2. Comparison between indicatorsQmax−QminandQx on the Vltava River in Prague in summer half-years 1951–2002. The episodes with any discharge increase (Qmax>Qmin) are repre-sented by yellow signs. Naturally, the discharge increase is usually small so the signs are concentrated just above the lineQmax=Qmin. In this case,Qsat=577 m3s−1. The selected isolines ofQx repre-sent values from bottom 100, 500, 2000, 5000, 10 000, and 20 000.
Fig. 3.Relation betweenQxvalues at three stations in the Inn river basin: Burghausen, Wasserburg (x-axis), and Passau (y-axis). Only events with twenty highestQxvalues at least at one of the stations are depicted.
the notion that a proper hydrological criterion of precipita-tion extremity should consider discharge increases and not only peak flows (compare Fig. 4a and b). With the suggested limitations in mind, the events with particularly highQx
val-Fig. 4.Comparison of(a)RxandQxvalues and(b)RxandQmax within five studied catchments. Ten highest values of each consid-ered criterion within each catchment are depicted.
446 M. M¨uller et al.: Heavy rains and extreme rainfall-runoff events in Central Europe
3 Significant precipitation events in Central Europe from 1951 to 2002
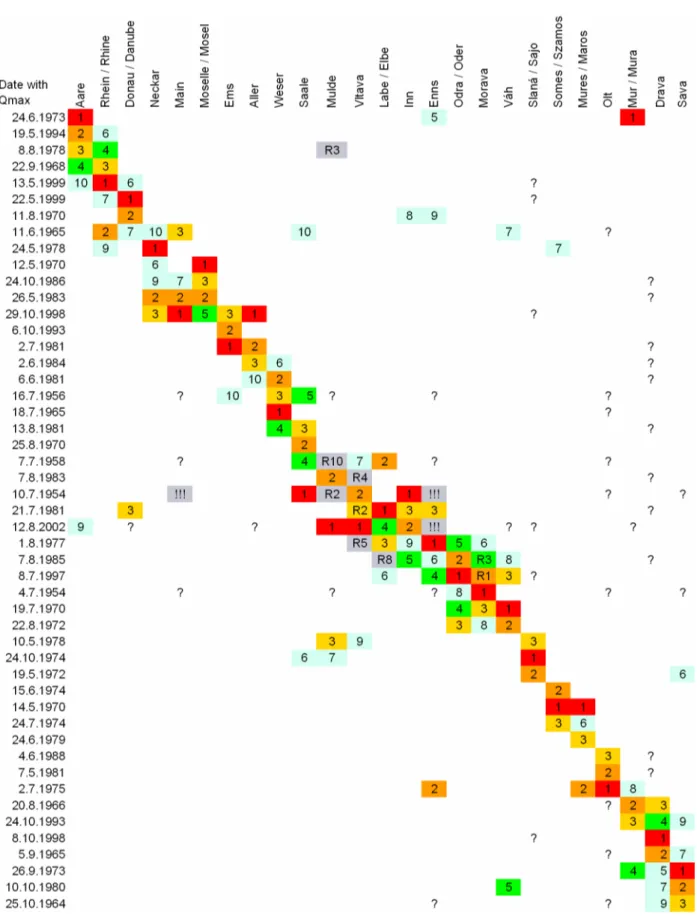
Significant precipitation events were selected byQx, follow-ing data accessibility. Figure 5 lists three events with the highest values of the criterion in every catchment. Only sum-mer half-years were considered, even though winter precip-itation events and floods are more significant in some catch-ments (see S/W values in Table 1). The given date refers ap-proximately to the end of the precipitation event (date with Qmax). If an event hit more than one river basin over several days, only the first day is mentioned.
3.1 Spatial extent of events and their seasonal distribution Simultaneous occurrence of significant precipitation in more catchments can be studied from Fig. 5. Evidently, signifi-cant precipitation often hits two or more catchments simul-taneously. If more than one catchment is hit, then these are usually neighbouring river basins. The ranking of lines and columns in Fig. 5 is motivated by the effort to put together the events, which affected the same catchments, and to put to-gether the catchments, which are usually hit simultaneously. The main concentration of significant precipitation into sev-eral events was detected in the central part of the studied re-gion. However, no event ever hit the entire rere-gion. Precipita-tion usually spread from the northern slopes of the Austrian Alps either into the western part of the region (Bohemia and Saxony) as in August 2002 or into the eastern one (Moravia, Silesia, and Western Slovakia) as in July 1997. This can be considered a consequence of cyclones moving from the Mediterranean into Central Europe along the so-called Vb track (van Bebber, 1883; Mudelsee et al., 2004). The most intense precipitation typically falls in a rather narrow band of enhanced horizontal pressure gradient in the leeward sec-tor of the cyclone. The usually limited zonal range of the affected area is determined by the zonal component of the movement of the cyclone.
A synchronisation of significant precipitation appears at the south-eastern slopes of the Alps, too. Local precipitation events are quite isolated and rarely spread into other parts of Central Europe. Another area with a simultaneous occur-rence of significant precipitation events is Western Germany. These events are characterised by a duration longer than three days. While these events often spread into the central part of the studied region, they are not so significant there.
The catchments were additionally investigated from the perspective of temporal distribution of significant precipi-tation events from May to October (Fig. 6). Even though only summer half-years were included, several regions with specific regimes of significant precipitation can be distin-guished:
– Central region, comprising the Austrian Alps (Inn, Enns), the Czech Republic (Vltava, Labe, Odra, Morava), Saxony (Mulde, partly Saale), and Western
Slovakia (V´ah). July and August is the dominant period in respect to significant precipitation events;
– South-eastern region– rivers running eastward from the Eastern Alps (Sava, Drava, partly Mura). Significant precipitation usually emerges in autumn;
– Eastern region, comprising Eastern-Carpathian Rivers (Somes, Mures, Olt). The first months of the warm half-year (May to July) seem to be most important from the viewpoint of significant precipitation. However, it can-not be excluded that thawing could influence the values ofQxin May;
– Western region– rivers in the western part of Germany (Mosel, Neckar, Main). Summer half-year events are usually not very extreme unlike the typical dominance of winter heavy rains and floods. Detected events oc-curred mainly at the beginning of and at the end of the studied half-years.
3.2 Exceptional events
Considering the extent of the affected area, the size of the rivers, and the extremity ofQx, several events can be high-lighted in the study period as the most significant precipita-tion events in summer half-years:
– the August 2002 floods in Austria, Bohemia, and Sax-ony. Precipitation was extreme in the Vltava and Mulde catchments on 11–13 August. The hydrological effect was enhanced by a previous event five days earlier in southern Bohemia and in Austria (Ulbrich et al., 2003);
– the July 1997 floods in Moravia, Silesia, and Western Slovakia. Then, all criteria discussed above reached un-precedented values especially in the Odra river basin (Kundzewicz et al., 1999);
– the flood at the turn of October and November 1998 in the western part of Germany (Engel, 1998). The event occurred at the end of the summer half-year but its de-velopment was similar to the winter floods that are typ-ical for this region;
– floods in the South-Eastern Carpathians in June and July 1975. The value ofQxwas more than three times higher on 4 July 1975, then ever on Olt. Heavy rain affected the Eastern Alps, too; particularly the Enns river basin at the beginning of the event;
– significant precipitation hit rivers coursing from the Eastern Alps in September 1973. The event followed a dry period and the runoff values did not reach their maxima;
448 M. M¨uller et al.: Heavy rains and extreme rainfall-runoff events in Central Europe
Fig. 6. Intra-annual variability of the occurrence of significant precipitation events in the catchments. Dots represent the ten events with highestQxvalues in the catchment. The position of the dot relative to the centre of the diagram expresses when the event occurred (clockwise from May to October). The ranking of the event according toQxis expressed by the distance from the centre of the diagram – the maximum is depicted at the external circle. The position of the discharge gauge stations, closing particular river basins, are indicated by small crosses (+).
– the July 1954 floods in Austria, Bohemia, and Germany (H.Z.B., 1955). The extent was quite similar to August 2002 but precipitation spread unusually further the west (into the catchments of Saale, Main, and Aller).
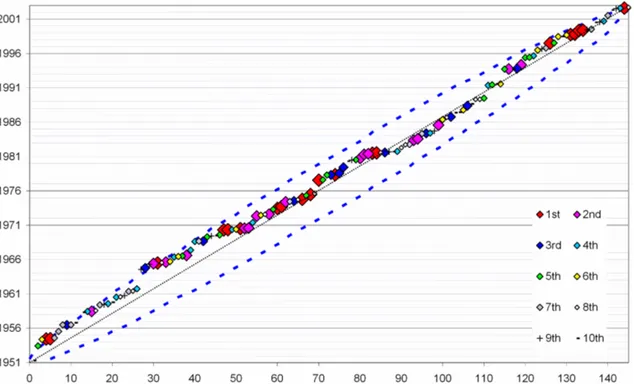
3.3 Temporal variability from 1951 to 2002
The density of significant Central-European precipitation events during the studied period is depicted in Fig. 7. When the event symbols are located above the diagonal, it signals a period with less significant precipitation, and vice versa. Since the number of selected events is rather low, the station-arity was tested with respect to the binomial distribution with 95% tolerance interval. If there was a significant increasing or decreasing trend, the experimental curve would lie below the lower or above the upper blue curve, respectively. The events ranking has not to be considered absolutely accurate and the interannual variability is influenced by data leakage at the beginning of the studied period and the role of reser-voirs in some catchments. However, some interpretations of this series can be presented:
– more significant precipitation events are concentrated in two periods: the 1970’s with a maximum at the turn to the 1980’s and in the second half of the 1990’s;
– the most significant precipitation events (Sect. 3.2) are markedly accumulated in the first half of the 1970’s and in the last few years of the study period;
– years around 1960 and mainly the second part of the 1980’s and the early 1990’s were characterised by less significant precipitation.
Fig. 7.Temporal distribution of 145 significant precipitation events in Ccentral Europe from 1951 to 2002. Ten events per catchment with the highestQxvalues (1st –10th) are depicted in the diagram. If an event hit more than one catchment, the sign represents the highest reached extremity. The blue dashed curves restrict the area with no significant trend in the frequency of events with 95% tolerance interval.
4 Conclusions
Selection of historically significant precipitation events that will be utilised in detecting their causes from the perspective of atmospheric circulation could be refined. It was demon-strated that runoff data can be used for this purpose in the summer half-years if a well-defined criterion is used. Such a criterionQxis being suggested and tested using precipita-tion data. This criterion expresses the increase of a stream water volume and balances the impact of both the difference and the proportion of flow rates over several days in a row. Tests confirmed that the highestQx values at a gauge sta-tion correspond with significant precipitasta-tion events, defined by weighted three-day areal precipitation totals in the catch-ment. The correspondence between precipitation and flow increase maxima is better in simple and in mountain catch-ments. In a more complicated basin with diverse character-istics of individual tributaries, the maxima of flow increase at the gauge station can represent significant precipitation events only in a crucial part of the catchment.
Ten significant precipitation events were selected in sum-mer half-years from 1951 to 2002 in each of 25 catchments, and further studied in respect to spatial extent, simultane-ous occurrence in different river basins, seasonal distribution, and temporal variability. There were 145 events instead of 250 since heavy precipitation often hits more than one river basin. Apart from neighbouring catchments, coincidence of
significant precipitation events was confirmed between the Austrian Alps and i) Bohemia and Saxony, and ii) Moravia, Silesia, and Western Slovakia. The probable connection with the Vb track of Mediterranean cyclones will be studied fur-ther.
In respect to seasonality and simultaneous events occur-rence, four regions could be distinguished within Central Europe. Significant events typically emerge in the central part of the region during peak summer, in the south-eastern area of the Alps during autumn months, in the South-Eastern Carpathians from May to July, and in western Germany in spring or autumn. Considering entire years, however, precip-itation events are not so significant within the latter region.
Significant precipitation events were not distributed evenly over the studied time span. Considering all catchments to-gether, two episodes with higher concentration of signifi-cant precipitation were recognised (1970 to 1981 and 1996 to 1999). In contrast, less significant precipitation charac-terised the years between these episodes, with a minimum at the beginning of the 1990’s.
450 M. M¨uller et al.: Heavy rains and extreme rainfall-runoff events in Central Europe of quantities representing such conditions and occurrence of
significant precipitation in Central Europe are the object of further investigations.
Acknowledgements. This work was supported by the re-search program MSM 0021620831 and the projects GAAVCR KJB300420701 and KJB300420802. Special thanks go to the Deutsche Bundesstiftung Umwelt (DBU) for a scholarship to the first author which enabled his six months stay at TU Bergakademie Freiberg. The Global Runoff Data Centre (GRDC), 56068 Koblenz, Germany, is acknowledged for the runoff data, and the German Weather Service (DWD) for the data from Saxonian rain gauge stations.
Edited by: M.-C. Llasat
Reviewed by: M. Lang and another anonymous referee
References
Engel, H.: Hochwasser in Deutschland in den Monaten Oktober und November 1998, Bundesanstalf f¨ur Gew¨asserkunde, Koblenz, 12 pp., 1998 (in German).
H. Z. B. (Hydrographisches Zentral B¨uro im Bundesministerium f¨ur Land- und Forstwirtschaft, Umwelt und Wasserwirtschaft): Das Juli-Hochwasser 1954 im ¨osterreichischen Donaugebiet, Beitrag zur Hydrographie ¨Osterreichs, Wien, Heft Nr. 29, 139 pp., 1955 (in German).
Jansa, A., Genoves, A., Picornell, M. A., Campins, J., Riosalido, R., and Carretero, O.: Western Mediterranean cyclones and heavy rain. Part 2: Statistical approach, Meteorol. Appl., 8, 43–56, 2001.
Jung, T., Klinker, E., and Uppala, S.: Reanalysis and reforecast of three major European storms of the twentieth century using the ECMWF forecasting system. Part I.: Analyses and deterministic forecasts, Meteorol. Appl., 11, 343–361, 2004.
Kaspar, M. and M¨uller, M.: Selection of historic heavy large-scaleˇ rainfall events in the Czech Republic, Nat. Hazards Earth Syst. Sci., 8, 1359–1367, 2008,
http://www.nat-hazards-earth-syst-sci.net/8/1359/2008/. Kundzewicz, Z. W., Szamalek, K., and Kowalczak, P.: The great
flood of 1997 in Poland, Hydrolog. Sci. J., 44(6), 855–870, 1999. Mart´ın, M. L., Santos-Mu˜noz, D., Morata, A., Luna, M. Y., and Valero, F.: An objectively selected case study of a heavy rain event in the Mediterranean Basin: A diagnosis using numerical simulation, Atmos. Res., 81, 187–205, 2006.
Mudelsee, M., B¨orngen, M., Tetzlaff, G., and Gr¨unewald, U.: Ex-treme floods in central Europe over the past 500 years: Role of cyclone pathway “Zugstrasse Vb”, J. Geophys. Res., 109, D23101, doi:10.1029/2004JD005034, 2004.
Porc´u, F., Caracciolo, C., and Prodi, F.: Cloud systems leading to flood events in Europe: an overview and classification, Meteorol. Appl., 10, 217–227, 2003.
ˇ
Rez´aˇcov´a, D., Kaˇspar, M., M¨uller, M., Sokol, Z., Kakos, V., Hanslian, H., and Peˇsice, P.: A comparison of flood precipita-tion in August 2002 with historical extreme precipitaprecipita-tion events from the Czech territory, Atmos. Res., 77, 354–366, 2005.
Ulbrich, U., Br¨ucher, T., Fink, A. H., Leckebusch, G. C., Kr¨uger, A., and Pinto, J. G.: The central European floods of August 2002: Part I. Rainfall periods and flood development, Weather, 58, 371– 377, 2003.
Ustrnul, Z. and Czekierda, D.: Circulation background of the at-mospheric precipitation in Central Europe (based on the Polish example), Meteorol. Z., 10, 103–111, 2001.
van Bebber, J.: Typische Witterungserscheinungen, Zeitschrift der ¨