MILLER DA SILVA LEHNER
ANALYSIS OF THE POPULATION STRUCTURE OF Sclerotinia sclerotiorum CAUSING WHITE MOLD ON COMMON BEAN IN BRAZIL
Tese apresentada à Universidade Federal de Viçosa, como parte das exigências do Programa de Pós-Graduação em Genética e Melhoramento, para obtenção do título de Doctor Scientiae.
VIÇOSA
iii AGRADECIMENTOS
Ao prof. Dr. Eduardo Seiti Gomide Mizubuti pela oportunidade, orientação e confiança. Ao Dr. Trazilbo José de Paula Júnior pela amizade, confiança, paciência e orientação desde o início da graduação no curso de agronomia.
Ao prof. José Eustáquio de Souza Carneiro pela oportunidade e confiança.
Aos meus colegas do laboratório de biologia de populações de fitopatógenos pela amizade e agradável convívio.
Ao Rhaphael Alves Silva pela dedicação em prol desse trabalho.
A Alice, minha esposa, e Cecília, minha filha, pela compreensão, amor, e carinho. Aos meus pais Osvaldo e Elzeli, por todo suporte e incentivo à minha constante formação acadêmica.
iv SUMÁRIO
RESUMO...vi
ABSTRACT...viii
General introduction...1
Literature cited...3
Chapter 1 The population of Sclerotinia sclerotiorum affecting common beans in Brazil is structured by mycelial compatibility groups that define clonal lineages within which isolates can randomly mate...4
Abstract...4
Introduction...4
Materials and Methods...7
Results...13
Discussion...16
Acknowledgements...23
Literature cited...23
Figure Legends... ..27
Supporting information...33
Chapter 2 Similar aggressiveness of phenotypically and genotypically distinct isolates of Sclerotinia sclerotiorum...34
Abstract...34
Introduction...34
Materials and Methods...37
Results...43
Discussion...45
Acknowledgements...49
Literature cited...49
Figure Legends...53
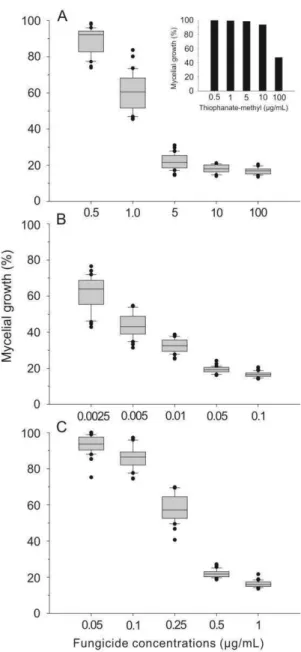
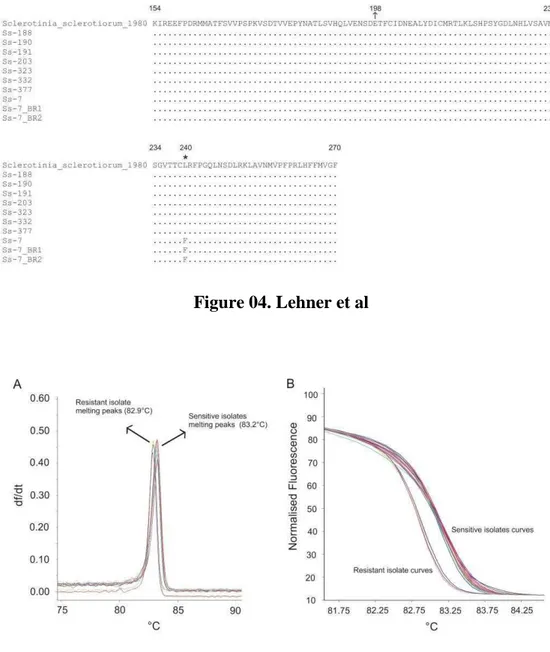
v Fungicide sensitivity of Sclerotinia sclerotiorum: A thorough assessment using discriminatory dose, EC50, high resolution melt analysis and description of new
point mutation associated with thiophanate-methyl resistance...58
Abstract...58
Introduction...59
Materials and Methods...62
Results...67
Discussion...69
Acknowledgements...73
Literature cited...73
Figure Legends...77
vi RESUMO
viii ABSTRACT
LEHNER, Miller da Silva, D.Sc., Universidade Federal de Viçosa, February, 2015. A detailed analysis of the population of Sclerotinia sclerotiorum causing white mold on common bean in Brazil. Adviser: José Eustáquio de Souza Carneiro. Co-advisers: Eduardo Seiti Gomide Mizubuti and Trazilbo José de Paula Júnior.
ix procymidone. One isolate was resistant to TM. The resistant isolate had a L240F mutation in the β-tubulin gene, which had never been reported. The fitness of
1 GENERAL INTRODUCTION
Common bean (Phaseolus vulgaris L.) is an important staple food in Brazil. After the 1980's common bean crops spread throughout Brazil, over large areas and under different systems. Many technological innovations have been incorporated into common bean crops, but the use of certified seeds of good sanitary quality is still limited. In addition, the use of inappropriate crop rotation, use of cultivars of semiprostrate or prostrate indeterminate growth habit and irrigation using center pivot during fall-winter crop season, create a favorable environment to the development of white mold epidemics, a devastating fungal disease caused by Sclerotinia sclerotiorum (Lib.) De Bary (Paula Jr. et al. 2006).
Management of white mold is difficult because S. sclerotiorum is a soilborne pathogen with a wide host range (Willetts and Wong 1980). In addition, it can survive as sclerotia for many years in the soil and employs a wide array of cell-wall-degrading enzymes and oxalic acid to colonize its hosts (Amselem et al. 2011). Genetic resistance would be the best strategy to white mold control, because it is easy to implement and is environmentally friendly. However, to date, in Brazil there is no commercial cultivar with high levels of resistance to white mold and growers heavily rely on intensive fungicide treatment to control the disease. The main compounds applied are thiophanate-methyl, fluazinam and procimidone.
3 LITERATURE CITED
Amselem, J., Cuomo, C. A., Van Kan, J. A. L., et al., 2011. Genomic Analysis of the Necrotrophic Fungal Pathogens Sclerotinia sclerotiorum and Botrytis cinerea. PLoS Genetics 7:1-27.
Antonio, R. P., Santos, J. B., Souza, T. P., Carneiro, F. F. 2008. Genetic control of the resistance of common beans to white mold using the reaction to oxalic acid. Genet. Mol. Res. 7:733-740.
Carneiro, F. F., Santos, J. B., Gonçalves, P. R. C., Antonio, R. P., Souza, T. P. 2011. Genetics of common bean resistance to white mold. Crop Breed. Appl. Biotechnol. 11: 165-173.
Carvalho, R. S. B., Lima, I. A., Alves, F. C., Santos, J. B. 2013. Selection of carioca common bean progenies resistant to white mold. Crop Breed. Appl. Biotechnol. 13:172-177.
Griffiths, P. D. 2009. Release of Cornell 601–606: common bean breeding lines with resistance to white mold. HortScience 44:463-465.
Kelly, J. D., Mkwaila, W., Varner, G. V., Cichy, K. A., Wright, E. M. 2012. Registration of „Eldorado‟ Pinto Bean. J. Plant. Regist. 6:233-237.
Lehner, M. S., Teixeira, H., Paula Júnior, T. J., Vieira, R. F., Lima, R. C., Carneiro, J. E. S. 2015. Adaptation and resistance to diseases in Brazil of putative sources of common bean resistance to white mold. Plant Dis. doi: http://dx.doi.org/10.1094/PDIS-09-14-0939-RE
McDonald, B. A. and Linde, C. 2002. Pathogen population genetics, evolutionary potential, and durable resistance. Annu. Rev. Phytopathol. 40:349-379.
Miklas, P. N., Kelly, J. D., Steadman, J. R., McCoy, S. 2014. Registration of Pinto bean germplasm line USPT-WM-12 with partial white mold resistance. J. Plant. Regist. 8:183-186.
Paula Júnior, T. J., Vieira, R. F., Lobo Júnior, M., Morandi, M. A. B., Carneiro, J. E. S., Zambolim, L. 2006. Manejo integrado do mofo-branco do Feijoeiro. Guia técnico, Viçosa-MG, 48p.
Souza, D. A., Pereira, F. A. C., Dias, J. A., Leite, M. E., Santos, J. B. 2014. Reaction of common bean progenies to white mold derived from recurrent selection. Ciência Rural 44:583-587.
4 Chapter 1
The population of Sclerotinia sclerotiorum affecting common beans in Brazil is structured by mycelial compatibility groups that define clonal lineages within
which isolates can randomly mate Abstract
A thorough analysis of the population of Sclerotinia sclerotiorum that causes white mold in common bean in Brazil was conducted using microsatellite (SSR) loci and mycelial compatibility groups (MCGs) as markers. A total of 300 isolates were studied and 154 SSR haplotypes and 32 MCGs were identified. Two MCGs were widely distributed and accounted for 70% of the isolates. Six SSR haplotypes were associated to more than one closely related MCGs. There was no evidence of random association of alleles among loci when the population comprised by all MCGs was analyzed, suggesting that outcrossing is absent or rare. Nevertheless, there was evidence of random mating within the major MCGs. Seven genetic groups were identified, one of them comprised only by highly pigmented isolates, which have an specific allele at locus 114-4. Isolates of distinct MCGs did not differ in aggressiveness. Given that 95.6% of total genetic variation was attributed to differences among MCGs; there was strong genetic differentiation among MCGs; and the ocurrence of linkage equilibrium within MCGs, the common bean population of S. sclerotiorum is structured by MCGs. Therefore, breeders and pathologists should focus on the dynamics of MCGs in order to develop resistant cultivars and set white mold control strategies.
Keywords: Phaseolus vulgaris, microsatellite markers, genetic structure, white mold. Introduction
5 and at least a dozen other important crops. The pathogen has a necrotrophic lifestyle and secrets a wide array of cell-wall-degrading enzymes and oxalic acid to colonize its hosts. S. sclerotiorum is a homothallic fungus with a single MAT locus containing both the alpha and the high mobility group domain encoding the MAT genes. This fungus can reproduce asexually by means of sclerotia or sexually by self- or cross-fertilization (Amselem et al. 2011).
6 large prevalence of clonal populations of S. sclerotiorum based on the high frequency of a few DNA-fingerprinting genotypes or MCGs (Kohli et al. 1992; Cubeta et al. 1997; Hambleton et al. 2002). However, after the introduction of microsatellite (SSR) markers to assess genetic variation in S. sclerotiorum there seems to be a change in the scenario, with many studies reporting high variability of the pathogen (Atallah et al. 2004; Sexton and Howlett, 2004; Mert-Turk et al. 2007; Hemmati et al. 2009; Gomes et al. 2011; Attanayake et al. 2013) and only a few revealing low variability (Clarkson et al. 2013; Lehner et al. 2015). In some cases, in addition to high variability, random association of alleles was found, indicating that recombination may be occurring in the populations (Atallah et al. 2004; Sexton and Howlett, 2004; Hemmati et al. 2009; Attanayake et al. 2013; Attanayake et al. 2014). If this occurs in other areas/host plants then the control of white mold epidemics will become a considerable challenge given that S. sclerotiorum has a wide host range, can survive as sclerotia in the absence of host plants, uses an aggressive colonization mode, and will now rely on a genetically variable population.
7 The studies about variability of S. sclerotiorum affecting common bean in Brazil had conflicting results. The first study that used SSR markers reported high variability among S. sclerotiorum isolates from unspecified locations in the Cerrado region (Gomes et al. 2011). Recently, a new study was conducted using SSR markers and MCGs and low variability was found in populations of S. sclerotiorum from common bean fields in Minas Gerais state (MG) (Lehner et al. 2015). In the latter, there was no evidence of outcrossing and the population was composed of five genetic groups. Nevertheless, both studies were of limited scope in terms of sampled areas. For instance, isolates from other important common bean producing states, such as Paraná, which accounts for almost 25% of the total common bean production in Brazil (CONAB 2014) were not sampled. Therefore, a nationwide study should be conducted to investigate the genetic structure of the population of S. sclerotiorum affecting common bean. Additionally, a broader sampling would allow a better estimate of the distribution of the MCGs, its composition and to evaluate if a MCG is indeed a distinct clonal lineage.
The objectives of the present study were (i) to determine the genetic structure of S. sclerotiorum affecting common bean in Brazil using SSR markers and MCGs; (ii) to elucidate the relationship within and among S. sclerotiorum MCGs; and (iii) to assess the aggressiveness of representative S. sclerotiorum isolates from the MCGs obtained in the present study. We hypothesized that the population of S. sclerotiorum from common bean in Brazil has a clonal genetic structure. We also explored the possibility of each MCG is a clonal lineage as we suggested in a previous report (Lehner et al. 2015). Materials and Methods
8 in fields located in the following states in Brazil: Santa Catarina (two fields, five isolates), Paraná (10 fields, 25 isolates), São Paulo (nine fields, 29 isolates), MG (21 fields, 121 isolates), Espírito Santo (11 fields, 25 isolates), Goiás (13 fields, 46 isolates), Bahia (two fields, 15 isolates) and Pernambuco (12 fields, 34 isolates) (Fig. 1). These states account for approximately 70% of total common bean production in Brazil (CONAB 2014). The isolates from Santa Catarina were collected in the municipalities of Curitibanos and Major Vieira; from Paraná in Araucária, Corbélia, Londrina, Mauá da Serra, Ponta Grossa, Reserva do Iguaçu, Três Barras do Paraná and Ventania; from São Paulo in Capão Bonito, Itaí, Itaporanga, Itararé and Taquarivaí, from MG in Cabeceira Grande, Paracatu, Unaí, Canaã, Coimbra, Oratórios, Porto Firme, Presidente Bernardes, Viçosa, Iraí de Minas, Patos de Minas, Ijaci, Lambari and Candeias; from Espírito Santo in Castelo, Domingos Martins, Santa Maria do Jetibá and Venda Nova do Imigrante, from Goiás in Campo Alegre de Goiás, Montividio, Rio Verde, Santo Antonio de Goiás and Silvânia, from Bahia in São Desidério; and from Pernambuco in Arcoverde, Calçado, Jucati, Jupi, Lajedo, and São João.
9 From each sclerotium hyphal-tip (isolates from MG) or single ascospore isolates were obtained and fungal mycelia was produced as described by Lehner et al. (2015). Hyphal-tip and single ascospore isolates were demonstrated to be equivalent in terms of inferences about the genetic variability of S. sclerotiorum as they result in similar SSR profile (Lehner et al. 2015; submitted ).
DNA extraction and species-specific PCR. The genomic DNA was extracted using the Wizard Genomic DNA Purification Kit (Promega, Madison, WI, USA) following the manufacturer‟s instructions. DNA integrity was analyzed in agarose gel
electrophoresis and its concentration was measured in a spectrophotometer (Nanodrop 2000 Thermo Scientific).
The primer pair SSasprF/SSasprR specific for S. sclerotiorum (Abd-Elmagid et al. 2013) was used to identify each isolate. DNA of S. sclerotiorum LMK 211 was used as a positive control and DNA of S. trifoliorum CBS 122377 was used as negative control. Additionally, 30 isolates previously identified by PCR as S. sclerotiorum were arbitrarily chosen and tested with the specific primers for S. trifoliorum (STcadF/STcadR) and S. minor (SMLcc2F/SMLcc2R). PCR reactions were performed as previously described (Lehner et al. 2015). Amplification was confirmed by using 5 µL PCR product subjected to electrophoresis in 1% agarose gel and TBE and viewed under UV light after staining with GelRed (Biotium, Hayward, CA, USA). Fragments were compared with a 100 bp DNA ladder and scored.
10 pairings. The plugs were placed 18-20 mm apart from each other resulting in four pairings per dish. The dishes were kept at 23°C in the dark. Vegetative compatibility was checked visually after 3 and 6 days of incubation. The isolates were initially tested for compatibility with other isolates collected in the same geographic region. Afterwards, at least two isolates representing MCGs identified in each region were tested against each other. Each pairing was performed twice. When the results were inconsistent, two new independent pairings were done.
Microsatellite genotyping. All isolates were genotyped using the SSR loci 7-2, 8-3, 9-2, 12-2, 13-2, 36-4, 42-4, 92-4, 106-4 and 114-4 (Sirjusingh and Kohn 2001). PCR reactions were performed with Type-it Microsatellite PCR kit as suggested by the manufacturer (Qiagen, Hilden, Germany). Primers labeled with fluorescent dye (G5 dye set: 6-FAM, NED, VIC; Applied Biosystems) were used and an the allele size was determined in an automatic sequencer ABI PRISM 3100 Genetic Analyzer (Applied Biosystem) (Lehner et al. 2015). DNA of the isolate LMK 211 was used as positive control because its SSR allele sizes had been previously determined. A sample without DNA was used as negative control. Five isolates were replicated three times with independent DNA extraction to confirm the reproducibility of the results. Data were processed with GENEMARKER v.1.191 (SoftGenetics). Each allele was determined according to its amplicon size taking into account the number of repeat units in each locus.
11 of the youngest fully expanded trifoliolate leaves of 5-week-old plants were placed in filter paper moistened with 5 mL of sterilized distilled water inside of plastic boxes (11 width x 11 length x 3 cm height). One two-day-old mycelial disc (5 mm diameter) from the first subculture of each isolate was placed between the main vein and the leaflet edges. Boxes containing inoculated leaves were kept at 23°C in the darkness. The lesion diameter was assessed 48 h after inoculation using a digital caliper. Treatments were replicated four times in a completely randomized design. The experiment was performed twice.
Microsatellite analysis Neutrality test
In order to check if the SSR markers were under selection, an outlier detection analysis was conducted using BayeScan software (Foll and Gaggiotti 2008). This method uses a Bayesian framework to determine if a locus is under selection. The analysis was performed three times to ensure robustness. In each run we used 100,000 iterations and the default settings of the program: 10 pilot runs with length of 5,000; sample size set of 5,000; and thinning interval of 10. Neutrality at each locus was rejected if the log10 (Bayes Factor) was higher than 1.5.
Genetic diversity and random mating. Each isolate was assigned to a haplotype using GENODIVE software (Meirmans and Van Tienderen 2004). The clonal fraction was calculated as 1 - [(number of different genotypes) / (total number of isolates)]. The gene diversity (Nei 1973) per locus averaged over all loci was calculated from clone-corrected data set using Genepop (Rousset 2008). Clone-corrected dataset was also used to estimate linkage disequilibrium across all SSR loci through the IA and
12 in the Poppr package (Kamvar et al. 2014) for the R program. IA and rd were calculated
with 1,000 randomizations of the dataset.
Population structure. Clustering of genetically similar individuals were sought using the discriminant analysis of principal components (DAPC) (Jombart et al. 2010). DAPC was implemented in the Adegenet package (Jombart 2008) for the R program. The number of clusters (K) was allowed to vary from one to 30 and the optimal K was determined based on the Bayesian information criterion (BIC) (Jombart et al., 2010).
The Bruvo's distance among haplotypes was calculated using the Poppr package. This distance was used to construct a network by applying an automatic thresholding algorithm based on percolation theory using the EDENetworks software (Kivela et al. 2014). This method splits the fully connected network, so that only nodes with distance smaller than the critical threshold distance, the percolation distance (Dp), remain connected. The Dp can be entered manually or is automatically calculated by the software, based on the inner properties of the network (Arnaud-Haond et al. 2014). We set the Dp according to automatic threshold function available in the software.
Haplotype variation within and among MCGs. The number of haplotypes was determined for each MCG. Nei's distance (Nei 1978) between MCGs was calculated and a hierarchical cluster analysis according to the Ward criterion was performed. Both analyses were performed using the R program. The distribution of variation of SSR haplotypes among and within of MCGs was assessed through the hierarchical analysis of molecular variance (AMOVA) calculated using Arlequin (Excoffier and Lischer 2010). The distance method was based on the sum of squared size differences between two haplotypes for SSR data and the number of permutations was 10,100. Pairwise comparisons of MCGs were performed based on Slatkin's Rst index calculated with
13 pairwise comparisons were not performed for MCGs composed of less than five isolates.
To avoid biased analysis, the clonal fraction, E5, He, IA and rd were calculated
for MCG1 and MCG2 only, because of limitations in sample size of other MCGs. Aggressiveness data analysis. Data from both experiments were pooled after performing Bartlett's test for homogeneity of variance. For each MCG we calculated the average lesion diameter and the standard deviation.
Results
Species-specific PCR identification. All isolates were identified as S. sclerotiorum based on the amplification of a 171 bp-fragment of the aspartyl protease gene. No amplification was detected when the primer pairs for S. trifoliorum or S. minor were used.
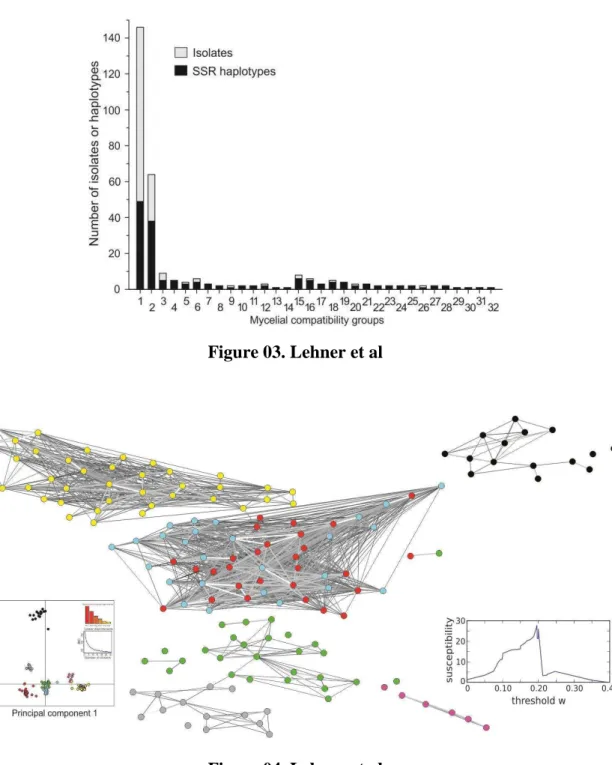
Mycelial compatibility group. A total of 32 MCGs were identified among the 300 S. sclerotiorum isolates. The number of isolates per MCG varied from one to 146. The second largest MCG was composed by 64 isolates and six MCGs were composed by a single isolate (Fig. 3). All isolates were self-compatible.
Microsatellite markers
A total of 154 haplotypes were identified among the 300 isolates analyzed. The most frequent haplotype was detected in 47 isolates and 39 haplotypes were detected in more than one isolate, resulting in an E5 value of 0.34 and a clonal fraction of 0.49
14 Neutrality and random mating. No outlier locus was detected, thus none were potentially under selection. The log10 (Bayes Factor) was lower than zero and not significant for all loci (data not shown). Considering the whole population (300 isolates), IA and rd were significantly different from zero (P < 0.01) (Table 1), thus there
was no evidence of random mating.
Population structure. The most likely number of clusters was K=7. The gray group was composed by 21 isolates, 14 haplotypes and seven MCGs. The black group was composed by 17 isolates, 15 haplotypes and 4 MCGs. The red group was composed by 115 isolates, 27 haplotypes and 7 MCGs. The yellow group was composed by 64 isolates, 38 haplotypes and one MCG (MCG2). The blue group was composed by 43 isolates, 26 haplotypes and 4 MCGs. The pink group was composed by eight isolates, six haplotypes and one MCG (MCG15). The green group was composed by 32 isolates, 27 haplotypes and 12 MCGs.
The estimated percolation threshold automatically identified by EDENetworks was Dp = 0.20. At this threshold, the red and blue groups identified by the DAPC merged into a single group (Figure 4). There was higher heterogeneity among haplotypes of the pink, gray, black and green groups, compared with the red, blue or yellow groups.
15 haplotypes, respectively. The MCGs represented by eight (MCG15) or nine (MCG3) isolates were composed by six and five haplotypes, respectively.
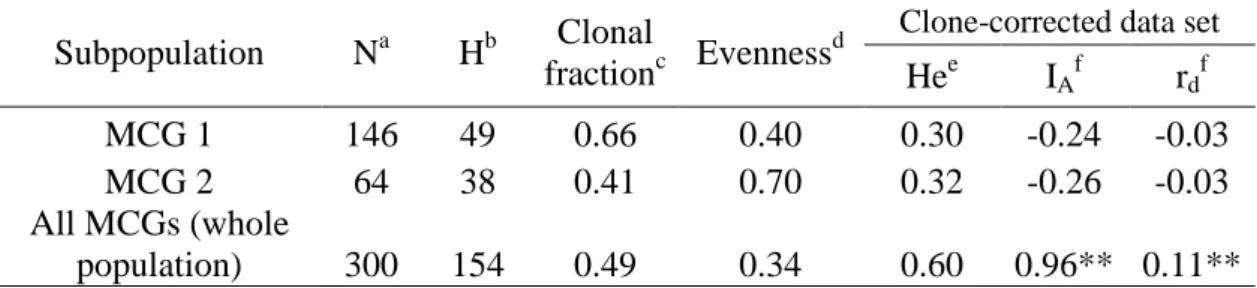
The MCG1 had higher clonal fraction, lower evenness and slightly lower gene diversity 0.66, 0.40 and 0.30, respectively, than MCG2 (Table 1). When considering the subpopulations defined by MCGs, the values of IA and rd did not differ from zero, thus
there was evidence of random mating within MCG1 or MCG2 (Table 1).
The Nei's distance between MCGs varied from 0.01 for MCGs 3 and 11 to 2.30 for MCGs 13 and 14 (Fig. 5). Four main clusters of MCGs were identified: 1) composed by MCGs of the gray genetic group; 2) composed by MCGs of the black group; 3) composed by MCGs of the green and pink groups, plus MCG27 which has isolates in the green and red groups; and 4) composed by MCGs of the red and blue groups.
Six haplotypes were associated with more than one MCG. The haplotype coded as H26 belongs to MCGs7 and 17; H35 to MCGs1 and 25; H41 to MCGs1, 20, 30 and 31; H58 and H62 to MCGs3 and 11; and H70 to MCGs1 and 25. The Nei's distance between MCGs that shared the same haplotypes was low, the maximum value was 0.06 between MCGs1 and 25 or between MCGs7 and 17 (Fig. 5).
There was strong differentiation among the eight MCGs analyzed (those with at least five isolates). The RST estimates varied from 0.65 when comparing MCG2 and
MCG15 to 0.99 when comparing MCG3 and MCG4 (Table 2). According to the AMOVA 95.6% of the total variation was attributed to genetic differences among MCGs, whereas only 4.6% was due to the variation within MCGs (Table 3).
16 Discussion
The genetic structure of the population of S. sclerotiorum causing white mold on common bean was investigated under a different perspective of other studies by emphasizing the relationship among MCGs. The population of S. sclerotiorum as a whole has a clonal genetic structure. However, when data were analyzed as subpopulations defined by MCGs we found strong evidence of subdivision and that random mating takes place within MCGs1 or 2.
When the entire population was analyzed, its genetic structure was similar to that observed for MG subpopulation (Lehner et al. 2015), with moderate gene diversity and clonal fraction, and haplotype richness (proportion of different haplotypes) of about 50-60%. Nevertheless, the evenness estimate in the present study was about two times lower than that observed in MG. This indicates the predominance of few haplotypes in the Brazilian population. Other similar findings to the previous study (Lehner et al. 2015) were: low MCG richness (proportion of different MCGs), the predominance of only two MCGs, and linkage disequilibrium among alleles at different loci. Taken together these features support a clonal genetic structure, as expected for a homothallic fungus (Milgroom 1996; Taylor et al. 1999).
Low levels of MCG diversity are expected in populations of asexual fungi (Leslie 1993). Hambleton et al. (2002) reported a clonal structure of S. sclerotiorum in Canada, where the MCG richness was 9.8%. In other studies, in which evidence of outcrossing (linkage equilibrium) was detected, the MCG richness ranged from 49% (Atallah et al. 2004) to 90% (Attanayake et al. 2013). In the present study, MCG richness was 11%, consistent with a clonal genetic structure. However, to infer about
17 (Taylor et al. 1999). Thus, conclusions should be reached after assessing a set of characteristics of the population such as, high frequency of few genotypes or linkage disequilibrium among alleles at different loci, as mentioned above.
Despite the relatively low MCG richness, the haplotype richness was moderate (51%), but consistent with clonal populations of S. sclerotiorum investigated with SSR markers (Clarkson et al. 2013; Lehner et al. 20015). The high resolution of these markers has been able to reveal variation among closely related isolates (Lehner et al. 2015). Consequently, high genotypic diversity has been reported (Atallah et al. 2004; Gomes et al. 2011; Hemmati et al. 2009; Mert-Turk et al. 2007; Sexton and Howlett 2004), even when there are no evidence of outcrossing (Clarkson et al. 2013; Lehner et al. 2015). Considering the same loci, the number of alleles observed in the Brazilian population (2 to 16) was higher than that reported in the states of Washington and North Dakota in USA (Atallah et al. 2004; Attanayake et al. 2013), in China (Attanayake et al. 2013); and in Turkey (Mert-Turk et al. 2007). Compared with the UK population (Clarkson et al. 2013), the number of alleles in Brazil was higher in loci 7-2, 8-3 and 114-4, but lower in the loci 13-2 and 92-4. Regarding the Australian population (Sexton and Howllet 2004), the number of alleles in Brazil was higher in the loci 7-2, 8-3, 9-2, 12-2 and 13-2 and equal in locus 92-4 (Supplementary table). Nevertheless, direct comparisons must be carefully conducted, since factors such as agricultural practices, host plant genotypes, climatic conditions and methodologies used to estimate the SSR alleles may differ.
18 were found compared to five in our previous paper (Lehner et al. 2015). Previously, isolates from Ijaci in the southern region of MG putatively came from an unsampled distinct subpopulation, given that they were vegetatively incompatible with other isolates and formed a distinct genetic group. In the present study a similar situation was observed for isolates of the pink group (MCG15), which was obtained from Ventania, Paraná state. In the present study isolates from Ijaci were not compatible with isolates from other states, but were assigned in the same gray group, together with one isolate from Espírito Santo state (MCG32) and two isolates from Pernambuco state (MCG28). We suspected that the isolates from the gray genetic group have a different genetic origin (founder effect) and the high distance of the MCGs of this group compared to the other MCGs/groups (Fig. 5) support this claim. Probably these isolates are related by a common parent. Nevertheless, this could not be properly addressed with SSR markers. A more accurate analysis with DNA sequences, using phylogenetic and simulations of genealogies using the coalescent approach could clarify this question.
19 114-4. Surprisingly, mycelia of these isolates are highly pigmented and form a black colony, different from all other isolates.
The location of SSR locus and/or the number of repeats may be a key factor to determine gene expression (Li et al. 2002). Melanin biosynthesis in fungi uses the polyketide pathway (PKS) (Jacobson 2000). Locus 114-4 is positioned at chromosome 4, but using genomic analysis no putative PKS genes related to melanin production was found in this chromosome. However, it is possible that hypothetical proteins encoded by genes of unknown functions located in chromosome 4 are related to melanin production. It is also possible that locus 114-4 is located in a promoter region, which could affect the gene transcription (Li et al. 2002). In a previous study in which highly pigmented isolates were identified the allele of 336 bp at locus 114-4 was not found (Attanayake et al. 2013). Therefore, more research needs to be undertaken to investigate the possible association between mycelial pigmentation and SSR loci.
20 isolates really do not differ in aggressiveness or due to high susceptibility to white mold of cultivar Pérola used in the aggressiveness assay. It seems that isolates of S. sclerotiorum exhibits variation in aggressiveness only when inoculated on common bean cultivars partially resistant to white mold (Lehner et al. unpublished data).
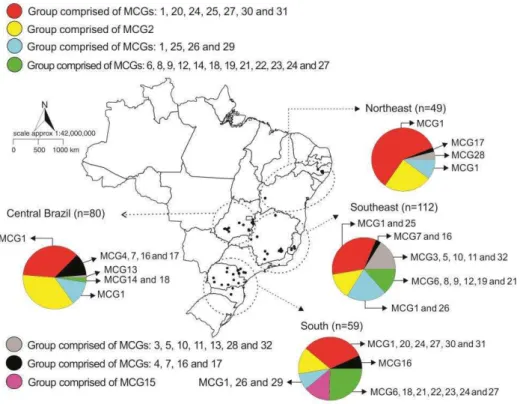
In the present study a large MCG was found, composed by 146 isolates and widely distributed across the sampled areas (Fig. 1). This MCG is likely to be older than the others, since the there was no difference in terms of aggressiveness, a surrogate used to estimate fitness. It is interesting to note that there is a North to South gradient in terms of MCG diversity. The higher the latitude, the higher the MCG diversity (Fig. 1). In the northeastern region, fewer fields were sampled, which may have contributed to smaller number of MCGs. Nevertheless, the MCG diversity seems to follow the gradient of common bean production in Brazil. The two largest common bean producer states, Paraná and MG, are located in the southern and southeastern regions, respectively. In the northeast, common bean areas expanded recently, especially in western Bahia state, but this area is much smaller than Paraná and Minas Gerais. In addition, for most part of the northeast environmental conditions are not favorable to white mold epidemics. In the central region, common bean competes with other crops, mainly soybean and maize, and fewer common bean crops are planted each year compared to southern and southeastern regions. Finally, MCG diversity is higher in areas where common beans are more intensively cultivated because of higher seed trade, which facilitates the introduction of new pathogen genotypes and possibly MCGs.
21 within MCGs. Based on these results, it seems that recombination does not occur between isolates belonging to distinct lineages/branches (in our case, MCGs), but frequent recombination occurs between isolates within each lineage. This pattern was suggested to be associated with bacterial populations (Maynard Simith et al. 1993, Figure 1B). Almost all studies try to identify populations of S. sclerotiorum separated by geographic region or by the host plant. In most cases these populations are usually comprised of different MCGs and tests to infer recombination are commonly carried out. However, recombination between two S. sclerotiorum isolates from distinct MCGs is likely to be a rare event. The dikaryotic phase that precedes apothecial initiation in S. sclerotiorum occurs by the duplication of nuclei directly from the vegetative hyphae (Willetts and Wong 1980). Heterokaryotic mycelia can occur through hyphal anastomosis, but just in isolates belonging to the same MCG (Leslie 1993). Thus, it does not seem appropriate to assess linkage equilibrium in populations comprised by distinct MCGs.
22 In the late 1990's using DNA fingerprinting Kohli and Kohn (1998) reported random association of alleles in populations of S. sclerotiorum from Canada or USA. After the introduction of SSR markers to assess genetic variation in S. sclerotiorum this result became more frequent (Atallah et al. 2004; Sexton and Howlett, 2004; Hemmati et al. 2009; Attanayake et al. 2013; Attanayake et al. 2014). However, the high mutation rate in the SSR loci could have been confused with recombination. Recently it was demonstrated that the random association of alleles is more likely be due to recombination than mutation, because the linkage disequilibrium decreases with increasing in the distances between the SSR loci (Attanayake et al. 2014). In most studies, including the present one, linkage disequilibrium or non-random association of alleles at SSR loci was detected. Linkage disequilibrium may occur due to physical linkage of genes (Milgroom 1996). After locating each SSR locus in the available
sequence of S. sclerotiorum genome
(http://www.broadinstitute.org/annotation/genome/sclerotinia_sclerotiorum), the 7-2 and 114-4 loci are at chromosome 4 and the 13-2 and 36-4 loci at chromosome 6. The other loci are at distinct chromosomes. The linkage disequilibrium analysis was repeated after removing loci 7-2 and 13-2, and there was no effect on the significance of the results. Thus, the linkage disequilibrium most likely is not due to physical linkage of SSR loci.
23 bottlenecks in an area are unlikely given the capacity of the fungus to survive as sclerotia for many years in the soil.
Other possible cause of linkage of disequilibrium is when the analyzed samples consist of a mixture of several subpopulations. The subpopulations may be geographically or ecologically isolated, or there may be biological barriers to gene exchange (Maynard-Simith et al. 1993). The fact that linkage disequilibrium is detected in the entire population supports the existence of genetically distinct subpopulations characterized by MCGs. In addition to the results of the linkage disequilibrium tests, the RST pairwise comparisons among MCGs and the AMOVA support the hypothesis of
MCGs acting as subpopulations. There was strong pairwise differentiation (RST> 0.25)
of MCGs and the genetic differences among them accounted for almost all genetic variation (95.6%). Each MCG is postulated to be a clonal lineage, as suggested in a previous report (Lehner et al. 2015). They indicate that the population of S. sclerotiorum from common bean fields in Brazil is not a single, panmitic population. Instead, it is formed by several MCGs that may have distinct evolutionary trajectories. Acknowledgements
This research was supported by FAPEMIG and CNPq. The authors thank Dr. Antonio Félix da Costa, Dr. Hélcio Costa and Airton Luiz Pazinato for sampling of S. sclerotiorum isolates in Pernambuco, Espírito Santo and São Paulo State, respectively. The authors thank Dr. Linda Kohn for sending DNA of S. sclerotiorum isolate LMK211.
Literature cited
24 Agapow, P. M. and Burt, A. 2001. Indices of multilocus linkage disequilibrium. Mol. Ecol. Notes 1:101–2.
Amselem, J., Cuomo, C. A., Van Kan, J. A. L., et al., 2011. Genomic analysis of the necrotrophic fungal pathogens Sclerotinia sclerotiorum and Botrytis cinerea. PLoS Genetics 7:1-27.
Arnaud-Haond, S., Moalic, Y., Barnabé, C., Ayala, F. J., Tibayrenc, M. 2014. Discriminating micropathogen lineages and their reticulate evolution through graph theory-based network analysis: the case of Trypanosoma cruzi, the agent of Chagas disease. Plos One 9: e103213. doi:10.1371/journal.pone.0103213.
Atallah, Z. K., Larget, B., Chen, X., and Johnson, D. A. 2004. High genetic diversity, phenotypic uniformity, and evidence of outcrossing in Sclerotinia sclerotiorum in the Columbia basin of Washington State. Phytopathology 94:737-742.
Attanayake, R. N., Carter, P. A., Jiang, D., del Río-Mendoza, L., Chen, W. 2013 Sclerotinia sclerotiorum populations infecting canola from China and the United States are genetically and phenotypically distinct. Phytopathology 103:750-761.
Attanayake, R. N., Tennekoon, V., Johnson, D. A., Porter, L. D., del Río-Mendoza, L., Jiang, D., Chen, W. 2014. Inferring outcrossing in the homothallic fungus Sclerotinia sclerotiorum using linkage disequilibrium decay. Heredity 113:353–363.
Clarkson, J. P., Coventry, E., Kitchen, J., Carter, H. E., Whipps, J. M. 2013. Population structure of Sclerotinia sclerotiorum in crop and wild hosts in the UK. Plant Pathol. 62:309-324.
CONAB, 2014. Acompanhamento de Safra Brasileira de Grãos. CONAB survey, January 2015. Brasília, Brazil: Companhia Nacional de Abastecimento.
Cubeta, M. A., Cody, B. R., Kohli, Y., Kohn, L. M. 1997. Clonality in Sclerotinia sclerotiorum on infected cabbage in Eastern North Carolina. Phytopathology 87:1000-1004.
Excoffier, L., Lischer, H. E. 2010. Arlequin suite ver 3.5: a new series of programs to perform population genetics analyses under Linux and Windows. Mol. Ecol. Resour. 10:564-567.
Foll, M. and Gaggiotti, O. 2008. A genome-scan method to identify selected loci appropriate for both dominant and codominant markers: a bayesian perspective. Genetics 180: 977-993.
Gomes, E. V., Nascimento, L. B., Freitas, M. A., Nasser, L. C. B., Petrofeza, S. 2011. Microsatellite markers reveal genetic variation within Sclerotinia sclerotiorum populations in irrigated dry bean crops in Brazil. J. Phytopathol. 159:94-99.
Hambleton, S., Walke,r C., Kohn, L. M. 2002. Clonal lineages of Sclerotinia sclerotiorum previously known from other crops predominate in 1999–2000 samples from Ontario and Quebec soybean. Can. J. Plant Pathol. 24:309-315.
Hemmati, R., Javan-Nikkhah, M., Linde, C. C. 2009. Population genetic structure of Sclerotinia sclerotiorum on canola in Iran. Eur. J. Plant Pathol. 125:617-628.
Jacobson, E. S. 2000. Pathogenic roles for fungal melanins. Clin. Microbiol. Rev. 13:708-717.
25 Jombart, T., Devillard, S., Balloux, F. 2010. Discriminant analysis of principal components: a new method for the analysis of genetically structured populations. BMC Genetics 11:94. doi:10.1186/1471-2156-11-94
Kamvar, Z. N., Tabima, J. F., Grunwald, N. J. 2014. POPPR: an R package for genetic analysis of populations with clonal, partially clonal, and/or sexual reproduction. PeerJ 2, e281.
Kivela, M., Arnaud-Haond, S. and Saramaki, J. 2014. EDENetworks: A user-friendly software to build and analyse networks in biogeography, ecology and population genetics. Mol. Ecol. Resour. doi: 10.1111/1755-0998.12290.
Kohli, Y., Morrall, R. A. A., Anderson, J. B., Kohn, L. M. 1992. Local and trans-Canadian clonal distribution of Sclerotinia sclerotiorum on canola. Phytopathology 82: 875–80.
Kull, L. S., Pederson, W. L., Palmquist, D., Hartman, G. L. 2004. Mycelial compatibility groupings and virulence of Sclerotinia sclerotiorum. Plant Dis. 88:325-332.
Lehner, M. S., Paula Júnior, T. J., Hora Júnior, B. T., Teixeira, H., Vieira, R. F., Carneiro, J. E. S., Mizubuti, E. S. G. 2015. Low genetic variability in Sclerotinia sclerotiorum populations from common bean fields in MG State, Brazil, are clonal at regional, local and micro scales. DOI: 10.1111/ppa.12322
Lehner, M. S., Paula Júnior, T. J., Mizubuti, E. S. G. 2015. Does hyphal-tip ensure the same allelic composition as monosporic isolates of Sclerotinia sclerotiorum? J. Phytopathol. submitted.
Leslie, J. F. 1993. Fungal vegetative compatibility. Annu. Rev. Phytopathol. 31:127-150.
Li, Y. C., Korol, A. B., Fahina, T., Beiles, A., Nevo, E. 2002. Microsatellites: genomic distribution, putative functions and mutational mechanisms: a review. Mol. Ecol. 11:2453-2465.
Malvárez, G., Carbone, I., Grunwald, N. J., Subbarao, K. V., Schafer, M., Kohn, L. M. 2007. New Populations of Sclerotinia sclerotiorum from lettuce in California and peas and lentils in Washington. Phytopathology 97:470-483.
Maynard-Smith, J., Smith, N. H., O'Rourke, M., Spratt, B. G. 1993. How clonal are bacteria? Proc. Natl. Acad. Sci. USA 90:4384-4388.
McDonald, B. A., Linde, C. 2002. Pathogen population genetics, evolutionary potential, and durable resistance. Annu. Rev. Phytopathol. 40:349-379.
Meirmans, P. G., van Tienderen, P. H. 2004. GENOTYPE and GENODIVE: Two programs for the analysis of genetic diversity of asexual organisms. Mol. Ecol. Notes 4:792-794.
Mert-Turk, F., Ipek, M., Mermer, D., Nicholson, P. 2007. Microsatellite and morphological markers reveal genetic variation within a population of Sclerotinia sclerotiorum from oilseed rape in the Çanakkale Province of Turkey. J. Phytopathol. 155:182-187.
26 Nei, M. 1973. Analysis of gene diversity in subdivided populations. Proc. Natl. Acad. Sci. USA 70: 3321–3.
Nei, M. 1978. Estimation of average heterozygosity and genetic distance from a number of individuals. Genetics 89:538–90.
Remesal, E., Jordan-Ramírez, R., Jimenez-Díaz, R. M., Navas-Cortes, J. A. 2012. Mycelial compatibility groups and pathogenic diversity in Sclerotium rolfsii populations from sugar beet crops in Mediterranean-type climate regions. Plant Pathol. 61:739–753. Rousset, F. 2008. GENEPOP‟007: a complete re-implementation of the GENEPOP software for Windows and Linux. Mol. Ecol. Resour. 8:103-106.
Schafer, M. R. and Kohn, L.M. 2006. An optimized method for mycelial compatibility testing in Sclerotinia sclerotiorum. Mycologia 98:593-7.
Sexton, A. C., and Howlett, B. J. 2004. Microssatelite markers reveal genetic differentiation among populations of Sclerotinia sclerotiorum from Australian canola fields. Curr. Genet. 46:357-365.
Sirjusingh, C. and Kohn, L. M. 2001. Characterization of microssatelites in the fungal plant pathogen, Sclerotinia sclerotiorum. Mol. Ecol. Notes 1:267-269.
Taylor, J. M., Jacobson, D. J. and Fisher, M. C. 1999. The evolution of asexual fungi: reproduction, speciation and classification. Annu. Rev. Phytopathol. 37:197-246.
Willetts, H. J., Wong, J. A. 1980. The biology of Sclerotinia sclerotiorum, S. trifoliorum, and S. minor with emphasis on specific nomenclature. Bot. Rev. 46:101– 165.
27 Figure legends
Figure 01. Sampled areas (black dots) and distribution of the seven genetic groups and
the 32 mycelial compatibility groups (MCGs) detected among isolates of Sclerotinia sclerotiorum from common bean-producing regions in Brazil. The different colors refer to the genetic groups identified by discriminant analysis of principal components (DAPC). Dotted circles delimit geographically defined regions in which the analysis (pie charts) was conducted. The pie-charts represent the distribution of the genetic groups and MCGs in each geographic region.
Figure 02. Aggressiveness and number of SSR haplotypes evaluated per MCG of Sclerotinia sclerotiorum from common bean fields Brazil. Mean ± standard deviation. Figure 03. Frequency of isolates and SSR haplotypes in each of the 32 mycelial compatibility groups of Sclerotinia sclerotiorum sampled from common bean fields in Brazil.
Figure 04. Network of Sclerotinia sclerotiorum SSR haplotypes based on Bruvo's genetic distance. Only links with genetic distance smaller than the percolation threshold (Dp = 0.20) are represented. A gradient of dark gray to light gray represents decreasing distances among haplotypes. The scatterplot of the discriminant analysis of principal components (DAPC) for the 300 isolates is shown in the lower left corner.
28 Figure 01. Lehner et al
29 Figure 03. Lehner et al
31 Table 01. Basic descriptors of genetic variation in the subpopulations of Sclerotinia sclerotiorum defined based on mycelial compatibility groups (MCG). All isolates were obtained from common bean fields in Brazil.
Subpopulation Na Hb Clonal
fractionc Evenness
d Clone-corrected data set
Hee IAf rdf
MCG 1 146 49 0.66 0.40 0.30 -0.24 -0.03
MCG 2 64 38 0.41 0.70 0.32 -0.26 -0.03
All MCGs (whole
population) 300 154 0.49 0.34 0.60 0.96** 0.11** a
Sample size
b
Number of haplotypes c
Clonal fraction calculated as 1 - [(number of different genotypes) / (total number of isolates)].
d
Evenness (Grunwald et al. 2003)
e
Gene diversity (Nei 1973), averaged over all loci
f
Measures of multilocus linkage disequilibrium **Significant at P < 0.001
Table 02. Genetic differentiation (RST ) among mycelial compatibility groups of isolates
of Sclerotinia sclerotiorum collected from common bean fields in Brazil.
Population MCG1 MCG2 MCG3 MCG4 MCG6 MCG15 MCG16 MCG1
MCG2 0.96
MCG3 0.93 0.97
MCG4 0.98 0.97 0.99
MCG6 0.96 0.92 0.97 0.90
MCG15 0.96 0.65 0.96 0.92 0.81
MCG16 0.97 0.97 0.95 0.93 0.93 0.94
MCG18 0.94 0.97 0.79 0.98 0.96 0.94 0.93
RSTcalculated using Arlequin (Excoffier and Lischer 2010). Number of permutations =
32 Table 03. Analysis of molecular variance (AMOVA) for eight mycelial compatibility groups of isolates of Sclerotinia sclerotiorum from common bean fields in Brazila.
Source of
variation df
Sum of
squares Variation (%)
Fixation
index P-value
Among MCGs 7 22776.9 95.6
Within MCGs 241 1714.1 4.4 RST = 0.95 < 0.0001
Total 248
a
Distance method based on the sum of squared size differences (RST) between two
33 Supporting information
Supplementary table 01. Number of alleles found in the Brazilian population of
Sclerotinia sclerotiorum from common beans compared to those found in other studies, size range and gene diversity for each microsatellite locus.
Locus Repetitive sequence
Number
of alleles Size range (bp)
Gene diversitya
Number of alleles (previous reports) 7-2 (GA)14 8 156-172 0.66 14b,3c, 4d, 2e, 3f,6g
8-3 (CA)12 10 240-268 0.72 9b,7d,7g
9-2 (CA)9(CT)9 7 354-368 0.24 8b,5g
12-2 (CA)9 6 211-221 0.76 9b,2c, 1e, 3f,5g,3h
13-2 (GTGGT)6 9 275-320 0.47 18b,2c,17d,2e,5f,7g
36-4 (CA)6(CGCA)2(CAT)2 3 410-414 0.22 9b,1g
42-4 (GA)9 2 405-407 0.08 6b
92-4 (CT)12 4 371-377 0.55 8b,2c, 6d,4g
106-4 (CATA)25 13 496-584 0.66 9b,3c, 6h
114-4 (AGAT)14(AAGC)4 16 336-428 0.56 12b,4c, 15d,2e,6f,9h a
Gene diversity (Nei 1973) among individuals within populations, averaged over populations.
b
Brazil, Gomes et al. (2011) c
USA (Washington), Atallah et al. (2004) d
UK, Clarkson et al. (2013) e
China, Attanayake et al. (2013)
f
USA (North Dakota), Attanayake et al. (2013)
g
Australia, Sexton and Howllet (2004)
h
34 Chapter 2
Similar aggressiveness of phenotypically and genotypically distinct isolates of Sclerotinia sclerotiorum
Abstract
Understanding how Sclerotinia sclerotiorum aggressiveness varies among isolates may be useful for breeding programs aimed at developing common bean cultivars resistant to white mold. We used two inoculation methods and two common bean genotypes (Pérola and A195) to assess the aggressiveness of 20 S. sclerotiorum isolates collected in common bean fields from four Brazilian States. The isolates were genotyped with 10 microsatellite (SSR) loci, had their mycelial compatibility groups (MCGs) and partial sequences of the oxaloacetate acetylhydrolase (OAH) gene determined and were characterized for morphological traits. Twenty SSR and seven OAH haplotypes, 10 MCGs and high variability in colony morphology were found. Except for Ss-217, isolates showed similar aggressiveness. Ss-217 was more aggressive when inoculated on plants of the genotype A195. Aggressiveness was not correlated with MCGs, SSR or OAH haplotypes, mycelial pigmentation, growth rate or sclerotia production.
Keywords: Sclerotinia stem rot, white mold, straw test Introduction
35 especially genetic resistance, to control white mold, given that the use of resistant common bean cultivars is a promising option (Schwartz and Singh 2013).
The current breeding strategy for minimizing damage caused by white mold on common bean is based on the combination of physiological and avoidance resistance. Physiological resistance is conferred by plant defense mechanisms and avoidance resistance, by plant architecture-related traits (Miklas et al. 2013). Under field conditions, both types of resistance contribute to white mold control, whereas in the greenhouse or laboratory only physiological resistance can be identified (Vuong et al. 2004).
Finding new sources of resistance to white mold requires reliable disease evaluation techniques and proper understanding of pathogenic variability of S. sclerotiorum (Kull et al. 2003). Thus, common bean germplasm should be screened against appropriate S. sclerotiorum isolates, preferably genetically distinct and collected in regions where cultivars will be released (Schwartz and Singh 2013). The inoculation method can also interfere in the response of common bean genotypes to white mold (Kull et al. 2003). Two tests are often used to assess physiological resistance to white mold in common bean: inoculation of detached leaflets (Steadman et al. 1997) and the straw test (Petzoldt and Dickson 1996). Detached leaflets is a repeatable method that allows many common bean genotypes to be tested in a short space and time (Kull et al. 2003). In the straw test, the fungus is inoculated on the stem of plants and the severity assessment is done using a 1-9 scale or measuring the lesion length. Currently, the straw test is the most widely used method for detection of physiological resistance to white mold (Schwartz and Singh 2013).
36 Usually, pathogen variation has not been considered in these studies, because little is known about the variability of S. sclerotiorum aggressiveness in the common bean-producing areas. Recently, studies were conducted to assess the genetic variability of S. sclerotiorum isolates from common bean fields in Brazil (Lehner et al. 2014; Lehner et al. 2015). Using microsatellite markers and mycelial compatibility groups (MCGs), low genetic variability was found (Lehner et al. 2015), but apparently there is high variability in morphological traits, such as mycelial pigmentation, growth rate and sclerotia production (Lehner et al. 2014). Nonetheless, variation in aggressiveness was not assessed in these studies.
Variation in aggressiveness is often assessed by measuring variables associated with the disease signs and symptoms. Studies designed to address aggressiveness of S. sclerotiorum have been done with the most economically important hosts of the pathogen: soybean (Kull et al. 2004), potato (Atallah et al. 2004), canola (Sexton and Howlett 2004; Attanayake et al. 2013), sunflower (Ekins et al. 2007; Irani et al. 2011) and common bean (Pascual et al. 2010; Otto-Hanson et al. 2011). In one study with common bean, Otto-Hanson et al. (2011) tested 156 isolates, 138 from the USA and 18 from France. In another paper, four isolates from Spain were assessed for differences in aggressiveness (Pascual et al., 2010). No studies were conducted to evaluate variation in aggressiveness among isolates of S. sclerotiorum from common bean fields in Brazil, the largest world producer of this legume. In addition, few studies have addressed the relationship between aggressiveness and molecular or morphological markers.
37 S. sclerotiorum from distinct geographic populations differ in aggressiveness? Are molecular or morphological markers related to pathogen aggressiveness? We addressed these questions using 20 isolates of S. sclerotiorum, two inoculation methods and two common bean genotypes. For the 20 isolates, phenotypic traits, two neutral markers (MCGs and SSR markers) and partial sequences of the oxaloacetate acetylhydrolase (OAH) gene, which is a pathogenicity determinant for S. sclerotiorum (Andrew et al. 2012), were evaluated for potential association with aggressiveness.
Materials and Methods
38 was sprayed every day on the sand to keep the high humidity needed for carpogenic germination. From one mature apothecium of each sclerotium, one ascospore was arbitrary selected and transferred to PDA as previously described (Atallah et al. 2004). Sclerotia produced by colonies of the hyphal tip or single ascospore isolates were dried and stored at 4ºC.
All isolates were confirmed to be S. sclerotiorum as previously described (Lehner et al. 2015) using the specific primer pair SSasprF/SSasprR (Abd-Elmagid et al. 2013). To extract DNA, isolates were grown in liquid medium (10 g sucrose, 2 g l-asparagin, 2 g yeast extract, 1 g KH2PO4, 0.1 g MgSO4.7H2O, 0.44 mg ZnSO4.7H2O,
0.48 mg FeCl3.6H2O, and 0.36 mg MnCl2.H2O) in Erlenmeyer flasks at 23°C for 7 days.
The mycelium was washed with distilled water, transferred to filter paper to dry, and macerated in a mortar with liquid nitrogen. DNA was extracted using the Wizard Genomic DNA Purification Kit (Promega, Madison, WI, USA) following the manufacturer‟s instructions. DNA integrity was analyzed in agarose gel electrophoresis,
and its concentration was measured in a spectrophotometer (Nanodrop 2000 Thermo Scientific, Wilmington, DE, USA).
39 combinations. Compatible isolates were distinguished by the absence of reaction line produced in the interaction zone between two isolates (Schafer and Kohn 2006).
Microsatellite genotyping. The isolates were genotyped as previously described (Lehner et al. 2015) using the microsatellite loci 7-2, 8-3, 9-2, 12-2, 13-2, 36-4, 42-4,
92-4, 106-4 and 114-4 (Sirjusingh and Kohn 2001). DNA of isolate LMK 211 was used as positive control since its microsatellite allele sizes had been previously determined. A sample without DNA was used as negative control. Both positive and negative controls
were included in each run. A group of isolates was replicated three times with independent DNA extraction to confirm the reproducibility of the results. Data were processed with the GeneMarker Software V1.191 (Sounits Genetics). Each allele was determined according to the amplicon size of each isolate, taking into account the number of repeat units in each locus.
Analysis of DNA sequence of the oxaloacetate acetylhydrolase gene
PCR was performed in a final volume of 25 µL with 1 µL of DNA (25 ηg/µL), 1 µL of DMSO, 2.5 µL of bovine serum albumin at 50 mg/mL, 1 µL of each primer at 10 µM, 6 µL of water and 12.5 µL of Dream Taq PCR Master Mix (2X) that includes dATP, dCTP, dGTP and dTTP (0.4 mM each) and 4 mM of MgCl2 (Thermo Fisher Scientific). DNA fragments were amplified using the primer pair OAHaF (5′
-CGAGTTGCCCTTCAAGTT - 3′) and OAHbR-deg (5′- CCACCAGCCGYAGTAT - 3′) which flank a region of approximately 900 bp of the OAH gene (Andrew et al.
40 Cleveland, OH) and sequenced by Macrogen Services (Kumchun-ku, Seoul, Korea) using OAHaF and OAHbR-deg primers. The nucleotide sequences were edited using DNA BASER sequence assembly software (Heracle BioSoft) and aligned using MEGA 5.0 (Tamura et al. 2011). In the alignment, we included the sequence of the S. sclerotiorum 1980 isolate, which had its genome recently sequenced (Amselem et al. 2011).
Aggressiveness assessment using the straw test. The straw test method (Petzoldt and Dickson 1996) was used according to Terán and Singh (2009). The cultivar Pérola and the line A195 were used in all tests. Pérola (“carioca” grain class, cream-striped) is widely used in Brazil and is susceptible to white mold (Vieira et al. 2010). The line A195 (beige colored grain with a distinctive yellow hilar ring) has partial white mold resistance (Singh et al. 2007). Experiments with each common bean genotype were carried out separately.
Plants were grown in 3 L-pots filled with the commercial substrate Tropstrato HT Hortaliças (Vida Verde, Mogi-Mirim, SP, Brazil). This substrate has pH 5.8 and is prepared with pine bark, processed peat, and vermiculite. Ten days after seedling emergence, 3 g of urea was distributed on the surface of every pot. A randomized design with four replicates was used. A pot with three plants (= experimental unit) was considered as a replicate.
41 Aggressiveness assessments using the detached leaflet test. The two common bean genotypes used for the straw test were also used here. Leaflets of the youngest fully expanded trifoliate leaves of 5-week-old plants were placed on filter paper moistened with 5 mL of sterilized distilled water inside plastic boxes (11 width x 11 length x 3 cm height - gerbox). Two two-day-old mycelial discs (5 mm diameter) from the first subculture of each isolate were placed between the main vein and the leaflet edges; one disc on each side of the main vein. Boxes containing inoculated leaves were kept at 23°C in the dark. The lesion diameter was assessed 48 h after inoculation using a digital caliper. Treatments were replicated four times in a completely randomized design. The experiments were performed twice.
Mycelial growth rate and sclerotia production at three temperatures. Mycelial plugs (5 mm-diameter) from a two-day-old culture were placed in the center of Petri dishes (6 cm-diameter) containing 10 mL of PDA with 100 mg/L of chloramphenicol. The dishes were kept at 18°C, 23°C, and 28°C. Colony diameter was assessed at 24 and 29 h of incubation, and the average growth rate (mm/h) was estimated as: [(colony diameter measured with 29 h - colony diameter with 24 h)/5]. The number of sclerotia produced in each Petri dish was counted after 15 days of incubation. A completely randomized design with three replicates was used. Each replicate was considered as one colony in a plate. The experiment was performed twice.
Mycelial pigmentation. Assessment of colony pigmentation was conducted in colonies formed in the Petri dishes containing the mycelial plugs used in the previous experiment. Each colony was visually observed after 15 days of incubation and classified as non-pigmented, pigmented and highly pigmented as previously described (Lehner et al. 2014).
42 Microsatellite analyses. Each isolate was assigned to a haplotype using GENODIVE (Meirmans and Van Tienderen 2004). The GeneClass2 program (Piry et al. 2004) was used to calculate Nei's gene diversity (Nei 1987) among the isolates. To assess the genetic relationships among the haplotypes, we used the Alerquin software (Excoffier and Lischer 2010) to construct a minimum spanning network.
Aggressiveness assessment by the straw and detached leaflet tests. Data were analyzed for homogeneity of variance using Bartlett‟s test. Data from two experiments
were pooled for statistical analysis when variances were homogeneous; experiments were analyzed separately when variances were not homogeneous. Analysis of variance (ANOVA) was performed using the R program. The overall mean and the standard deviation of the assessed variables were estimated for each cultivar. An isolate was considered less or more aggressive when the average of a given variable was either lower or greater, respectively, than the value of the standard deviation.
Mycelial growth rate and sclerotia production at three temperatures. The growing conditions for each of the three temperatures were considered as three independent experiments. Data were analyzed for homogeneity of variance using Bartlett‟s test. Additionally, the multivariate structure of the data was explored using a
canonical discriminant analysis (CDA). Both analyses were performed in R.
43 Results
Genetic diversity based on mycelial compatibility groups, microsatellite markers and DNA sequences. Ten MCGs were found among the 20 S. sclerotiorum isolates (Table 1). Each isolate was a distinct SSR haplotype (Table 1; Fig. 1). The number of alleles at each locus varied from one, at locus 36-4, to seven, at locus 7-2 and 106-4 (Table 1). The mean gene diversity across all loci was 0.58.
The partial DNA sequence of AOH gene had 846 base pairs. The sequences of the Brazilian isolates shared 99.99–100% sequence similarity to S. sclerotiorum 1980 isolate (data not shown). Seven haplotypes were identified based on DNA sequence data. The isolates Ss-188, Ss-196 and Ss-79 were single haplotypes. The most frequent haplotype was detected in the isolates 2, 8, 19, 23, 141, 173 and Ss-203. Other haplotypes were comprised by the isolates Ss-44, Ss-51, Ss56, Ss-138 and Ss-193; isolates Ss-166, Ss-165, Ss-70 and 1980; and isolates Ss-136 and Ss-217.
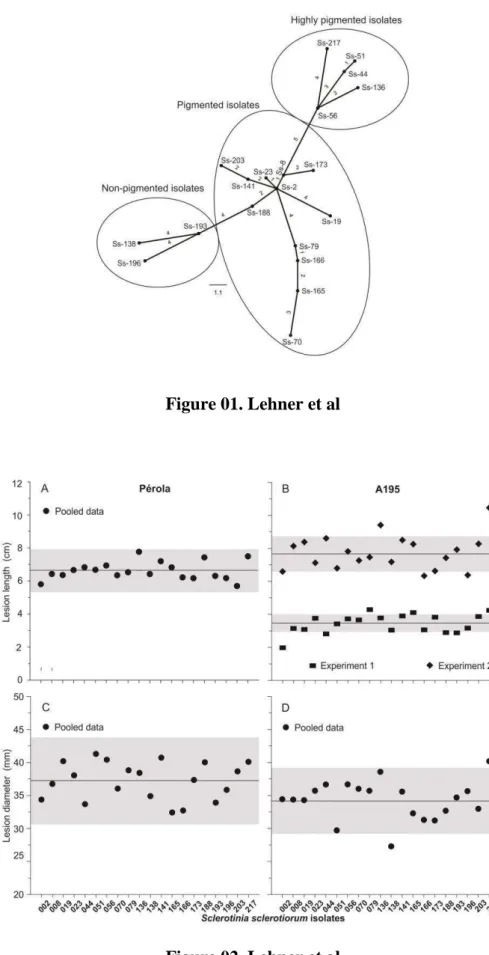
Aggressiveness assessment using the straw and detached leaflet tests. The error variances for both experiments with cultivar Pérola for both straw and detached leaflet tests were similar, and the hypothesis of homoscedasticity could not be rejected. The effect of isolates on lesion length (straw test) was not significant (F = 1.58, P = 0.07), but aggressiveness varied among isolates for the lesion diameter in the detached leaflet test (F = 1.71, P = 0.04).
44 In the straw test, the lesion length ranged from 5.7 (Ss-203) to 7.8 cm (Ss-136) for cv. Pérola (Figure 2A). For line A195, lesion length varied from 1.9 (Ss-2) to 4.3 cm (Ss-79) in the first experiment, and from 6.3 (Ss-166) to 10.4 cm (Ss-217) in the second experiment (Fig. 2B). In the detached leaflet test, the lesion diameter varied from 32.4 (isolate Ss-165) to 41.3 mm (Ss-51) for cv. Pérola (Fig. 2C), and from 27.3 (Ss-138) to 40.2 mm (Ss-217) for A195 (Fig. 2D). There was no difference regarding isolate aggressiveness for cv. Pérola (Fig 2A and 2B), whereas for A195 the isolate Ss-217 was more aggressive than the other isolates (Fig. 2B and 2D). Isolate Ss-136 had the second largest average values of lesion diameter and length (Experiment 2) when inoculated on plants of A195 (Fig. 2B and 2D). However, the value of lesion diameter did not differ from the overall mean.
Mycelial growth rate and sclerotia production at three temperatures. Variances between experiments were homogeneous. Incubation at 18°C (F = 5.20, P < 0.001), 23°C (F = 9.23, P < 0.001) or 28°C (F = 4.71, P < 0.001) affected the mycelial growth rate of the isolates. The average mycelial growth rate at 18°C ranged from 1.50 ± 0.43 (isolate Ss-138) to 2.20 ± 0.31 mm/h (Ss-203) (supplementary table). At 23°C growth rates varied from 1.77 ± 0.40 mm/h (Ss-79) to 2.65 ± 0.15 (Ss-203). The mycelial growth rate of isolates at 28°C was on average two times lower than that at 23°C. At 28oC, the mycelial growth rate ranged from 0.64 ± 0.12 (Ss-173) to 1.48 ± 0.08 mm/h (Ss-79).
45 The first two canonical variables captured 73.4% of the total variation of the morphological traits. Despite the high variability in mycelial growth rate and sclerotia production, CDA did not indicate distinct groups of isolates (Fig. 3).
Colony color. Isolates exhibited differences in mycelial pigmentation. The colonies of isolates classified as non-pigmented were white in color, the pigmented were brown and the highly pigmented were black colonies. Isolates Ss-138, Ss-193, and Ss-196 were non-pigmented. Isolates Ss-44, Ss-51, Ss-56, Ss-136, and Ss-217 were highly pigmented, whereas the other isolates were classified as pigmented (Fig.1).
Correlations. Correlations between aggressiveness and either genetic distance (based on SSR data) (r = -0.03, P = 0.40) or phenotypic distance (based on mycelial growth rate and sclerotia production) (r = 0.17, P = 0.10) were low and not significant. Discussion
46 and Dow 1973), so the latent period is of limited utility to determine genotype resistance, since extensive necrosis has already occurred.
The detached leaflet and the straw test are effective methods to assess the aggressiveness of S. sclerotiorum isolates (Kull et al. 2003). The results of the present study corroborate these findings, since we observed that the aggressiveness of isolates did not change with the inoculation method. On the other hand, aggressiveness was affected by common bean cultivar. When the cv. Pérola was used, aggressiveness of the isolates was similar, regardless of the inoculation method. Using A195, however, the most aggressive isolate was Ss-217. Thus, A195 seems to be more suited to use in aggressiveness tests than cv. Pérola. One possible explanation for the lack of variation in aggressiveness when using cv. Pérola is that this cultivar is more susceptible to white mold than is A195. Pérola probably has fewer resistance genes, given that A195 is considered partially resistant to white mold (Singh et al. 2007). Aggressiveness of S. sclerotiorum has been a subject of many studies in different crops. Uniformity (Atallah et al. 2004; Sexton and Howlett 2004) as well as aggressiveness variation among isolates (Kull et al. 2004; Ekins et al. 2007; Otto-Hanson et al. 2011; Attanayake et al. 2013) have been reported. Thus, direct comparisons of experimental results must be done carefully, since isolate variability, inoculation method, host species and environmental conditions of the experiments may affect the results. Cultivar resistance also affects the results and this was clearly demonstrated in the present study, where the higher aggressiveness of the isolate Ss-217 was demonstrated to be dependent on common bean genotype.