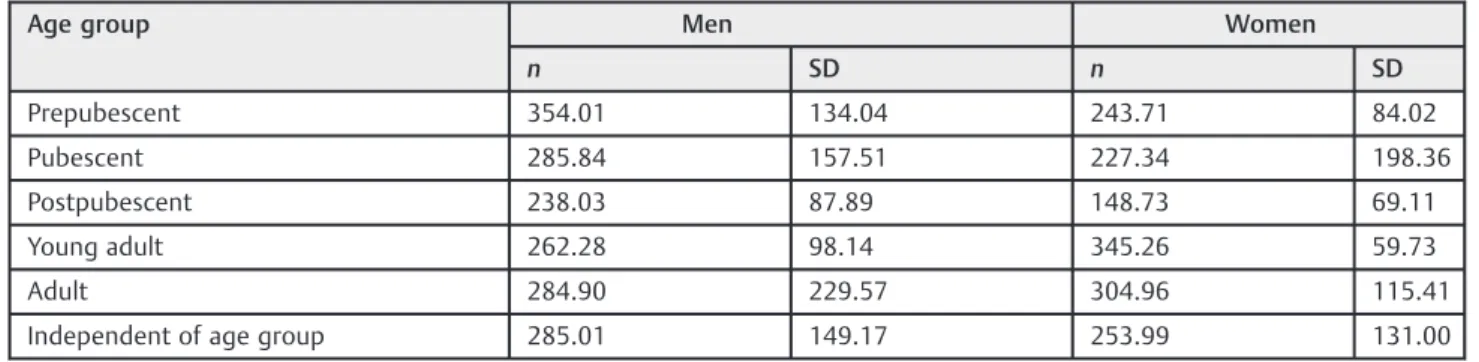
Maximum Bite Force Analysis in Different Age Groups.
Texto
Imagem


Documentos relacionados
The population studied (control and patients) consisted of males of similar age, height and body mass index (BMI); spirometric data were also similar in the four groups. We
Current anthropometric measurements (body weight, height, and BMI), duration of breastfeeding, and casual BP and ABPM readings were excluded from this analysis,.. Figure 1 -
Intraclass correlation coeicient between measured and self-reported weight, height and body mass index measurements, according to sex, age group, schooling, income and time since
he following measures and anthropometric indicators were evaluated: weight, height, body mass index (BMI), triceps skinfold (TSF), waist circumference, arm circumference, calf
In the present study, a mean maximum bite force in the female groups ranges from 108.9 to 834.6 N (mean of 424.2), and a mean maximum bite force in the male groups ranges from 262.8
Objective: To analyze the performance of three different diagnostic criteria of overweight and obesity (WHO, IOTF and Conde and Monteiro) using body mass index (BMI) as predictors
The collections of anthropometric variables (height, body mass and subsequent calculation of body mass index [BMI]) occurred before the start of training, the muscle
Abstract This study aimed to investigate the relationship between anthropometric indicators - body mass index (BMI), waist circumference (WC), and waist-to-height ratio (WHtR)
