A Refined Hybrid Image Retrieval System using Text and Color
Nidhi Goel1, and Priti Sehgal2
1
Ph.D. Research Scholar, University of Delhi, New Delhi, India
2
Associate Professor, Department of Computer Science, Keshav Mahavidyalaya, University of Delhi, Pitampura , New Delhi - 110034, India.
Abstract
Image retrieval (IR) continues to be most exciting and fastest growing research areas due to significant progress in data storage and image acquisition techniques. Broadly, Image Retrieval can be Text based or Content based. Text-based Image Retrieval (TBIR) is proficient in „named-entity‟ queries (e.g. searching images of „TajMahal‟. Content Based Image Retrieval (CBIR) shows its proficiency in querying by visual content. Both the techniques having their own advantages and disadvantages and still have not been very successful in uncovering the hidden meanings/semantics of the image. In this paper, we propose a hybrid approach that improves the quality of image retrieval and overcomes the limitations of individual approaches. For text retrieval, matching term frequency-inverse document frequency (tf-idf) weightings and cosine similarity are used, whereas for content matching the search space is narrowed down using color moments and then the two results obtained are combined to show better results than the individual approaches. Further refinement using color histogram technique improves the performance of the system significantly.
Keywords: CBIR, TBIR, Color moments, Color Histogram
1. Introduction and Related Work
An image retrieval system is a computer system for browsing, searching and retrieving images from a large database of digital images [1, 5]. Progress in various domains like video, biometrics, medical applications, surveillance, GIS, remote sensing, journalism etc. resulted in the creation of large image datasets due to advancement in data storage and acquisition techniques [4]. As processing has now become increasingly powerful and memory has become cheaper, the deployment of large image datasets for various applications has relatively become easier and efficient also. In this scenario, it is necessary to develop an appropriate retrieval system to effectively and efficiently manage such a large collection of image datasets. From past two decades Image retrieval has evolved from text based retrieval (1980s) to content based retrieval (1990s) to Fuzzy Image retrieval (2004) [2]. In TBIR systems, the images are retrieved from the database based upon the text annotations (or metadata) associated with the images [6]. Apache Lucene is amongst
performs well compared to other descriptors when images have mostly uniform color distribution. In most of the images categories color moments also show better performance [24]. A CBIR system for Iris matching uses color texture and shape as feature descriptor [15]. Another system Sketch4Match uses color as the feature descriptor for matching of a sketch with the corresponding image [16]. CBIR gives better result where application contains more of visual content rather than semantic content. For e.g.:- CBIR is suitable for queries in medical diagnosis involving comparison of an X-ray picture with previous cases. But suppose, a query demands retrieval images of
“cancerous tissues/cells”, or “A man holding shooting camera” are such examples where text outweighs visual content [17] and it is not clear what kind of image should be used. Now here CBIR fails because of the fact that visual features cannot fully represent the semantic concepts.
As discussed above, we can conclude that both TBIR and CBIR have their own characteristics, advantages and disadvantages. Low level visual features of an image represents the more detailed perceptual aspects while text addresses the high level semantics underlying the more general conceptual aspects of an image. Efforts have been made by the researchers to combine these two approaches to provide us with satisfactory results [18]. In 1999 an important research work is done focusing on Content based retrieval inspired from text retrieval [19]. Abbas et.al. [20] suggests that combination of both text and content could better the performance of search systems benefitting both the approaches. It is based upon the idea if ability to examine the image content does not exist, then search depends upon metadata like captions/keywords.it says that TBIR is as fast as CBIR. An effort has been made to combine content and semantics in Medical domain also [21]. The paper proposes a scheme to combine CBIR and semantics using grid computing The MedImGrid used in the proposed CSBIR extracts semantic context information and use it as clue to improve efficiency. The shape, color and texture features of every medical image for thorax CR based CSBIR is extracted and Euclidean distance metric is used for the similarity matching of visual content of the image. A recent study says content and context is required to bridge the gap rather than content vs. context [11]. This paper gives four reasons to support this and present approaches that appropriately combine content with context to bridge the semantic gap. They suggested a new direction based upon philosophy, cognitive science and modern search engines that can be easier to bridge the semantic gap. C. Hartvedt [17] discusses how combining existing techniques may help improve the understanding of user intentions in IR. Underlying hypothesis is that such an approach will make it easier for an IR system to
understand the user‟s intention behind a search. But yet
finding the correlation between low level features and high level concepts to bridge the gap between visual features and semantic content has been a major challenge in this research field. In this paper, an approach is proposed to combine these two features. We also show that combined approach produces better results than individual approaches. The proposed system further filters the results obtained based on visual content before displaying the final results which substantially decreases the number of non-relevant images retrieved.
The rest of the paper is organized as such that section 2 discusses the architecture of the proposed system in detail, section 3 evaluates and compares the performance of combined with individual systems and section 4 concludes this paper.
2. Proposed Algorithm
The proposed IR system uses both the visual content and text (metadata) associated with the image. The system has user interface where user can enter the query in the form of text and/or a query image. The text and image feature descriptor vectors are generated for query text and image as well as the images in Database. The similarity matching algorithm is executed on the descriptors vectors and the two independent lists of score vectors are generated for the query text and query image with different scores. Now these two listsare combined in a significant way to give user the combined score list of images. The default weight given to both the methods is 0.5(50%).The relevant set of images are retrieved based upon the threshold value set. They are arranged in decreasing order of their relevance. Results obtained are filtered again using color histogram to remove unwanted images. Fig. 1 shows the flowchart for the proposed system.
2.1 Pre-processing the text descriptions
Query Image and/or Database Image Extract Metadata from xml files of all the database images Text Feature vector Image Feature Vector Text matching using cosine similarity Image color matching using distance between color moments Resultant Text Vector Resultant Image Vector Combine vectors Display images Filter results using Color histogram Final Refined Result Tokeniza tion and stopword removal Stemming using Porter’s Algorithm Assign weights using tf-idf weighting’s Extract Color feature Calculate color moments
Fig. 1 Flowchart for the proposed system
2.2 Indexing the text descriptions
An inverted index is built with an entry for each token in the vocabulary obtained in previous step. The data structure used for the purpose is hash tables. An inverted
index is used for the fast access of the data [23]. Now after creating inverted index weights are assigned to the index terms/tokens. The term frequency-inverse document frequency (tf-idf) weight of a term is the product of its term frequency (tf) weight and its inverse document frequency (idf) weight.The tf(t,d) of term t in document d is defined as the number of times term „t‟ occurs in
document „d‟ and idf is a measure of whether the term is
common or rare across all documents. The weights assigned to the tokens is calculated using Eq.(1).
(1) where:
N represents the total number of documents. tf t,d is the term-frequency
dft is the document frequency of term „t‟ i.e. the number of documents that contain „t‟.
2.3 Text retrieval and ranking
The inverted index created in the Section 2.2 is used to find the limited set of documents that contain at least one of the query words. The documents and the query are represented as vectors. The Key idea behind this representation is we can easily rank documents according to their proximity (similarity of vectors) to the query in the vector space. We have used angles rather than distance for similarity between vectors because the Euclidean distance between the two documents can be quite large for vectors of different lengths. But the angle between two most similar documents is 0. Hence the cosine similarity scores are calculated between a query and each document using the Eq. (2) [24]
(2) Where:
qi is the tf-idf weight of term i in the query
di is the tf-idf weight of term i in the document
cos(q,d) is the cosine similarity of q and d or, equivalently, the cosine of the angle between q and d. The documents are ranked in decreasing order of similarity scores since cosine is monotonically decreasing function. Value of 1 represents the perfect match and 0 means the worst match.
2.3 Image feature Extraction and Feature Vector
Creation
One of the most important features a human uses is color. Color is a property that depends on the reflection of light to the eye and the processing of that information in the
)
df
/
(
log
)
tf
1
log(
w
, 10,d td
N
tt V i i V i i V
i i i
brain [25]. Usually colors are defined in three dimensional color spaces. These could either be RGB (Red, Green, and Blue), HSV (Hue, Saturation, and Value) or HSB (Hue, Saturation, and Brightness). RGB is the simpler color space in terms of computation but it not used because the values changes with illumination change in the image. The last two are dependent on the human perception of hue, saturation, and brightness. The color space model used in the proposed system is HSV since it is illumination and camera- direction invariant. Moreover it is more intuitive way of describing colors [3].
Color moments have proven [26] to be a successful technique for indexing images based on color. Their correctness outweighs [27] classic color indexing techniques such as cumulative color indexing. The three color moments namely the first order (mean), the second (variance) and the third order (skewness) values are calculated for each of these channels (Hue, Saturation, and Value).
The three color moments can then be defined as: 1st Moment – Mean:
(3) 2nd Moment – Standard Deviation:
(4)
3
rdMoment
–
Skewness:
(5)
Where :
pij = value of ith color channel for jth pixel of image
n – Number of pixels in the image Ei– mean of image for ith color channel
σi– standard deviation of image for ith color channel Si– skewness of image for ith color channel
i – color channel index from 1-3 (i.e. 1 = H, 2 = S, 3 = V) Hence the feature vector for the image contains 9 values in the form of 3X3 matrix of the following format:-
Where:
E11 E12 E13 represents Mean value for HSV components σ11σ12σ13 represents Standard deviation value for HSV S11 S12 S13 represents Skewness value for HSV
The feature vector is created for the query image as well as for the database images.
2.4 Image similarity matching and ranking
In this proposed technique, the image matching distance between the query image (Q) and the database image (I) is defined as the sum of the weighted differences between the moments vectors of the two images.
Formally this is:
(6)
Where:
Q, I: are the two image distributions being compared j: is the current channel index (i.e. 1 = H, 2 = S, 3 = V) EjQ and EjI: are the first moments of the two images σjQand σjI: are the second moments of the two images SjQ and SjI: are the third moments of the two images
wj : are the weights for each moment (described below)
wj values are user specified weights. Depending on the
application, and the datasets used these values can be tuned so that different preferences are given to different features of an image. Since the database we are using is a general purpose database of colored images, We use the following weight matrix to weight hue slightly higher than saturation and value. The reason is Hue is a term which describes a dimension of color we readily experience when we look at color.
The distance “d” between the query image and the
database image is calculated using the above metrics. If we
compare the two “d” values
d(query ,db1) < d(query ,db2)
We say that 'db1' is more similar to the 'query Image' than 'db2's is to the 'query Image', based on color moments. The values obtained are in the range of 0 and 1. The value 0 represents the perfect match whereas 1 represents the worst match. The images are ranked in decreasing order of their relevance.
2.5 Combined Score
After calculating the individual similarity score for text and color we need to combine the similarity scores for text matching and image matching to provide a final similarity score for matching a query with a document/image. We cannot simply add the weights of each image in the two
n
j ij
i
p
n
E
1
1
n
j
i ij
i
p
E
n
12
)
(
1
3 1
3
)
(
1
nj
i ij
i
p
E
n
S
jI jQ j jI jQ j j
jI jQ
j E E w w S S
w I Q
d 2 3
3
lists to get the combined weight. The problem in combining the two weight list is that two totally use different weighting schemes as shown below.
For Image:
0 (perfect) 1(worst)
For Text:
1 (perfect) 0(worst)
So the solution is to reverse the weights of the one of the list, so that the weighting schemes are in match with each other. Moreover 50% weightage is given to both the schemes. The similarities are combined using Eq. (7) Combined Score = 0.5*(image score) + 0.5*(1 – text score)
(7)
2.6 Filter Results
Conventional color histogram (CCH) is the approach more frequently adopted for CBIR systems [28]. The interesting aspect of the CCH is its simplicity and ease of calculation [29]. A color histogram describes the frequency of colors
in images. It won‟t change with the variations of pictures‟
geometry, so it is a widely used feature for image indexing although it has some shortcomings [3].
The distance metric used for matching the CCH of images is quadratic form distance (QFD). QFD can lead to perceptually more desirable results than Euclidean distance and histogram intersection method as it considers the cross similarity between colors. Suppose if a histogram
has „n‟ number of bins, then it requires „n x n‟ calculations
for cross similarity matching. So the complexity is O(n2).Hence the method becomes computationally very expensive.
So to narrow down the search results color moments were used as 1st pass due to their compactness and ease of calculations but may result in some unwanted results. A larger set of images are obtained from filtering based on color moments. Then CCH and QFD metric is used to filter out results from the set obtained. This is will reduce the computational complexity, give visually better similar results and also removes unwanted results
[29].
The CCH is calculated for the set of results obtained in the previous step and for the query image. QFD is used to find out the distance between the CCH of the query and the database images. The formula for QFD is given by Eq. (8):(8) Where:
A = [aij] is a similarity matrix, and aij denotes the
similarity between bin i and j.
HQ = histogram bins of the Query Image Q
HI = Histogram bins of the database Image I
Using the QFD metric the similarity distance is calculated and again a refined set of results are shown to the user.
3. Experimental Results
The proposed algorithm is tested by using WikipediaMM Image Collection. This collection contains of 151,519 images that cover diverse topics of interest. Each image is associated with user-generated alphanumeric, unstructured metadata in English. These metadata usually contain a brief caption or description of the image, the Wikipedia user who uploaded the image, and the copyright information. These descriptions are highly heterogeneous and of varying length. For the Experimental purpose we have used 150 images and their metadata. All the images are in RGB color space and jpeg/png format. Metadata is available in the form of XML files. Matlab 7.0 and Vb.net is used for developing the proposed system.
Out of 150 images there are 35 “map” images , 35 “coin”
images,35 ”car” and more. We have conducted test for 2
categories “map” and “car”. The performance is measured
using two retrieval statistics precision and recall. The values are calculated using Eq. (9) and Eq. (10) for three type of queries text-based, image-based and combined.
(9)
(10)
Table 1 shows the performance of “map” category. From
the statistics in Table 1 we can observe that for text-based query 42 images are retrieved whereas database has only 35 relevant images corresponding to the query. This implies that text-based retrieval may lead to garbage collection. Thus combining it with content- based retrieval will help removing those garbage results. The experimental results show that combined technique performs better than the individuals and is helpful in retrieving more meaningful results thus reducing the semantic gap. The experimental results are shown using the graph in Fig.2 which clearly shows that statistics are better for combined approach.
) (
* * )
( Q I
T I Q
QI H H A H H
D
Table 1: Precision and Recall values of “map” category
Fig. 2 Bar Graph showing Precision and Recall values for “map”.
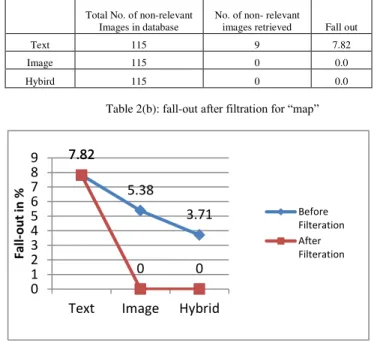
The second aspect of the proposed system is to improve the performance by removing unwanted images and display relevant results. Table 2 shows that fall-out before and after filtration. Fall-out is the probability that a non-relevant document is retrieved by the query. It is given by Eq. (11)
(11) Table 2(a) shows the fall-out before the filtration process. Table 2(b) shows the improvement in the fall-out for CBIR and combined technique after filtering using color histogram. The experimental results are shown using the graph in Fig.3 which clearly shows that performance improves.
Total No. of non-relevant Images in database
No. of non- relevant
images retrieved Fall out
Text 115 9 7.82
Image 115 7 5.38
Hybrid 115 3 3.71
Table 2(a): Fall-out before filtration for “map”
Table 2(b): fall-out after filtration for “map”
Fig. 3 Graph showing Fall-out Values for “map”
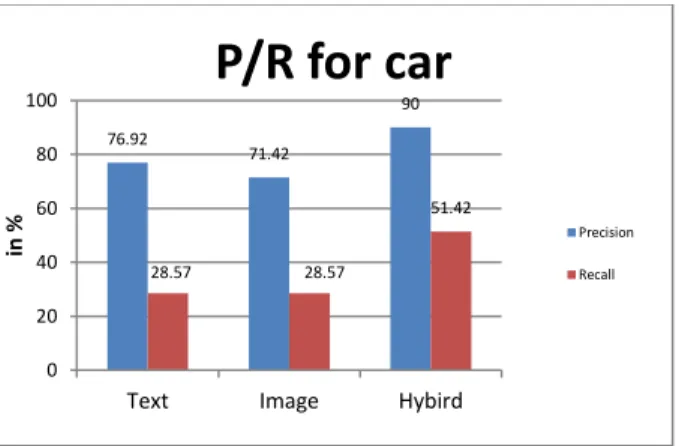
Similarly the performance of the proposed system is measured by testing for another category of images “car”. Table 3 shows the precision and recall values for
text-query “car” and image of a car. From the Table 3 we can
observe that for text-based retrieval 13 images are retrieved however database contains 35 such images. This implies that text-retrieval may result in loss of some relevant images which are not annotated properly. So combining two approaches helps in retrieving relevant images. The experimental results are shown using the graph in Fig.4 which clearly shows that statistics are better for combined approach.
Table 3: Precision and Recall values for “car” category.
78.57 78.8
92.1 94.28
74.28
100
0 20 40 60 80 100 120
Text Image Combined
in
%
P/R for map
Precision Recall
7.82
5.38
3.71 7.82
0 0
0 1 2 3 4 5 6 7 8 9
Text Image Hybrid
F
all
-o
u
t
in
%
Before Filteration After Filteration
No. of Relevant images in DB
No. of images Retrieved
No. of relevant
images
retrieved Precision Recall
Text 35 42 33 78.57 94.28
Image 35 33 26 78.8 74.28
Hybird 35 38 35 92.1 100
Total No. of non-relevant Images in database
No. of non- relevant
images retrieved Fall out
Text 115 9 7.82
Image 115 0 0.0
Hybird 115 0 0.0
No. of Relevant images in DB
No. of images Retrieved
No. of relevant
images
retrieved Precision Recall
Text 35 13 10 76.92 28.57
Image 35 14 10 71.42 28.57
Hybrid 35 20 18 90.0 51.42
Fig. 4 Bar Graph showing Precision and Recall values for “car”.
Table 4(a) shows the fall-out of query image “car” before the filtration process. Table 4(b) shows that the fall-out is much less after filtration. The experimental results are shown using the graph in Fig.5 which clearly shows that performance improves.
Table 4(a): Fall-out before filtration for “car”
Table 4(b): Fall-out after filtration for “car”
Fig. 5 Graph showing Fall-out Values for “car”
Fig. 6(a) shows the results obtained without filtering corresponding to the query image provided by the user.
Now after filtering process, the results displayed are much more visually similar to the query image as shown in Fig. 6(b).
Fig. 6(a): Results showing Images before filtration
Fig. 6(b) Results showing Images after filtration.
4. Conclusions
In the proposed system tf-idf weighting are used for feature vector generation for text and cosine similarity is used for text-matching. The feature vectors for images are extracted in terms of three moments: 1st moment (mean), 2nd moment (variance), 3rd moment (skewness).The color space model used is HSV for feature vector extraction. The performance is evaluated in terms of precision, recall and fall-out values. The statistics calculated shows that the performance of combined approach is better than that of text-based or image-based. The system again filters the results so obtained using CCH feature and Quadratic form distance to show visually better results. The screenshots and the fall-out value obtained shows that the performance of the system is improved with decrease in the computational complexity.
76.92
71.42
90
28.57 28.57
51.42
0 20 40 60 80 100
Text Image Hybird
in %
P/R for car
Precision
Recall
2.6
3.47
1.73 2.6
0.86
0 0
1 2 3 4
Text Image Hybrid
F
a
ll
-out
in
%
Before Filteration After Filteration
Total No. of non-relevant Images in
database
No. of non- relevant
images retrieved Fall out
Text 115 3 2.60
Image 115 4 3.47
Hybrid 115 2 1.73
Total No. of non-relevant Images in
database
No. of non- relevant
images retrieved Fall out
Text 115 3 2.60
Image 115 1 0.86
References
[1] A.W.M. Smeulders, M. Worring, S. Santini, A. Gupta, and R. Jain, “Content-Based Image Retrieval at the End of the Early Years”, IEEE Transactions On Pattern Analysis And Machine Intelligence, Vol. 22, 2000 , pp. 1349-1380 . [2] N. Singhai, and Prof. S.K. Shandilya, “A Survey On: Content
Based Image Retrieval Systems”, International Journal of Computer Applications, Vol. 4 – No.2, July 2010, pp. 22-26. [3] F. Long , H.J Zhang, and Feng D., "Fundamentals of
content-based image retrieval" in Multimedia Information Retrieval and Management- Technological Fundamentals and Applications, Springer, 2003.
[4] V. N. Gudivada , and V. V. Raghavan, “Content-Based Image Retrieval systems”, IEEE Computers, vol. 28, no. 9, 1995, pp. 18-22.
[5] R. Datta, D. Joshi, J. Li, and J. Z. Wang, “ Image Retrieval: Ideas, Influences, and Trends of the New Age – Addendum”, ACM Computing Surveys, vol. 40, no. 2, article 5, 2008, pp. 1-60.
[6] H. Zhang, M. Jiang, and X. Zhang, “Exploring image context for semantic understanding and retrieval”, in International Conference on Computational Intelligence and Software Engineering, 2009, pp. 1 – 4.
[7] A. Jakarta, “ Apache Lucene - a high-performance, full-featured text search engine library”, http://lucene.apache.org/. [8] N. S. Chang and K. S. Fu, “A Relational Database System for
Images”, Technical Report TR-EE 79-28, Purdue University, May 1979.
[9] N. S. Chang and K. S. Fu, “Query-by pictorial-example”, IEEE Trans. on Software Engineering SE-6(6), 1980, pp. 519-524.
[10] T. Joseph, A.F. Cardenas, "PICQUERY: A High Level Query Language for Pictorial Database Management," IEEE Transactions on Software Engineering, vol. 14, no. 5, 1988, pp. 630-638.
[11] R. Jain, and P. Sinha, “Content without context is meaningless”, Proceedings of
the international conference on Multimedia ,ACM , 2010, pp. 1259-1268 .
[12] Y. Alemu, J. Koh, M. Ikram, D. Kim. “Image Retrieval in Multimedia Databases: A Survey”, in Fifth International Conference on Intelligent Information Hiding and Multimedia Signal Processing, 2009, pp. 681 - 689
[13] T. Pavlidis, “Limitations of cbir”, in ICPR, 2008
[14] J. Xu, B. Xu, S. Men, “Feature-based Similarity Retrieval in Content-based Image Retrieval”, in Web Information Systems and Applications Conference ,IEEE, 2010, pp. 215 – 219.
[15] R.S. Choras, “Image Feature Extraction Techniques and Their Applications for CBIR and Biometrics Systems”, International Journal Of Biology And Biomedical Engineering, 2007 pp. 6 – 16.
[16] B.Szanto, P. Pozsegovics, Z.Vamossy, Sz.Sergyan, “Sketch4Match – Content Based Image Retrieval System Using Sketches”, in 9th IEEE International Symposium on Applied Machine Intelligence and Informatics, IEEE January 2011, pp. 183-188.
[17] C. Hartvedt, “Using context to understand user intentions in Image retrieval”, in second IEEE International conferences on advances in multimedia, 2010, pp. 130-133.
[18] N. Zhang and Y. Song, “An Image Indexing and Searching System Based Both on Keyword and Content,” in Proceedings of the 4th International Conference on Intelligent Computing (ICIC2008), ser. LNCS 5226. Springer-Verlag Berlin Heidelberg, Sep. 2008, pp. 1059– 1066.
[19] D. McG. Squire , W. Müller , H. Müller , and J. Raki, “Content-Based Query of Image Databases, Inspirations From Text Retrieval: Inverted Files, Frequency-Based Weights and Relevance Feedback”, PATTERN RECOGNITION LETTERS, 1999.
[20] J. Abbas, S. Qadri, M. Idrees3, S. Awan2, and N. A. Khan, “Frame Work For Content Based Image Retrieval (Textual Based) System”, Journal of American Science, Vol. 6(9), 2010, pp. 704 – 707.
[21] H. Jin, A. Sun, R. Zheng, R. He, Q. Zhang, Y. Shi, and W. Yang. “Content and Semantic Context Based Image Retrieval for Medical Image Grid”, in Proceedings of the 8th IEEE/ACM International Conference on Grid Computing, 2007, pp. 105-112
[22] C.J. van Rijsbergen, S.E. Robertson and M.F. Porter, “New models in probabilistic information retrieval”, Report, no. 5587, British Library, London, 1980.
[23] R. Stata, K. Bharat, F. Maghoul, “The Term Vector Database: fast access to indexing terms for Web pages”, Computer Networks, Volume 33, Issues 1–6, June 2000, pp. 247-255.
[24] G. Salton, A. Wong, C. S. Yang, “A vector space model for automatic indexing‟, Communications of the ACM, v.18 n.11, Nov. 1975, pp.613-620.
[25] S. Wang, “A Robust CBIR Approach Using Local Color Histograms,” Tech. Rep. TR 01-13, Department of Computer Science, University of Alberta, Edmonton, Alberta, Canada, 2001.
[26] S. R Kodituwakku, and S. Selvarajah, “Comparison of Color Features for Image Retrieval”, Indian Journal of Computer Science and Engineering, Vol. 1 No. 3, 2010 , pp.207-211. [27] M. Stricker and M. Orengo. “Similarity of color images”,
SPIE Conference on Storage and Retrieval for Image and Video Databases III, vol. 2420, Feb. 1995, pp. 381-392. [28] Zur Erlangung des Doktorgradesder Fakult, Angewandte
Wissenschaften, Dissertation, “Feature Histograms for Content-Based Image Retrieval, 2002.
[29] C. Patil, V. Dalal, “Content Based Image Retrieval Using Combined Features”, in Proceedings of the International Conference & Workshop on Emerging Trends in Technology, ACM, 2011, pp. 102-105 .
First Author Nidhi Goel graduated in Physics from University of
Delhi in 2006, received MCA degree from GGS Indraprastha University, Delhi in 2009 and is currently pursuing Ph.D. in Computer Science from the Department of Computer Science, University of Delhi .She was lecturer in Delhi Institute of Advanced studies, GGS Indraprastha University.
Second Author Dr. Priti Sehgalreceived her Ph.D. in Computer