www.atmos-chem-phys.net/17/2459/2017/ doi:10.5194/acp-17-2459-2017
© Author(s) 2017. CC Attribution 3.0 License.
Influence of rain on the abundance of bioaerosols
in fine and coarse particles
Chathurika M. Rathnayake1, Nervana Metwali2, Thilina Jayarathne1, Josh Kettler1, Yuefan Huang1, Peter S. Thorne2,3, Patrick T. O’Shaughnessy2,3, and Elizabeth A. Stone1
1Department of Chemistry, University of Iowa, Iowa City, IA 52242, USA
2Department of Occupational and Environmental Health, University of Iowa, Iowa City, IA 52242, USA 3Department of Civil and Environmental Engineering, University of Iowa, Iowa City, IA 52242, USA
Correspondence to:Elizabeth A. Stone ([email protected]) Received: 14 July 2016 – Discussion started: 30 August 2016
Revised: 14 January 2017 – Accepted: 16 January 2017 – Published: 16 February 2017
Abstract. Assessing the environmental, health, and climate impacts of bioaerosols requires knowledge of their size and abundance. These two properties were assessed through daily measurements of chemical tracers for pollens (sucrose, fruc-tose, and glucose), fungal spores (mannitol and glucans), and Gram-negative bacterial endotoxins in two particulate matter (PM) size modes: fine particles (< 2.5 µm) and coarse parti-cles (2.5–10 µm) as determined by their aerodynamic diam-eter. Measurements were made during the spring tree pollen season (mid-April to early May) and late summer ragweed season (late August to early September) in the Midwest-ern US in 2013. Under dry conditions, pollen, and fungal spore tracers were primarily in coarse PM (>75 %), as ex-pected for particles greater than 2.5 µm. Rainfall on 2 May corresponded to maximum atmospheric pollen tracer levels and a redistribution of pollen tracers to the fine PM frac-tion (>80 %). Both changes were attributed to the osmotic rupture of pollen grains that led to the suspension of fine-sized pollen fragments. Fungal spore tracers peaked in con-centration following spring rain events and decreased in par-ticle size, but to a lesser extent than pollens. A short, heavy thunderstorm in late summer corresponded to an increase in endotoxin and glucose levels, with a simultaneous shift to smaller particle sizes. Simultaneous increase in bioaerosol levels and decrease in their size have significant implica-tions for population exposures to bioaerosols, particularly during rain events. Chemical mass balance (CMB) source apportionment modeling and regionally specific pollen pro-files were used to apportion PM mass to pollens and fungal spores. Springtime pollen contributions to the mass of
par-ticles < 10 µm (PM10)ranged from 0.04 to 0.8 µg m−3(0.2– 38 %, averaging 4 %), with maxima occurring on rainy days. Fungal spore contributions to PM10mass ranged from 0.1 to 1.5 µg m−3(0.8–17 %, averaging 5 %), with maxima occur-ring after rain. Overall, this study defines changes to the fine-and coarse-mode distribution of PM, pollens, fungal spores, and endotoxins in response to rain in the Midwestern United States and advances the ability to apportion PM mass to pol-lens.
1 Introduction
2014). These respiratory illnesses are predicted to increase in response to global trends of increasing carbon dioxide con-centrations (Singer et al., 2005; Ziska and Caulfield, 2000) and temperatures (Beggs, 2004) that enhance the allergenic-ity (Singer et al., 2005) and quantallergenic-ity (Ziska and Caulfield, 2000) of pollens and duration of pollen seasons (Beggs, 2004; Beggs and Bambrick, 2006). The protection of sensi-tive populations from bioaerosols requires understanding en-vironmental exposures to bioaerosols as a function of their type, size, and temporal variation.
Ambient levels of pollens vary seasonally with plant phe-nology (Galán et al., 1995; Targonski et al., 1995). Spring-time in the Midwestern United States is generally character-ized by high levels of tree pollens (Targonski et al., 1995), such as oak (Wallner et al., 2009), birch (Emberlin et al., 2002), alder, and hazel (Niederberger et al., 1998). Summer-time has elevated concentrations of grass pollens (e.g., timo-thy and rye grass) and weed pollens, especially ragweed (Tar-gonski et al., 1995). Daily pollen levels are affected by tem-perature, with warmer conditions favoring pollen develop-ment, maturation, and active release (van Vliet et al., 2002). Rainfall promotes the passive release of intact pollens by agi-tation (Taylor and Jonsson, 2004). In rainy conditions, pollen grains absorb water, osmotically rupture, and release cyto-plasmic starch granules (D’Amato et al., 2007b). Microscopy studies have shown that intact birch pollens of 22 µm in size can rupture and release around 400 starch granules (Staff et al., 1999) ranging from 0.03 to 4 µm (D’Amato et al., 2007b). Consequently, human exposures to pollens in the atmosphere are highly dependent on pollen type, season, and local mete-orology.
Fungal growth and spore release is also promoted by el-evated temperatures (Corden and Millington, 2001) and wet conditions (Pasanen et al., 2000). Fungi discharge spores via splash-induced emission, as is the case forCladosporium, a prominent fungal genus (Troutt and Levetin, 2001; Oliveira et al., 2009) that releases spores by mechanical shock and fast air currents produced by rain drops (Elbert et al., 2007; Al-litt, 2000). Fungi that belong to the division Ascomycota dis-perse spores in moist conditions (Jones and Harrison, 2004), leading to elevated spore levels several hours after rain (Al-litt, 2000; Packe and Ayres, 1985). The release of bioaerosols during and after rain events can trigger significant changes to ambient bioaerosol numbers (Knox, 1993; Huffman et al., 2013) and mass concentrations (Marks et al., 2001).
Bacteria in the atmosphere are typically attached to soil or vegetative surfaces as agglomerations of cells (Jones and Harrison, 2004). Taxonomic analysis has revealed that soil and plant surfaces serve as sources of bacteria in the Mid-western US (Bowers et al., 2011). Ambient bacterial levels increase with temperature (Carty et al., 2003) due to condi-tions that favor vegetation and bacterial habitat (DeLucca and Palmgren, 1986; Romantschuk, 1992). In vegetation-covered areas, atmospheric bacterial concentrations have been shown to increase during and after simulated rain events (Graham
et al., 1977; Robertson and Alexander, 1994) as well as nat-ural rain events (Constantinidou et al., 1990; Huffman et al., 2013). This response to precipitation has been attributed to rain moving plants and aerosolizing bacteria (Jones and Har-rison, 2004). With strong dependences on local meteorology, bacteria are likely to exhibit high temporal variability.
Once released, bioaerosols in the atmosphere promote cloud and ice nucleation (Pope, 2010; Sun and Ariya, 2006; Murray et al., 2012). Intact birch, walnut, and willow pol-lens have been demonstrated to be cloud condensation nuclei (CCN) (Pope, 2010), with cytoplasmic pollen granules rang-ing 0.05–0.3 µm berang-ing the most CCN active, due to their hy-groscopicity and longer residence time (Steiner et al., 2015). Bacteria also are CCN, at relatively low supersaturations (Sun and Ariya, 2006; Franc and Demott, 1998). Because of their ordered structures, bioaerosols are effective ice nuclei (IN), forming ice crystals at sub-cooled temperatures, includ-ing intact pollens (Diehl et al., 2001, 2002), pollen extracts (Augustin et al., 2013), fungal spores, and bacteria (Murray et al., 2012). Their ability to act as CCN and IN affects the earth’s climate through changes to cloud albedo and precipi-tation cycles (Diehl et al., 2001; Sun and Ariya, 2006).
fine (PM2.5) and coarse (PM10–2.5)size modes; (ii) evalu-ate environmental conditions including rain and temperature that lead to high bioaerosol levels and decreases in size from coarse to fine particles; (iii) determine intact pollen diame-ters and chemically profile regionally important pollen types (red oak, pin oak, cotton ragweed, giant ragweed, and corn) for use in source apportionment; and (iv) estimate pollen and fungal spore contributions to PM mass by way of chemical mass balance (CMB) modeling. The outcomes of this study include an improved understanding of changes in ambient bioaerosol concentrations and distributions across fine and coarse size modes in response to rain events and their contri-butions to PM mass.
2 Methods
2.1 Sample collection
Daily (24 h) PM samples were collected during 17 April– 9 May (springtime) and 15 August–4 September (late sum-mer) in 2013, at the University of Iowa air monitoring site in Iowa City, Iowa, US (+41.6647,−91.5845). The site was lo-cated at the entrance University of Iowa Ashton Cross Coun-try Course in a suburban landscape in an open area sur-rounded by woods, agricultural fields, meadows, and a park-ing lot. PM2.5and PM10–2.5were collected using an Ander-sen dichotomous sampler (Series 241) that included a PM10 cut-off impactor (Anderson Instruments, Model 246b) and virtual impactor. The total air flow rate was 16.67 L min−1, and the coarse flow rate was 1.667 L min−1. These PM sam-ples were collected on 37 mm Teflon filters (Pall Corp.). PM10 was calculated as the sum of PM2.5 and PM10–2.5.
The dichotomous sampler had a UMLBL (the University of Minnesota–Lawrence Berkeley Laboratory) type inlet which is equipped with a rain guard and a mesh screen to exclude rain drops and insects. Additional PM2.5samples were col-lected onto 90 mm quartz fiber filters (Pall Life Sciences) using a medium-volume sampler (URG Corp.) equipped with a sharp-cut cyclone to select PM2.5 at a flow rate of 90 L min−1. Rain was excluded from the PM2.5sampler pri-marily by positioning the inlet downward and secondarily by the cyclone. Both samplers were affixed to a platform 3 m above ground level and were unobstructed. Flow rates were measured using a rotameter at the beginning and the end of each sampling period; average flow rates were used to cal-culate air volumes. Filters were changed at 08:00 local time (CST), and one field blank was collected for every five sam-ples. After sample collection, filters were stored at−20◦C in the dark.
To assess the representativeness of 2013 PM levels at the measurement site to typical conditions in Iowa, PM2.5 and PM10 mass measurements were compared to measurements from 2010 to 2015 downloaded from the Technology Trans-fer Network (TTN) Air Quality System (AQS) Data Mart
(USEPA, 2014). The federal reference method (FRM) site for Johnson County, Iowa, is located at Hoover Elementary School (+41.6572,−91.5035), 6.3 km east of the University of Iowa air monitoring site. PM2.5concentrations were com-pared to average levels over the sampling period calculated from hourly measurements, while PM10data were compared to filter measurements collected from midnight to midnight every 3 days.
2.2 PM mass measurement
PM mass was determined by the difference of pre- and post-sampling Teflon filter weights. Filter measurements made in a temperature- (21.9◦C) and humidity-controlled (25±5 %) room using an analytical microbalance (Mettler Toledo XP26) after conditioning 48 h. Standard deviations of triplicate measurements were used as the error associated with the mass measurement.
2.3 Analysis of carbohydrates and inorganic ions All glassware was pre-baked at 500◦C for 5 h, while plas-tic vials used were pre-rinsed with ultrapure (UP) water (re-sistivity > 18.2 Mcm−1) (Barnstead EasyPure II, 7401). Teflon filters (containing PM10–2.5samples) were cut in half using ceramic scissors on a clean, guided glass surface. Prior to extraction, Teflon filters were pre-wet with 100 µL of ace-tone (Sigma Aldrich). Subsamples of Teflon and quartz fiber filters (containing PM2.5) were extracted into 4.00 mL of UP water by rotary shaking for 10 min at 125 rpm, ultra-sonication for 30 min at 60 Hz (Branson 5510, Danbury, CT, US), and then rotary shaking for an additional 10 min. The extract was then filtered through a 0.45 µm polypropylene sy-ringe filter (GE Healthcare, UK).
Each analysis batch consisted of eight PM samples, two field blanks, one lab blank, and one spike recovery sample. Sum-marized in Table S1 in the Supplement are carbohydrate ex-traction efficiencies (94–103 %), instrument detection limits, and method detection limits.
Inorganic ion concentrations were determined using ion exchange chromatography with suppressed conductivity de-tection (ICS-5000, described above) following Jayarathne et al. (2014). Briefly, anions were separated on an Ion-Pac AS22 analytical column (4×250 mm, Dionex) preceded by a guard column and followed by a suppresser (Dionex AERS 500). Cations were separated on an IonPac CS12A an-alytical column (3×150 mm, Dionex) preceded by a guard column and followed by suppresser (Dionex CERS 500). Seven-point calibration curves were prepared from Seven Anion Standard and Six Cation-II Standard (Dionex) over the range of 0.010–10.0 ppm. Method performance metrics are summarized elsewhere (Jayarathne et al., 2014).
2.4 Analysis of biomarkers
Biomarkers were analyzed in extracts from the remaining halves of Teflon filters containing coarse PM and entire Teflon filters containing fine PM. Filters were extracted via shaking into 2 mL of sterile pyrogen-free (PF) water for 1 h at 22◦C. Extracts were then centrifuged for 5 min (600 g at 4◦C).
For analysis of fungal glucans, one aliquot of the super-natant was transferred into a PF borosilicate tube, mixed with 10x PF phosphate-buffered saline containing 0.05 % Tween 20 (a surfactant), shaken for 1 h, autoclaved for 1 h, shaken for 20 min, and then centrifuged for 20 min (600 g at 4◦C). Glucans were quantified by enzyme immunoassay as previ-ously described by Blanc et al. (2005). A 12-point calibration curve prepared from (1-3, 1-6)-β-D-glucan (scleroglucan) ranged from 3 to 5000 ng mL −1. The solution absorbance was measured at 450 nm (SpectraMax Plus 384; Molecular Devices, Sunnyvale, CA, USA).
For analysis of endotoxins, a second aliquot of the su-pernatant was subjected to the kinetic chromogenic Limu-lusamebocyte lysate assay (LAL) (Lonza, Inc., Walkersville, MD) as described in Thorne (2000). The 12-point calibra-tion curve was generated utilizing endotoxin standard ( Es-cherichia coli055:B5) at concentrations ranging from 0.024 to 50 endotoxin units (EU) mL−1. The solution absorbance was measured at 405 nm (SpectraMax M5, Molecular De-vices).
2.5 Collection and analysis of pollens
Oak pollens were harvested from pin and red oak trees in park areas surrounding Iowa City during the spring of 2013 into pre-cleaned aluminium-foil-lined bags. Cotton and giant ragweed pollens were collected in late summer of 2015 from bushes near roadways in residential areas of Iowa City.
Cot-ton ragweed and corn pollens were purchased (Polysciences Inc., Warrington, PA). Pollen images were taken to deter-mine pollen grain diameters using a Zeiss LSM 710 fluo-rescence microscope (Carl Zeiss Microscopy GmbH, 07745 Jena, Germany) following Pöhlker et al. (2012) and an IX-81 inverted microscope (Olympus Corporation, Tokyo, Japan). Prior to extraction and chemical analysis, pollens were des-iccated overnight and weighed (Mettler Toledo XS204 and XP26 balances). Pollens (∼0.005–0.015 g) were extracted and analyzed following the methods described in Sect. 2.3. 2.6 Chemical mass balance modeling
PM mass was apportioned to fungal spores and pollens using the EPA-CMB model (version 8.2). PM2.5and PM10 mass (from the sum of PM2.5 and PM10–2.5)was apportioned to bioaerosols using sucrose, glucose, fructose, and mannitol as fitting species. Input source profiles included one pollen pro-file selected from red oak, pin oak (this study), white birch, Chinese willow, or Peking willow (Fu et al., 2012) and one fungal spore profile (Bauer et al., 2008). Sensitivity tests were conducted to assess the fit of different pollen profiles to ambient measurements, focusing on sampling days from 26 April to 9 May when pollen tracer levels were highest. 2.7 Statistical analysis
Prior to statistical analysis, data points below detection lim-its were substituted with the limit of detection (LOD)/√2 (Hewett and Ganser, 2007). Concentration measurements were tested for normality and lognormality using the Anderson–Darling test in Minitab (version 16). Species con-centration measurements were not normally distributed; thus Spearman’s rank order correlation was employed for non-parametric comparisons (rs) in Minitab (version 16). PM measurements were normally distributed; thust tests com-paring PM means from dry and rainy periods were conducted in Minitab (version 16). Significance was assessed at the 95 % confidence interval (p≤0.05).
3 Results and discussion
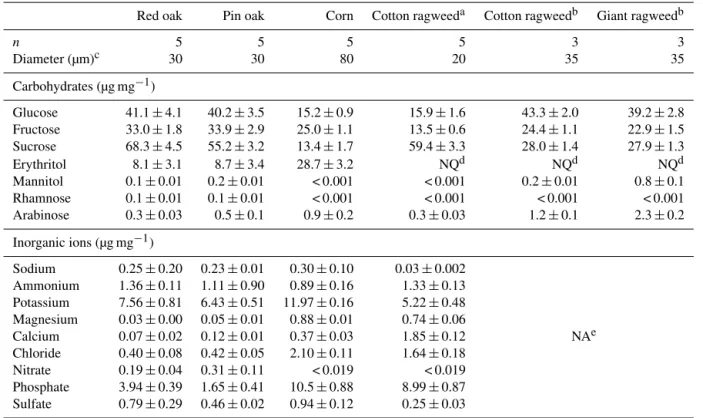
Table 1.Pollen diameter and mass fractions of carbohydrates and ions with standard errors. The carbohydrates arabitol, xylitol, trehalose, fucose, mannose, xylose, and ribose were below detection limits.
Red oak Pin oak Corn Cotton ragweeda Cotton ragweedb Giant ragweedb
n 5 5 5 5 3 3
Diameter (µm)c 30 30 80 20 35 35
Carbohydrates (µg mg−1)
Glucose 41.1±4.1 40.2±3.5 15.2±0.9 15.9±1.6 43.3±2.0 39.2±2.8
Fructose 33.0±1.8 33.9±2.9 25.0±1.1 13.5±0.6 24.4±1.1 22.9±1.5
Sucrose 68.3±4.5 55.2±3.2 13.4±1.7 59.4±3.3 28.0±1.4 27.9±1.3
Erythritol 8.1±3.1 8.7±3.4 28.7±3.2 NQd NQd NQd
Mannitol 0.1±0.01 0.2±0.01 < 0.001 < 0.001 0.2±0.01 0.8±0.1
Rhamnose 0.1±0.01 0.1±0.01 < 0.001 < 0.001 < 0.001 < 0.001
Arabinose 0.3±0.03 0.5±0.1 0.9±0.2 0.3±0.03 1.2±0.1 2.3±0.2
Inorganic ions (µg mg−1)
Sodium 0.25±0.20 0.23±0.01 0.30±0.10 0.03±0.002 Ammonium 1.36±0.11 1.11±0.90 0.89±0.16 1.33±0.13 Potassium 7.56±0.81 6.43±0.51 11.97±0.16 5.22±0.48 Magnesium 0.03±0.00 0.05±0.01 0.88±0.01 0.74±0.06
Calcium 0.07±0.02 0.12±0.01 0.37±0.03 1.85±0.12 NAe
Chloride 0.40±0.08 0.42±0.05 2.10±0.11 1.64±0.18 Nitrate 0.19±0.04 0.31±0.11 < 0.019 < 0.019 Phosphate 3.94±0.39 1.65±0.41 10.5±0.88 8.99±0.87 Sulfate 0.79±0.29 0.46±0.02 0.94±0.12 0.25±0.03
aPurchased from Polysciences.bCollected locally from Iowa City during late summer 2015.cApproximate diameters.dNot quantified (NQ) due to chromatographic interferences.eNot analyzed (NA).
these species are used as bioaerosol tracers, since their con-centrations reflect mass concon-centrations of the corresponding bioaerosol. These species provide general insight to classes of bioaerosols present but cannot be used for species-level identification, which requires either microscopy imaging or DNA sequencing.
3.1 Characterization of pollens common to the Midwestern US
Red oak, pin oak, corn, cotton ragweed, and giant ragweed pollen ranged in average diameter from 20 to 80 µm (Fig. S1, Table 1). Together, glucose, fructose, and sucrose accounted for an average of 5–14 % of pollen mass, while erythritol, arabinose, mannitol, and rhamnose were detected in trace amounts (Table 1). Due to the relatively high mass fraction of glucose, fructose, and sucrose in pollens in the present and in prior studies (Fu et al., 2012; Speranza et al., 1997), these carbohydrates are the best candidates for assessing pollen contributions to ambient PM. Notably, the carbohydrate dis-tributions in corn pollens differ from those previously ported (Speranza et al., 1997), with differences likely re-sulting from genetics (Speranza et al., 1997) and environ-mental factors (e.g., temperature, availability of water, and CO2levels) that are known to affect the synthesis and stor-age of carbohydrates (Aloni et al., 2001; Yoshida et al., 1998;
Vesprini et al., 2002). Across different pollen types, the rela-tive abundances of glucose, fructose, and sucrose varied. For instance, the most abundant carbohydrate was sucrose for red oak, pin oak, and Polysciences cotton ragweed; fructose for corn pollen; and glucose for local cotton and giant ragweed. Sucrose-to-fructose ratios across different pollen types may serve to identify pollen types in ambient PM, in cases when a single pollen type is dominant (as discussed in Sect. 3.6.1).
3.2 Fine- and coarse-PM concentrations 3.2.1 Spring
From 17 April to 9 May, 2013, daily PM10 levels in Iowa City ranged from 2 to 32 µg m−3 (with an average of 15±8.9 µg m−3), and fine PM ranged from 2 to 13 µg m−3 (with an average of 7.1±3.0 µg m−3). Comparison to PM levels at a nearby FRM site (located 6.3 km to the east) from 2010 to 2015 (Table S2) demonstrated that spring 2013 PM levels were typical with respect to the surrounding years.
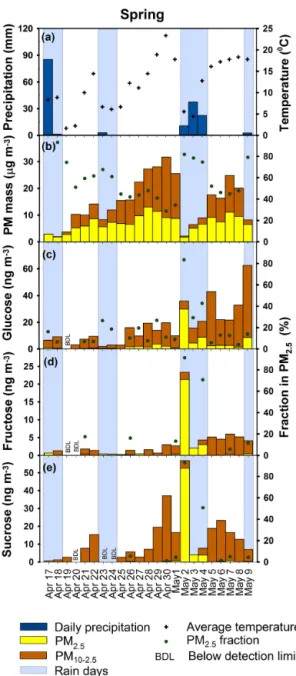
Figure 1.Temporal variation in precipitation and average temper-ature(a)in Iowa City, IA, in the spring of 2013. Ambient concen-trations of PM mass(b), glucose(c), fructose(d), and sucrose(e) in coarse and fine size fractions. The percent of PM and bioaerosol tracer mass in fine particles is shown on the right axis for samples in which the analyte was detected in both size modes. During rain on 2 May, PM is suppressed, while pollen tracers in the fine mode substantially increased.
1.9±1.5 µg m−3(Fig. 1b). The PM reduction on rainy days was statistically significant (p< 0.01) and was driven by wet deposition of PM in both size modes. Rain also affected the distribution of particles between the fine and coarse modes. PM2.5 contributed 48±11 % of PM10 on rainy days com-pared to 80±13 % on dry days. The shift in the PM size from coarse to fine modes reflects that rain was more effective at scavenging and/or suppressing the release of coarse particles
than fine particles. This is consistent with previous ambient studies that have demonstrated coarse PM is more effectively scavenged than fine particles (Guo et al., 2016; Li et al., 2016). Particle removal via rainfall depends on many factors, including a strong dependence on the particle size (Gregory, 1961; Baklanov and Sørensen, 2001); airborne particles with diameters greater than 3 µm have a higher tendency to collide with falling rain drops and are effectively scavenged via iner-tial impaction (Wang et al., 2010; Andronache, 2003; Mircea et al., 2000).
3.2.2 Late summer
Only one brief rain occurred during the 3-week campaign, on 22 August when a thunderstorm brought 1.0 mm between 10:00 and 11:00 (Fig. 2a). From 15 August to 4 Septem-ber 2013, Iowa City daily PM10 levels as shown in Fig. 2b ranged from 21 to 50 µg m−3 (averaging 33
±8 µg m−3), and fine-PM levels ranged from 3 to 17 µg m−3 (averag-ing 12±4 µg m−3). On average, fine PM accounted for 39±12 % of PM10. Compared to adjacent years (2010– 2015), the late summer of 2013 exhibited higher PM levels (Table S3). This is attributed to unusually dry conditions that reduce soil moisture, leading to increase soil resuspension, and lack of wet deposition.
3.3 Pollen tracers 3.3.1 Spring
The temporal variations of pollens were assessed utilizing the combination of glucose, fructose, and sucrose as chem-ical tracers. Ambient concentrations of these pollen tracers were relatively low from 17 to 25 April when lower tempera-tures (averaging 7◦C) and rainy conditions prevailed. Pollen tracer levels were relatively higher from 26 April to 9 May, coinciding with warmer temperatures (averaging 15◦C) that marked the transition from winter to spring (Fig. 1c–e, Ta-ble S4). Temperature and coarse-mode glucose and sucrose were significantly correlated (rs≥0.8,p< 0.001), reflecting that warmer temperatures promote the development, matura-tion, and release of pollens.
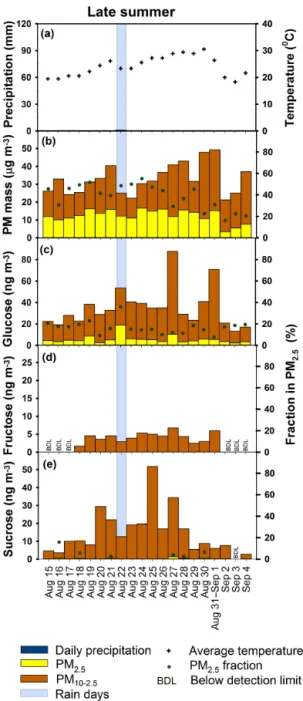
Figure 2.Temporal variation in precipitation and average temper-ature(a)in Iowa City, IA, in the late summer of 2013. Ambient concentrations of PM mass(b), glucose(c), fructose(d), and su-crose(e)in coarse and fine size fractions. The percent of PM and bioaerosol tracer mass in fine particles is shown on the right axis for samples in which the analyte was detected in both size modes.
3–4 May, pollen markers remained elevated in the fine mode relative to coarse PM. After the rain stopped, coarse-mode pollens increased in concentration and resumed the typical distribution across fine and coarse modes by 5 May. Light rainfall on 9 May coincided with increases in glucose in both size modes, with only 14 % of these tracers in the fine mode. Together, these data suggest release of pollen fragments less than 2.5 µm during some rain events (2–4 May) and the
pas-sive release of some pollen particles in the coarse particle size range during others (9 May). Notably, this is the first observation of the release of fine particle pollen fragments to the atmosphere using chemical tracers. Most field mea-surements include analysis of either PM2.5or PM10, while measurements in both size modes are required to capture this phenomenon.
The likely explanation for the increase in airborne pollens and simultaneous decrease in their size on 2 May is the rup-turing of pollen walls as a result of the osmotic pressure that builds up inside the pollen due to absorbed moisture during rain (Taylor et al., 2004, 2002). Osmotic shock has been pre-viously demonstrated to cause rupturing of grass and birch pollens that releases cytoplasm (Taylor et al., 2004, 2002; Suphioglu et al., 1992). Gusty winds can loft pollen frag-ments (Wallis et al., 1996), and strong winds on 2 May are likely to have contributed to the elevated fine-pollen levels.
Differences in the distributions of pollen tracers across fine and coarse modes during the rain events on 2 May (mostly fine PM) and 9 May (mostly coarse PM) are expected to re-sult from different pollen types predominating as evidenced by differing ratios of carbohydrates. On 2 May, the relative ratios of glucose and sucrose (normalized to fructose) in fine PM were 1.4 and 2.5, respectively, close to the ratios of red oak (1.2 and 2.1, respectively). Oak trees are abundant in eastern Iowa and a prominent pollen type in the springtime, making oak a likely (but unconfirmed) source of pollens in fine PM. Meanwhile, the respective carbohydrate ratios on 9 May (18 and 0.7, respectively) did not match any of the local or literature-available pollen profiles. These data sug-gest that certain pollen types undergo osmotic rupturing and release fine particles, while others do not. Further studies are needed to identify the types of pollens that rupture and con-ditions under which osmotic rupturing occurs.
3.3.2 Late summer
sin-gle late-summer rain event on 22 August coincided with an increase in fine-mode glucose concentration and an increase of the fine PM fraction of glucose to 34 %, compared to 16 % on dry days. The single late-summer rain event indicated pas-sive release of pollen fragments in response to rain that was similar to spring (Sect. 3.3.1). However, with only one rain event occurring in the late-summer study in 2013, additional studies are needed to validate these trends and identify the responsible pollen types.
3.4 Fungal spore tracers 3.4.1 Spring
Daily coarse-mode fungal spore tracer concentrations sig-nificantly correlated with daily average temperature: fungal sugar mannitol and temperature (rs=0.7,p< 0.001) and the fungal cell wall component glucan and temperature (rs=0.4,
p=0.04). From 17 to 21 and 23 to 25 April, cooler tem-peratures prevailed (averaging 6 and 7◦C, respectively), and PM10 mannitol and glucan concentrations were relatively low (Fig. 3a and b). An exceptionally high PM10 glucan level occurred (Fig. 3b) on 22 April, when temperature in-creased to a local maximum of 14◦C. From 26 April, tem-peratures warmed to an average of 15◦C, concurrent with an increase fungal spore tracer levels. The correlation of tem-perature with fungal spore tracers is consistent with warmer temperatures favoring fungal growth (Corden and Milling-ton, 2001; Rodriguez Rajo et al., 2005). The two tracers were moderately correlated with one another (rs=0.5,p< 0.02), signifying their origin from the same source.
Rain influenced ambient concentrations and the fine- and coarse-mode distributions of fungal spore tracers, likely by triggering passive and/or active release mechanisms and/or promoting fungal growth. Maximum mannitol and glucan levels occurred on 5 May, which followed 3 days with rain (Fig. 3a–b). Rainfall facilitates fungal growth, promot-ing fungal germination and hyphal growth (Schulthess and Faeth, 1998; Morris et al., 2016), and wet conditions that follow rain are favorable for active release of fungal spores (Rodriguez Rajo et al., 2005; Van Osdol et al., 2004). For instance, actively discharged ascospores peak after rain in wet conditions (Troutt and Levetin, 2001; Elbert et al., 2007; MacHardy and Gadoury, 1986). Fungal spore tracer levels in coarse PM dropped on days when rain fell (e.g., 23 April, 2 May), due to particle removal by wet deposition. The fine-and coarse-mode distributions of fungal spores, which typ-ically have intact diameters in the range of 1–30 µm (Jones and Harrison, 2004), also were influenced by rain.. During dry days, 13 % of fungal spore tracers were in the fine PM fraction. On rainy days, the fraction of fungal spore tracers in the fine mode reached local maxima at 41 % (23 April), 36 % (24 April), and 54 % (2 May) for mannitol and 38 % for glu-cans (23 April; Fig. 3a–b, right axis). The relative decrease in the size of fungal spores is attributed to a combination
Figure 3.Ambient concentrations of mannitol(a), glucans(b), and endotoxins(c)in coarse and fine size fractions in Iowa City, IA, dur-ing sprdur-ing of 2013. The percent of PM and bioaerosol tracer mass in fine particles is shown on the right axis for samples in which the analyte was detected in both size modes. Fungal spore tracers increased significantly on 5 May, following a rainy period.
of the passive release of fungal spores less than 2.5 µm via rain splash and mechanical agitation of vegetative surfaces by rain drops (Allitt, 2000; Elbert et al., 2007; Huffman et al., 2013), and the removal of coarse fungal spore particles by droplet scavenging. Compared to pollens (Sect. 3.3.1), rain events impacted the fine- and coarse-mode distributions of fungal spores to a much lesser extent.
3.4.2 Late summer
From mid-August to early-September atmospheric concen-trations of mannitol correlated with temperature (rs=0.5,
aver-Figure 4.Ambient concentrations of mannitol(a), glucans(b), and endotoxins(c)in coarse and fine size fractions in Iowa City, IA, dur-ing late summer of 2013. The percent of PM and bioaerosol tracer mass in fine particles is shown on the right axis for samples in which the analyte was detected in both size modes. Mannitol, the chemical tracer for fungal spores, and endotoxins from Gram-negative bacte-ria in the fine mode increased on 22 August when it rained.
age of 9±4 % of the total PM10 concentration and was not substantially different on 22 August (14 %).
Coarse-mode glucan concentrations in late summer were correlated neither with temperature (rs=0.01, p=1) nor with mannitol (rs=0.2,p=0.3). Mannitol concentrations and fungal spore counts have spatial and seasonal differences from one another (Bauer et al., 2008), likely due to differ-ences in mannitol emission per spore across fungal types (El-bert et al., 2007; Bauer et al., 2008) and/or mannitol concen-trations in spores from within a species (e.g., ascomycetes release ascospores during sexual reproduction and conidia during asexual reproduction; Nauta and Hoekstra, 1992). The glucan content in fungal cell walls also varies with the fun-gal species (Foto et al., 2004). Collectively, these differences could give rise to weak or negligible correlations of ambi-ent mannitol and glucan concambi-entrations. Alternatively, non-fungal sources of either mannitol or glucans would confound their correlation. For instance, higher plants and some algae
contain mannitol in their structure (Loescher et al., 1992; Shen et al., 1997). Ragweed pollens contain glucans (Foto et al., 2004) and are a possible glucan source in late sum-mer when ragweed pollens are prevalent; this is supported by glucans significantly correlating with sucrose (rs=0.5,
p=0.04). Alternatively glucans may have derived from bac-terial cells (McIntosh et al., 2005; Rylander and Lin, 2000), even though their correlation was not significant (rs=0.4,
p=0.1). Although glucans appear to have been influenced by bacterial and pollen levels in addition to fungi, the as-sessment of their ambient concentrations remains important, because they are immunostimulants that negatively impact human health (Thorn, 2001; Bonlokke et al., 2006).
3.5 Bacterial endotoxins 3.5.1 Spring
Coarse-mode bacterial endotoxins, measured in EU against an Escherichia coli (055:B5) standard, were signifi-cantly correlated with daily average temperature (rs=0.7,
p< 0.001). Lower temperatures averaging 7◦C from 17 to 25 April led to low endotoxin levels compared to a warmer period averaging 11–23◦C from 26 April to 1 May. The cor-relation of endotoxins with temperature agrees with prior am-bient studies (Carty et al., 2003; Guan et al., 2014; Degobbi et al., 2011; Rathnayake et al., 2016) and is attributed to warmer temperatures increasing vegetative surfaces that serve as sub-strates for bacterial growth (Romantschuk, 1992; DeLucca and Palmgren, 1986; Carty et al., 2003). Heavy rain on 2 and 3 May led to a drop in PM10 endotoxin concentrations, due to wet deposition and suppression of soil dust particles upon which bacteria settle. On average, 92±5 % of PM10 endotoxins were in the coarse mode (Fig. 3c). The distribu-tion of bacterial endotoxins as well as bacterial cells towards larger particles has been demonstrated previously (Nilsson et al., 2011; Monn et al., 1995; Shaffer and Lighthart, 1997). Such observations reflect the association of bacteria with particles prominent in coarse mode such as plant parts, an-imal parts, soil, spores, or pollen surfaces (Jones and Harri-son, 2004; Shaffer and Lighthart, 1997). In addition, it has been suggested that bacteria settled on particles are more likely to survive in the atmosphere compared to a single bacterium (Lighthart et al., 1993). Coarse-mode endotox-ins demonstrated a moderate positive correlation with cal-cium, the crustal element (rs=0.7, p< 0.001), which sug-gests soil resuspension as a source of endotoxins in Iowa City, which has been demonstrated previously in the Mid-western US (Bowers et al., 2011; Rathnayake et al., 2016).
3.5.2 Late summer
In late summer, daily average temperature had a positive moderate correlation with coarse-mode endotoxins (rs=0.5,
the only late-summer day with rain, fine-mode endotoxin concentrations reached a maximum (Fig. 4c). Meanwhile, the endotoxin fraction in the fine mode increased to 36 % relative to an average of 5 % on dry days. Rainfall promotes bacterial growth, such asPseudomonas syringae, which are common on plant surfaces and rapidly increase their popu-lations during rain (Hirano and Upper, 1990; Hirano et al., 1996). The release of endotoxin to fine PM is expected to be caused by the aerosolization of Gram-negative bacteria living on plant surfaces (e.g.,Pseudomonas syringae, Pseu-domonas fluorescens, andPseudomonas viridiflava; Murray et al., 2012) by agitation of plants or fungi by falling rain (Jones and Harrison, 2004; Constantinidou et al., 1990). Soil resuspension was suggested as an important source of bacte-rial endotoxins in spring (Sect. 3.5.1); however coarse-mode endotoxins were not significantly correlated with calcium in late summer (rs=0.2, p=0.33), suggesting that this is not the case. Consequently, non-soil bacterial sources were likely responsible, such as plant surfaces (Romantschuk, 1992; Jeter and Matthysse, 2005; Murray et al., 2012) that are probably agricultural row crops (Lindemann et al., 1982; Hirano et al., 1996) in the agricultural state of Iowa. This link could be further explored by examining the co-occurrence of bacterial endotoxins with markers of plant waxes (i.e., odd-numberedn-alkanes) but is beyond the scope of the present study. The comparison of spring and late-summer endotoxin behavior in response to rain suggests that soil bacteria are dominate in springtime, while bacteria residing on plant sur-faces dominate in late summer.
3.6 Contributions of pollens and fungal spores to PM mass
CMB source apportionment modeling was applied to es-timate mass contributions of pollens and fungal spores to PM10 and PM2.5. This work extends the application of
fun-gal spore tracer-to-mass ratios to estimate their contributions to PM mass (Di Filippo et al., 2013; Zhang et al., 2010) to pollens for the first time. The CMB model requires represen-tative source profiles for sources, which were drawn from the literature in the case of fungal spores (Bauer et al., 2008), birch, and willow pollens (Fu et al., 2012), and from this study (Sect. 3.1).
3.6.1 Source apportionment in spring
The pollen profiles that explained the greatest fraction of the variance in the springtime measurements (assessed by the CMB R2 value) were pin oak and red oak (Fig. S2). The resultantR2value further increased when fungal spores were added to the model (Fig. S2). Birch and willow pro-files, which showed an excess of sucrose (Fu et al., 2012), explained a substantially lower fraction of the variance in ambient data, where glucose and fructose concentrations out-weighed sucrose. Hence, birch and willow pollen profiles
were not considered further. Model results from using pin oak or red oak profiles in concert with the fungal spore profile produced consistent source contributions that were strongly correlated (Fig. S3). Because red oak and pin oak fit ambient data to a comparable extent and both are sources of atmo-spheric pollens in Iowa, the best estimate of pollen contribu-tions was calculated as the average contribution from red oak and pin oak.
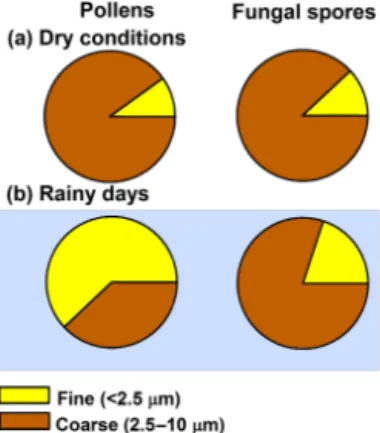
Pollen and fungal spore contributions to PM10and PM2.5 estimated by the CMB model are shown in Fig. 5 (and Table S6). Overall, contributions to fine PM after the on-set of spring from 26 April to 9 May ranged from 0.01 to 0.7 µg m−3 for pollens and 0.03 to 0.1 µg m−3 for fun-gal spores, while contributions to PM10 were consistently higher at 0.04–0.8 µg m−3 for pollens and 0.13–1.5 µg m−3 for fungal spores. On dry days, pollens contributed an aver-age of 0.7 % of PM2.5 and 3.3 % of PM10. On rainy days, pollen contributions to fine PM averaged 11 % and reached a maximum of 42 % on 2 May. Fungal spore contributions to fine PM averaged 0.5 % on dry days and 1.7 % on days with rain. Meanwhile, fungal spores had greater contribu-tions to PM10 mass on days following rain, reaching 8.7 % on 5 May. These source apportionment results demonstrate that bioaerosol contributions to PM10mass in spring are typ-ically low with averages of 4 and 5 % for pollens and fungal spores, respectively, but can be significantly greater on days with rain, when bioaerosols are released and PM is removed by wet deposition. The distribution of bioaerosols in fine and coarse PM during spring is shown in Fig. 6. For dry condi-tions,∼11 % of pollens and fungal spores were observed in fine PM. However, during rainy days, 62 % of pollen mass and 20 % of fungal spore mass were observed in fine PM. These results indicate the importance of rain altering fine-and coarse-mode distribution of bioaerosols by affecting re-lease mechanisms (i.e., passive rere-lease by splashing and me-chanical agitation, or osmotic rupture of pollens).
Bioaerosol contributions to PM in this study were rela-tively in good agreement with prior studies. The average fun-gal spore contribution to PM10in spring (5 %) was 1.6 times higher than a suburban site of Vienna, Austria, and 1.6 times lower than a tropical rainforest in China (Zhang et al., 2010), which were measured during springtime. Collectively, con-tributions from pollens (3.3 %) and fungal spores (0.9 %) to fine PM were∼2 times lower than contributions reported in the US determined in summertime (Coz et al., 2010). The slight variations of contributions could be attributed to the differences in ambient bioaerosol levels and geographical differences.
3.6.2 Source apportionment in late summer
Figure 5.Apportionment of PM10 mass(a)and PM2.5 mass(b) during the spring of 2013 to pollens and fungal spores using CMB modeling.
the range of ragweed pollen profiles, which is a dominant pollen type in the Midwest. This lack of agreement could re-sult from mixtures of pollen in the atmosphere that are not represented when utilizing a chemical profile for a single pollen type and/or other dominant pollen types during late summer (e.g., timothy grass and rye grass).
Fungal spore contributions to PM were es-timated using the average mannitol conversion factor of 1.7 pg mannitol spore−1 (range of 1.2– 2.4 pg mannitol spore−1) and a spore mass of 33 pg from Bauer et al. (2008). Resultant fungal spore mass contributions to PM2.5 and PM10–2.5 ranged from 0.04 to 0.31 and 0.45 to 3.44 µg m−3, respectively (Table S7). The contribution of fungal spores to PM2.5averaged 1 % on dry days and 3 % on 22 August when it rained. Meanwhile, fungal spore contributions to PM10–2.5 averaged 6 % and reached 16 % on 22 August. The maximum fungal spore contributions to PM on 22 August are likely due to fungal spores released during rain by passive mechanisms and after rain by active mechanisms (Sect. 3.4.1). This leads to an increase in fine-sized fungal spores during rain and coarse-sized spores post-rain (Huffman et al., 2013; Hjelmroos, 1993).
3.7 Implications of the release of fine bioaerosols surrounding rain events
The release of fine-sized bioaerosols can influence cloud for-mation, by acting as CCN and IN. Pollen fragments are ef-fective CCN and IN (Pope, 2010; Diehl et al., 2001). Dur-ing rain intact pollen particles can swell and rupture, pro-ducing hundreds of fine-sized pollen particles (D’Amato et al., 2007b), significantly increasing the number of CCN- and IN-active particles in the atmosphere. Bacteria and fungal
Figure 6.Distribution of pollen and fungal spore mass (apportioned by the CMB model) across fine and coarse PM during dry and rainy conditions. The fine- and coarse-mode distributions of pollens and fungal spores shifted towards fine particles during rain, with a more pronounced effect for pollens compared to fungal spores.
spores are also active IN and CCN (Murray et al., 2012; Sun and Ariya, 2006; Hassett et al., 2015). Bacterial strains with higher IN activity (mostly Gram-negative bacteria that habitat plant surfaces, such asPseudomonas syringae; Mur-ray et al., 2012) increase in population during rain (Hirano et al., 1996), which can substantially increase airborne IN (Morris et al., 2016), which can persist in the atmosphere for weeks following rain (Bigg et al., 2015). Rainfall in general favors fungal growth (Schulthess and Faeth, 1998; Morris et al., 2016) as well as passive and active release of spores (Ro-driguez Rajo et al., 2005; Van Osdol et al., 2004; Allitt, 2000; Elbert et al., 2007; Huffman et al., 2013), thereby increas-ing CCN- and IN-active particles in the atmosphere. When decreased in size (< 2.5 µm), these bioaerosols are more ef-fective IN (Murray et al., 2015; Huffman et al., 2013). Be-cause smaller particles have longer atmospheric lifetimes, fine bioaerosols will be transported longer distances before deposition and thus may have effects in areas downwind of their release.
the form of smaller particles, aeroallergens penetrate deeper into the respiratory tract, where they may trigger more se-vere allergenic responses (Taylor et al., 2002; Wilson et al., 1973). Acute asthma epidemics have been associated with rain events documented in Australia, Europe, Mexico, and the US (D’Amato et al., 2016; Dales et al., 2003; Grundstein et al., 2008), earning the name “thunderstorm asthma”. Such epidemics typically occur during pollen seasons (D’Amato et al., 2007a, b, 2016) and have been associated with ambi-ent pollen counts (Marks et al., 2001). While lightning is as-sociated with tropospheric ozone formation (Griffing, 1977; GAN, 2014), lightning alone (in the absence of rain) has not caused asthma epidemics (Grundstein et al., 2008), sug-gesting that rainfall plays an important role in thunderstorm asthma.
Pollen forecasting models currently do not include mech-anisms for the release of pollen in response to rain and in-stead assume that rain serves only as a sink of pollens, by means of droplet scavenging and wet deposition (Zhang et al., 2014). This erroneous assumption leads to predictions of low atmospheric pollen levels on days with rain (e.g., 2 May), when pollen tracer levels are highest and primar-ily in the form of fine particles. A more accurate representa-tion of airborne pollen levels is needed to support an early-warning system to sensitive populations, but it must go be-yond simply the co-occurrence of elevated pollen levels and thunderstorms, which are suggested to cause too many false alarms (Newson et al., 1998). For accurate model parame-terizations, a mechanistic and species-level understanding of pollen bursting is needed and should include definitions of the pollen types, seasonality, and meteorological conditions that promote the release of fine pollen particles to the atmo-sphere. In the meantime, persons suffering from pollen al-lergies should follow the recommendations of D’Amato et al. (2007b): “When asthmatic patients realize that a thunder-storm is approaching, the best thing for thing for them to do is to stay indoors, with windows closed.”
The results of this study provide new insight and tools to better understand the potential scope of thunderstorm asthma. While thunderstorm asthma has been documented in several locations, the data presented herein provide the first evidence of this phenomenon occurring in the Midwest-ern US. Thunderstorms and heavy rain are common in this region during spring, and thus it is anticipated that condi-tions characteristic of thunderstorm asthma likely occur sev-eral times annually. Pollen prediction indices do not currently account for the release of fine pollen fragments during rain, and consequently sensitive populations are not forewarned. To understand the potential for conditions that trigger thun-derstorm asthma more broadly, chemical tracer approaches, as used here, are a useful tool. Chemical tracers provide a sensitive method of detecting fine pollen particles that may be useful in monitoring conditions that precede PM2.5pollen release. Because carbohydrates are not expected to undergo chemical alternation by the pollen bursting, they also provide
a means of tracking pollens across PM size fractions and as-sociating pollens with their species of origin. Microscopy-based methods are challenged by changes to particle size and morphology upon bursting, which may require use of multiple microscopy techniques suitable for different particle sizes. Chemical tracer methods have potential to be broadly applied, as national monitoring programs routinely collect PM2.5samples on filters for chemical analysis. In this way, regions and atmospheric conditions that lead to high levels of PM2.5pollen particles may be better defined.
4 Conclusions
Daily concentrations of PM mass and bioaerosol tracers (in-cluding fructose, glucose, and sucrose for pollens; mannitol and glucans for fungal spores; and endotoxins from Gram-negative bacteria) demonstrated high day-to-day variability and influences from meteorology, particularly rain. Elevated bioaerosol tracer levels were observed when temperatures were warmer, suggesting increased pollen, fungal, and bac-terial concentrations during both spring and late-summer pe-riods. Rain events of spring triggered the release of pol-lens, with maximum levels of pollen tracers occurring on 2 and 9 May, when rain occurred following a period of ele-vated temperatures in spring. Airborne fungal spore tracers in coarse PM fraction, however, were suppressed by spring rain and increased in concentration following rain events. Source apportionment by CMB modeling in concert with Midwest-ern pollen profiles indicated significant contributions from bioaerosols to PM mass on rainy days during springtime. Importantly, the fine- and coarse-mode distributions of en-dotoxins, pollen and fungal spore tracers shifted towards fine particles (< 2.5 µm) during periods of rain. The fragmentation of pollens due to osmotic rupture has been shown previously through microscopy methods. For the first time, we demon-strate a shift of coarse particle pollens (2.5–10 µm) to fine particles (2.5 µm) by way of chemical tracers during a ma-jor rain event and propose that this is due to osmotic rupture of pollens. The release of finer-sized bioaerosols during rain events has important implications for human exposures, be-cause finer particles may penetrate more deeply into the lung and be transported over longer distances.
trigger such release, to allow for their accurate tion in atmospheric models to support accurate representa-tions of environmental condirepresenta-tions and forewarn susceptible populations of conditions that may lead to high bioaerosol exposures.
5 Data availability
All ambient measurements and model results are reported in the Supplement (Tables S4–S7).
The Supplement related to this article is available online at doi:10.5194/acp-17-2459-2017-supplement.
Competing interests. The authors declare that they have no conflict of interest.
Acknowledgements. We thank Ralph Altmaier and Lindy Carr
for their assistance with PM sample collection and gravimetric analysis, and Keri Hornbuckle for establishing the University of Iowa air monitoring site. We also thank Jianqiang Shao and Kather-ine Walters for helping with fluorescence and inverted microscope images, as well as the University of Iowa Central Microscopy Research Facility, a core resource supported by the Office of the Vice President for Research and Economic Development; the Holden Comprehensive Cancer Center; and the Carver College of Medicine. This research was supported by the Environmental Health Sciences Research Center (EHSRC) Seed Grant Program (NIH P30 ES005605) and the University of Iowa.
Edited by: S. S. Gunthe
Reviewed by: C. Morris and one anonymous referee
References
Allitt, U.: Airborne fungal spores and the thunder-storm of 24 June 1994, Aerobiologia, 16, 397–406, doi:10.1023/A:1026503500730, 2000.
Aloni, B., Peet, M., Pharr, M., and Karni, L.: The effect of high tem-perature and high atmospheric CO2on carbohydrate changes in bell pepper (Capsicum annuum) pollen in relation to its germi-nation, Physiol. Plantarum, 112, 505–512, doi:10.1034/j.1399-3054.2001.1120407.x, 2001.
Andronache, C.: Estimated variability of below-cloud aerosol re-moval by rainfall for observed aerosol size distributions, Atmos. Chem. Phys., 3, 131–143, doi:10.5194/acp-3-131-2003, 2003. Augustin, S., Wex, H., Niedermeier, D., Pummer, B., Grothe,
H., Hartmann, S., Tomsche, L., Clauss, T., Voigtländer, J., Ig-natius, K., and Stratmann, F.: Immersion freezing of birch pollen washing water, Atmos. Chem. Phys., 13, 10989–11003, doi:10.5194/acp-13-10989-2013, 2013.
Baklanov, A. and Sørensen, J.: Parameterisation of radionu-clide deposition in atmospheric long-range transport modelling, Phys. Chem. Earth Pt. B, 26, 787–799, doi:10.1016/S1464-1909(01)00087-9, 2001.
Bauer, H., Claeys, M., Vermeylen, R., Schueller, E., Weinke, G., Berger, A., and Puxbaum, H.: Arabitol and mannitol as tracers for the quantification of airborne fungal spores, Atmos. Environ., 42, 588–593, doi:10.1016/j.atmosenv.2007.10.013, 2008. Beggs, P. J.: Impacts of climate change on aeroallergens: past and
future, Clin. Exp. Allergy, 34, 1507–1513, doi:10.1111/j.1365-2222.2004.02061.x, 2004.
Beggs, P. J. and Bambrick, H. J.: Is the global rise of asthma an early impact of anthropogenic climate change?, Ciênc. Saúde Coletiva, 11, 745–752, doi:10.1590/S1413-81232006000300022, 2006. Bigg, E. K., Soubeyrand, S., and Morris, C. E.: Persistent
after-effects of heavy rain on concentrations of ice nuclei and rainfall suggest a biological cause, Atmos. Chem. Phys., 15, 2313–2326, doi:10.5194/acp-15-2313-2015, 2015.
Blanc, P. D., Eisner, M. D., Katz, P. P., Yen, I. H., Archea, C., Earnest, G., Janson, S., Masharani, U. B., Quinlan, P. J., and Hammond, S. K.: Impact of the home indoor environment on adult asthma and rhinitis, J. Occup. Environ. Med., 47, 362–372, doi:10.1097/01.jom.0000158708.32491.9d, 2005.
Bonlokke, J. H., Stridh, G., Sigsgaard, T., Kjærgaard, S. K., Löfst-edt, H., Andersson, K., Bonefeld-Jørgensen, E. C., Jayatissa, M. N., Bodin, L., and Juto, J.-E.: Upper-airway inflammation in re-lation to dust spiked with aldehydes or glucan, Scand. J. Work Env. Hea., 32, 374–382, 2006.
Bowers, R. M., Sullivan, A. P., Costello, E. K., Collett, J. L., Knight, R., and Fierer, N.: Sources of bacteria in outdoor air across cities in the midwestern United States, Appl. Environ. Microb., 77, 6350–6356, doi:10.1021/es402970s, 2011.
Brown, J. S., Gordon, T., Price, O., and Asgharian, B.: Thoracic and respirable particle definitions for human health risk assess-ment, Part. Fibre Toxicol., 10, 1–12, doi:10.1186/1743-8977-10-12, 2013.
Burshtein, N., Lang-Yona, N., and Rudich, Y.: Ergosterol, ara-bitol and mannitol as tracers for biogenic aerosols in the eastern Mediterranean, Atmos. Chem. Phys., 11, 829–839, doi:10.5194/acp-11-829-2011, 2011.
Carty, C. L., Gehring, U., Cyrys, J., Bischof, W., and Heinrich, J.: Seasonal variability of endotoxin in ambient fine particulate mat-ter, J. Environ. Monitor., 5, 953–958, doi:10.1039/B308488D, 2003.
Chow, J. C., Yang, X., Wang, X., Kohl, S. D., Hurbain, P. R., Chen, L. A., and Watson, J. G.: Characterization of Ambient PM10 Bioaerosols in a California Agricultural Town, Aerosol Air Qual. Res., 15, 1433–1447, doi:10.4209/aaqr.2014.12.0313, 2015. Constantinidou, H., Hirano, S., Baker, L., and Upper, C.:
Atmo-spheric dispersal of ice nucleation-active bacteria: The role of rain, Phytopathology, 80, 934–937, 1990.
Corden, J. M. and Millington, W. M.: The long-term trends and sea-sonal variation of the aeroallergen Alternaria in Derby, UK, Aer-obiologia, 17, 127–136, doi:10.1023/A:1010876917512, 2001. Coz, E., Artíñano, B., Clark, L. M., Hernandez, M., Robinson, A.
Crawford, C., Reponen, T., Lee, T., Iossifova, Y., Levin, L., Ad-hikari, A., and Grinshpun, S. A.: Temporal and spatial variation of indoor and outdoor airborne fungal spores, pollen, and (1 > 3)-β-D-glucan, Aerobiologia, 25, 147–158, doi:10.1007/s10453-009-9120-z, 2009.
Dales, R., Miller, D., Ruest, K., Guay, M., and Judek, S.: Airborne endotoxin is associated with respiratory illness in the first 2 years of life, Environ. Health Perspect., 114, 610–614, 2006.
Dales, R. E., Cakmak, S., Judek, S., Dann, T., Coates, F., Brook, J. R., and Burnett, R. T.: The role of fungal spores in thunderstorm asthma, CHEST, 123, 745–750, doi:10.1378/chest.123.3.745, 2003.
D’Amato, G., Cecchi, L., Bonini, S., Nunes, C., Annesi-Maesano, I., Behrendt, H., Liccardi, G., Popov, T., and Van Cauwenberge, P.: Allergenic pollen and pollen allergy in Europe, Allergy, 62, 976–990, doi:10.1111/j.1398-9995.2007.01393.x, 2007a. D’Amato, G., Liccardi, G., and Frenguelli, G.:
Thunderstorm-asthma and pollen allergy, Allergy, 62, 11–16, doi:10.1111/j.1398-9995.2006.01271.x, 2007b.
D’Amato, G., Vitale, C., D’Amato, M., Cecchi, L., Liccardi, G., Molino, A., Vatrella, A., Sanduzzi, A., Maesano, C., and Annesi-Maesano, I.: Thunderstorm related asthma: what happens and why, Clin. Exp. Allergy, 46, 390–396, doi:10.1111/cea.12709, 2016.
Degobbi, C., Lopes, F. D., Carvalho-Oliveira, R., Muñoz, J. E., and Saldiva, P. H.: Correlation of fungi and endo-toxin with PM2.5 and meteorological parameters in atmo-sphere of Sao Paulo, Brazil, Atmos. Environ., 45, 2277–2283, doi:10.1016/j.atmosenv.2010.12.005, 2011.
DeLucca, A. and Palmgren, M.: Mesophilic microorganisms and endotoxin levels on developing cotton plants, Am. Ind. Hyg. As-soc. J., 47, 437–442, doi:10.1080/15298668691390016, 1986. Diehl, K., Quick, C., Matthias-Maser, S., Mitra, S., and Jaenicke,
R.: The ice nucleating ability of pollen: Part I: Laboratory studies in deposition and condensation freezing modes, Atmos. Res., 58, 75–87, doi:10.1016/S0169-8095(01)00091-6, 2001.
Diehl, K., Matthias-Maser, S., Jaenicke, R., and Mitra, S.: The ice nucleating ability of pollen:: Part II. Laboratory studies in im-mersion and contact freezing modes, Atmos. Res., 61, 125–133, doi:10.1016/S0169-8095(01)00132-6, 2002.
Di Filippo, P., Pomata, D., Riccardi, C., Buiarelli, F., and Per-rino, C.: Fungal contribution to size-segregated aerosol mea-sured through biomarkers, Atmos. Environ., 64, 132–140, doi:10.1016/j.atmosenv.2012.10.010, 2013.
Douwes, J., Thorne, P., Pearce, N., and Heederik, D.: Bioaerosol health effects and exposure assessment: progress and prospects, Ann. Occup. Hyg., 47, 187–200, doi:10.1093/annhyg/meg032, 2003.
Elbert, W., Taylor, P. E., Andreae, M. O., and Pöschl, U.: Contribu-tion of fungi to primary biogenic aerosols in the atmosphere: wet and dry discharged spores, carbohydrates, and inorganic ions, At-mos. Chem. Phys., 7, 4569–4588, doi:10.5194/acp-7-4569-2007, 2007.
Emberlin, J., Detandt, M., Gehrig, R., Jaeger, S., Nolard, N., and Rantio-Lehtimäki, A.: Responses in the start of Betula (birch) pollen seasons to recent changes in spring temperatures across Europe, Int. J. Biometeorol., 46, 159–170, doi:10.1007/s00484-002-0139-x, 2002.
Foto, M., Plett, J., Berghout, J., and Miller, J. D.: Modification of the Limulus amebocyte lysate assay for the analysis of glucan in indoor environments, Anal. Bioanal. Chem., 379, 156–162, doi:10.1007/s00216-004-2583-4, 2004.
Franc, G. D. and Demott, P. J.: Cloud activation char-acteristics of airborne Erwinia carotovora cells, J. Appl. Meteorol., 37, 1293–1300, doi:10.1175/1520-0450(1998)037<1293:CACOAE>2.0.CO;2, 1998.
Fu, P., Kawamura, K., Kobayashi, M., and Simoneit, B. R.: Sea-sonal variations of sugars in atmospheric particulate matter from Gosan, Jeju Island: Significant contributions of airborne pollen and Asian dust in spring, Atmos. Environ., 55, 234–239, doi:10.1016/j.atmosenv.2012.02.061, 2012.
Galán, C., Emberlin, J., Domínguez, E., Bryant, R. H., and Villa-mandos, F.: A comparative analysis of daily variations in the Gramineae pollen counts at Córdoba, Spain and London, UK, Grana, 34, 189–198, doi:10.1080/00173139509429042, 1995. GAN (Global Asthma Network): The Global Asthma Report,
avail-able at: http://www.globalasthmareport.org/resources/Global_ Asthma_Report_2014.pdf (last access: January 2016), 2014. Garrett, M., Rayment, P., Hooper, M., Abramson, M., and Hooper,
B.: Indoor airborne fungal spores, house dampness and asso-ciations with environmental factors and respiratory health in children, Clin. Exp. Allergy, 28, 459–467, doi:10.1046/j.1365-2222.1998.00255.x, 1998.
Graham, D., Quinn, C., and Bradley, L. F.: Quantitative Studies on the Generation of Aerosols of Erwinia carotovora var. atroseptica by Simulated Raindrop Impaction on Blackleg-infected Potato Stems, J. Appl. Bacteriol., 43, 413–424, doi:10.1111/j.1365-2672.1977.tb00768.x, 1977.
Gregory, P. H.: The microbiology of the atmosphere, 1 ed., Inter-science Publishers, New York, USA, 148–152, 1961.
Griffing, G. W.: Ozone and oxides of nitrogen produc-tion during thunderstorms, J. Geophys. Res., 82, 943–950, doi:10.1029/JC082i006p00943, 1977.
Grote, M., Vrtala, S., Niederberger, V., Wiermann, R., Valenta, R., and Reichelt, R.: Release of allergen-bearing cytoplasm from hydrated pollen: a mechanism common to a variety of grass (Poaceae) species revealed by electron microscopy, J. Allergy Clin. Immun., 108, 109–115, doi:10.1067/mai.2001.116431, 2001.
Grundstein, A., Sarnat, S. E., Klein, M., Shepherd, M., Nae-her, L., Mote, T., and Tolbert, P.: Thunderstorm asso-ciated asthma in Atlanta, Georgia, Thorax, 63, 659–660, doi:10.1136/thx.2007.092882, 2008.
Guan, T., Yao, M., Wang, J., Fang, Y., Hu, S., Wang, Y., Dutta, A., Yang, J., Wu, Y., and Hu, M.: Airborne endotoxin in fine particulate matter in Beijing, Atmos. Environ., 97, 35–42, doi:10.1016/j.atmosenv.2014.08.005, 2014.
Guo, L.-C., Zhang, Y., Lin, H., Zeng, W., Liu, T., Xiao, J., Ruther-ford, S., You, J., and Ma, W.: The washout effects of rainfall on atmospheric particulate pollution in two Chinese cities, Environ. Pollut., 215, 195–202, doi:10.1016/j.envpol.2016.05.003, 2016. Hassett, M. O., Fischer, M. W., and Money, N. P.: Mushrooms as
Rainmakers: How Spores Act as Nuclei for Raindrops, PLoS One, 10, e0140407, doi:10.1371/journal.pone.0140407, 2015. Hewett, P. and Ganser, G. H.: A comparison of several methods for
Hirano, S. S. and Upper, C. D.: Population biology and epidemi-ology of Pseudomonas syringae, Annu. Rev. Phytopathol., 28, 155–177, 1990.
Hirano, S. S., Baker, L. S., and Upper, C. D.: Raindrop momentum triggers growth of leaf-associated populations of Pseudomonas syringae on field-grown snap bean plants, Appl. Environ. Mi-crob., 62, 2560–2566, 1996.
Hjelmroos, M.: Relationship between airborne fungal spore pres-ence and weather variables: Cladosporium and Alternaria, Grana, 32, 40–47, doi:10.1080/00173139309436418, 1993.
Huffman, J. A., Treutlein, B., and Pöschl, U.: Fluorescent bi-ological aerosol particle concentrations and size distributions measured with an Ultraviolet Aerodynamic Particle Sizer (UV-APS) in Central Europe, Atmos. Chem. Phys., 10, 3215–3233, doi:10.5194/acp-10-3215-2010, 2010.
Huffman, J. A., Prenni, A. J., DeMott, P. J., Pöhlker, C., Mason, R. H., Robinson, N. H., Fröhlich-Nowoisky, J., Tobo, Y., Després, V. R., Garcia, E., Gochis, D. J., Harris, E., Müller-Germann, I., Ruzene, C., Schmer, B., Sinha, B., Day, D. A., Andreae, M. O., Jimenez, J. L., Gallagher, M., Kreidenweis, S. M., Bertram, A. K., and Pöschl, U.: High concentrations of biological aerosol par-ticles and ice nuclei during and after rain, Atmos. Chem. Phys., 13, 6151–6164, doi:10.5194/acp-13-6151-2013, 2013.
Jayarathne, T., Stockwell, C. E., Yokelson, R. J., Nakao, S., and Stone, E. A.: Emissions of fine particle fluoride from biomass burning, Environ. Sci. Technol., 48, 12636–12644, doi:10.1021/es502933j, 2014.
Jensen, M. B. and Johnson, D. C.: Fast wave forms for pulsed elec-trochemical detection of glucose by incorporation of reductive desorption of oxidation products, Anal. Chem., 69, 1776–1781, doi:10.1021/ac960828x, 1997.
Jeter, C. and Matthysse, A. G.: Characterization of the binding of diarrheagenic strains of E. coli to plant surfaces and the role of curli in the interaction of the bacteria with alfalfa sprouts, Mol. Plant. Microbe In., 18, 1235–1242, doi:10.1094/MPMI-18-1235, 2005.
Jia, Y., Bhat, S., and Fraser, M. P.: Characterization of saccharides and other organic compounds in fine parti-cles and the use of saccharides to track primary biologi-cally derived carbon sources, Atmos. Environ., 44, 724–732, doi:10.1016/j.atmosenv.2009.10.034, 2010a.
Jia, Y., Clements, A. L., and Fraser, M. P.: Saccharide composi-tion in atmospheric particulate matter in the southwest US and estimates of source contributions, J. Aerosol Sci., 41, 62–73, doi:10.1016/j.jaerosci.2009.08.005, 2010b.
Jones, A. M. and Harrison, R. M.: The effects of meteorological fac-tors on atmospheric bioaerosol concentrations –a review, Sci. To-tal Environ., 326, 151–180, doi:10.1016/j.scitotenv.2003.11.021, 2004.
Joung, Y. S. and Buie, C. R.: Aerosol generation by raindrop im-pact on soil, Nat. Commun., 6, 6083, doi:10.1038/ncomms7083, 2015.
Knox, R.: Grass pollen, thunderstorms and asthma, Clin. Exp. Allergy, 23, 354–359, doi:10.1111/j.1365-2222.1993.tb00339.x, 1993.
Knutsen, A. P., Bush, R. K., Demain, J. G., Denning, D. W., Dixit, A., Fairs, A., Greenberger, P. A., Kariuki, B., Kita, H., and Kurup, V. P.: Fungi and allergic lower
respira-tory tract diseases, J. Allergy Clin. Immun., 129, 280–291, doi:10.1016/j.jaci.2011.12.970, 2012.
Li, X., Dong, Y., Dong, Z., Du, C., and Chen, C.: Observed changes in aerosol physical and optical properties before and after precipitation events, Adv. Atmos. Sci., 33, 931–944, doi:10.1007/s00376-016-5178-z, 2016.
Liebers, V., Raulf-Heimsoth, M., and Brüning, T.: Health effects due to endotoxin inhalation (review), Arch. Toxicol., 82, 203– 210, doi:10.1007/s00204-008-0290-1, 2008.
Lighthart, B., Shaffer, B. T., Marthi, B., and Ganio, L. M.: Artificial wind-gust liberation of microbial bioaerosols previously deposited on plants, Aerobiologia, 9, 189–196, doi:10.1007/BF02066261, 1993.
Lindemann, J., Constantinidou, H. A., Barchet, W. R., and Up-per, C. D.: Plants as sources of airborne bacteria, including ice nucleation-active bacteria, Appl. Environ. Microb., 44, 1059– 1063, 1982.
Loescher, W. H., Tyson, R. H., Everard, J. D., Redgwell, R. J., and Bieleski, R. L.: Mannitol Synthesis in Higher Plants Evi-dence for the Role and Characterization of a NADPH-Dependent Mannose 6-Phosphate Reductase, Plant Physiol., 98, 1396–1402, doi:10.1104/pp.98.4.1396, 1992.
MacHardy, W. E. and Gadoury, D. M.: Patterns of ascospore dis-charge by Venturia inaequalis, Phytopathology, 76, 985–990, 1986.
Madsen, A. M.: Airborne endotoxin in different background envi-ronments and seasons, Ann. Agr. Env. Med., 13, 81–86, 2006. Madsen, A. M., Frederiksen, M. W., Allermann, L., and Peitersen,
J. H.: (1 > 3)-β-d-glucan in different background environments and seasons, Aerobiologia, 27, 173–179, doi:10.1007/s10453-010-9178-7, 2011.
Marks, G., Colquhoun, J., Girgis, S., Koski, M. H., Treloar, A., Hansen, P., Downs, S., and Car, N.: Thunderstorm outflows pre-ceding epidemics of asthma during spring and summer, Thorax, 56, 468–471, doi:10.1136/thorax.56.6.468, 2001.
Matthias-Maser, S. and Jaenicke, R.: The size distribution of primary biological aerosol particles with radii > 0.2 µm in an urban/rural influenced region, Atmos. Res., 39, 279–286, doi:10.1016/0169-8095(95)00017-8, 1995.
McIntosh, M., Stone, B., and Stanisich, V.: Curdlan and other bac-terial (1 > 3)-β-D-glucans, Appl. Microbiol. Biot., 68, 163–173, doi:10.1007/s00253-005-1959-5, 2005.
Medeiros, P. M. and Simoneit, B. R.: Source profiles of organic compounds emitted upon combustion of green vegetation from temperate climate forests, Environ. Sci. Technol., 42, 8310– 8316, doi:10.1021/es801533b, 2008.
Medeiros, P. M., Conte, M. H., Weber, J. C., and Si-moneit, B. R.: Sugars as source indicators of biogenic or-ganic carbon in aerosols collected above the Howland Ex-perimental Forest, Maine, Atmos. Environ., 40, 1694–1705, doi:10.1016/j.atmosenv.2005.11.001, 2006.
Mircea, M., Stefan, S., and Fuzzi, S.: Precipitation scavenging co-efficient: influence of measured aerosol and raindrop size dis-tributions, Atmos. Environ., 34, 5169–5174, doi:10.1016/S1352-2310(00)00199-0, 2000.
rural and alpine air in Switzerland, Atmos. Environ., 29, 2565– 2573, doi:10.1016/1352-2310(95)94999-U, 1995.
Morris, C. E., Soubeyrand, S., Bigg, E. K., Creamean, J. M., and Sands, D. C.: Mapping rainfall feedback to reveal the potential sensitivity of precipitation to biological aerosols, B. Am. Meteo-rol. Soc., doi:10.1175/BAMS-D-15-00293.1, 2016.
Mueller-Anneling, L., Avol, J. M. P., and Thorne, P. S.: Ambient endotoxin concentrations in PM10from Southern California, En-viron. Health Perspect., 112, 583–588, 2004.
Murray, B., O’sullivan, D., Atkinson, J., and Webb, M.: Ice nu-cleation by particles immersed in supercooled cloud droplets, Chem. Soc. Rev., 41, 6519–6554, doi:10.1039/C2CS35200A, 2012.
Murray, B., Ross, J., Whale, T., Price, H., Atkinson, J., Umo, N., and Webb, M.: The relevance of nanoscale biological fragments for ice nucleation in clouds, Sci. Rep., 5, 8082, doi:10.1038/srep08082, 2015.
Nauta, M. and Hoekstra, R.: Evolution of reproductive systems in filamentous ascomycetes. I. Evolution of mating types, Heredity, 68, 405–410, doi:10.1038/hdy.1992.60, 1992.
Newson, R., Strachan, D., Archibald, E., Emberlin, J., Hardaker, P., and Collier, C.: Acute asthma epidemics, weather and pollen in England, 1987–1994, Eur. Respir. J., 11, 694–701, 1998. Niederberger, V., Pauli, G., Grönlundc, H., Fröschla, R., Rumpold,
H., Kraft, D., Valenta, R., and Spitzauer, S.: Recombinant birch pollen allergens (rBet v 1 and rBet v 2) contain most of the IgE epitopes present in birch, alder, hornbeam, hazel, and oak pollen: a quantitative IgE inhibition study with sera from dif-ferent populations, J. Allergy Clin. Immun., 102, 579–591, doi:10.1016/S0091-6749(98)70273-8, 1998.
Nilsson, S., Merritt, A., and Bellander, T.: Endotoxins in ur-ban air in Stockholm, Sweden, Atmos. Environ., 45, 266–270, doi:10.1016/j.atmosenv.2010.09.037, 2011.
Oberdörster, G., Oberdörster, E., and Oberdörster, J.: Nanotoxicol-ogy: an emerging discipline evolving from studies of ultrafine particles, Environ. Health Perspect., 113, 823–839, 2005. Oliveira, M., Ribeiro, H., Delgado, J., and Abreu, I.: The effects of
meteorological factors on airborne fungal spore concentration in two areas differing in urbanisation level, Int. J. Biometeorol., 53, 61–73, doi:10.1007/s00484-008-0191-2, 2009.
Packe, G. and Ayres, J.: Asthma outbreak during a thunderstorm, Lancet, 326, 199–204, doi:10.1016/S0140-6736(85)91510-7, 1985.
Pasanen, A.-L., Kasanen, J.-P., Rautiala, S., Ikäheimo, M., Rantamäki, J., Kääriäinen, H., and Kalliokoski, P.: Fungal growth and survival in building materials under fluctuating moisture and temperature conditions, Int. Biodeter. Biodegr., 46, 117–127, doi:10.1016/S0964-8305(00)00093-7, 2000.
Pavilonis, B. T., Anthony, T. R., O’Shaughnessy, P. T., Humann, M. J., Merchant, J. A., Moore, G., Thorne, P. S., Weisel, C. P., and Sanderson, W. T.: Indoor and outdoor particulate matter and endotoxin concentrations in an intensely agricultural county, J. Expo. Sci. Env. Epid., 23, 299–305, doi:10.1038/jes.2012.123, 2013.
Pöhlker, C., Huffman, J. A., and Pöschl, U.: Autofluorescence of atmospheric bioaerosols – fluorescent biomolecules and potential interferences, Atmos. Meas. Tech., 5, 37–71, doi:10.5194/amt-5-37-2012, 2012.
Pope, F.: Pollen grains are efficient cloud condensation nuclei, Env-iron. Res. Lett., 5, 044015, doi:10.1088/1748-9326/5/4/044015, 2010.
Rathnayake, C. M., Metwali, N., Baker, Z., Jayarathne, T., Thorne, P. S., O’Shaughnessy, P. T., and Stone, E. A.: Ur-ban enhancements of bioaerosol tracers in the Midwestern United States, J. Geophys. Res.-Atmos., 121, 5071–5089, doi:10.1002/2015JD024538, 2016.
Robertson, B. and Alexander, M.: Mode of dispersal of the stem-nodulating bacterium, Azorhizobium, Soil Biol. Biochem., 26, 1535–1540, doi:10.1016/0038-0717(94)90095-7, 1994. Rocklin, R. D., Clarke, A. P., and Weitzhandler, M.: Improved
long-term reproducibility for pulsed amperometric detection of carbo-hydrates via a new quadruple-potential waveform, Anal. Chem., 70, 1496–1501, doi:10.1021/ac970906w, 1998.
Rodriguez Rajo, F. J., Iglesias, I., and Jato, V.: Variation as-sessment of airborne Alternaria and Cladosporium spores at different bioclimatical conditions, Mycol. Res., 109, 497–507, doi:10.1017/S0953756204001777, 2005.
Rogge, W. F., Medeiros, P. M., and Simoneit, B. R.: Organic marker compounds in surface soils of crop fields from the San Joaquin Valley fugitive dust characterization study, Atmos. Environ., 41, 8183–8204, doi:10.1016/j.atmosenv.2007.06.030, 2007. Romantschuk, M.: Attachment of plant pathogenic bacteria to plant
surfaces, Annu. Rev. Phytopathol., 30, 225–243, 1992.
Rylander, R. and Lin, R.-H.: (1 > 3)-β-d-glucan – relationship to in-door air-related symptoms, allergy and asthma, Toxicology, 152, 47–52, 2000.
Schulthess, F. M. and Faeth, S. H.: Distribution, abundances, and as-sociations of the endophytic fungal community of Arizona fescue (Festuca arizonica), Mycologia, 569–578, doi:10.2307/376121, 1998.
Shaffer, B. T. and Lighthart, B.: Survey of culturable air-borne bacteria at four diverse locations in Oregon: ur-ban, rural, forest, and coastal, Microb. Ecol., 34, 167–177, doi:10.1007/s002489900046, 1997.
Shen, B., Jensen, R. G., and Bohnert, H. J.: Increased resistance to oxidative stress in transgenic plants by targeting mannitol biosynthesis to chloroplasts, Plant Physiol., 113, 1177–1183, doi:10.1104/pp.113.4.1177, 1997.
Simoneit, B. R., Elias, V. O., Kobayashi, M., Kawamura, K., Rushdi, A. I., Medeiros, P. M., Rogge, W. F., and Didyk, B. M.: Sugars dominant water-soluble organic compounds in soils and characterization as tracers in atmospheric particulate matter, Environ. Sci. Technol., 38, 5939–5949, doi:10.1021/es0403099, 2004.
Singer, B. D., Ziska, L. H., Frenz, D. A., Gebhard, D. E., and Straka, J. G.: Research note: Increasing Amb a 1 content in common ragweed (Ambrosia artemisiifolia) pollen as a function of rising atmospheric CO2concentration, Funct. Plant Biol., 32, 667–670, doi:10.1071/FP05039, 2005.
Singh, U., Reponen, T., Cho, K. J., Grinshpun, S. A., Adhikari, A., Levin, L., Indugula, R., and Green, B. J.: Airborne endotoxin andβ-D-glucan in PM1 in agricultural and home environments, Aerosol Air Qual. Res., 11, 376–386, 2011.