_____________________________
*)
Corresponding author
:
[email protected]
doi: 10.2298/SOS1603343M
UDK 669.018; 622.785
Amorphous-Crystalline Ni-Fe Powder Mixture: Hydrogenation
and Annealing Effects on Microstructure and Electrical and
Magnetic Properties
Radovan Milin
č
i
ć
1, Miroslav Spasojevi
ć
2*), Milica Spasojevi
ć
3*), Aleksa
Mari
č
i
ć
2, Siniša Randji
ć
21
Kapiolani Community College, University of Hawaii System, USA
2Joint Laboratory for Advanced Materials of SASA, Section for Amorphous Systems,
Faculty of Technical Sciences, University of Kragujevac,
Č
a
č
ak, Serbia
3
Faculty of Chemistry, University of Belgrade, Belgrade, Serbia
Abstract:
The hydrogenation of a crystalline Ni-Fe (80 wt.% Ni, 20 wt.% Fe) powder mixture leads to the formation of a mixture of Face Centered Cubic (FCC)-Ni and FCC-Fe phase nanocrystals embedded in an amorphous matrix. The magnetic susceptibility of the nanostructured powder is 2.1 times higher than that of the as-produced crystalline mixture. Heating in the temperature range 420-590 K causes structural relaxation in the hydrogenated powder, resulting in an increase of the magnetic susceptibility and a decrease of the electrical resistivity. During the heating procedure, the reorientation of magnetic domains in nickel and iron takes place in the temperature range 580-650 K and 790-850 K, respectively. In the pressed sample from the powder mixture, the crystallization of the amorphous phase of nickel and its FCC lattice crystalline grain growth occurs in the temperature range 620-873 K causing a decrease in the magnetic susceptibility of the nickel FCC phase and a sudden drop in the electrical resistivity. Prolonged heating of the mixed powders at 873K results in the formation of a Ni-Fe solid solution with higher magnetic susceptibility than the starting mixture.
Keywords: Nanostructured alloy, FCC phase, Specific electrical resistance, Magnetic susceptibility of powder
1. Introduction
Nanostructured nickel-iron alloys exhibit good electrical, magnetic, mechanical and corrosion resistance properties. Nickel-iron alloys are known for their good soft magnetic properties such as high permeability and low coercivity. Therefore, they are widely used in industrial applications such as inductor cores for electromagnets [1-3], magnetic devices [4], microwave noise filters [5], magnetic recording heads [6-8], and tunable noise suppressors [9]. More recently, these alloys are fabricated by sputtering [10-12] and electrodeposition [2, 3, 13-23] methods.
electrical properties [13, 17-20, 22, 24-31]. At temperatures lower than the crystallization temperature, structural relaxation takes place in the alloy, while heating to higher temperatures cause amorphous phase crystallization and growth of crystalline grains in the crystalline phase [13, 17-20, 22, 24-31].
The objective of this study was to develop a new method for the fabrication of nanostructured alloys relying on the hydrogenation of mixed crystalline nickel-iron powders, and examine the electrical and magnetic properties of as-produced alloys and alloys annealed at different temperatures.
2. Experimental
Iron (99.999 wt.%) and nickel (99.999 wt.%) powders with an average particle size of 12 m and 10 m, and an average crystallite size of 320 nm and 280 nm, respectively, were used in the experiment. The powder mixture Ni-Fe (80 wt.% Ni, 20 wt.% Fe) was prepared by mixing in the planetary ball mill at 50 rpm for 10 minutes. The Ni-Fe (80 wt.% Ni, 20 wt.% Fe) powder mixture was hydrogenated under hydrogen atmosphere at a pressure of 101.3 kPa and a temperature of 313 K.
Particle size measurements were carried out using a Leica Q 500 C automatic device for microstructural analysis.
The microstructure of the powder was evaluated by X-ray analysis. X-ray diffraction (XRD) was recorded with a Philips PW 1710 diffractometer using CuKα radiation ( = 0.154 nm) and a graphite monochromator. XRD data were collected with a step mode of 0.03° and a collection time of 1.5 s step-1. The X-ray patterns of as produced powder, hydrogenated powder and hydrogenated cooled powder after the first heating to 590 K and seventh to 873K were recorded.
Magnetization measurements were performed by means of a modified Faraday method based on the action of an inhomogeneous field on the magnetic sample. Magnetic force measurements were carried out with a sensitivity of 10-6 N in an argon atmosphere. The influence of annealing temperature on the magnetic properties of as produced and hydrogenated powder was examined. The heating rate of powder was 20 K min-1 and magnetic susceptibility was simultaneously measured. The temperature dependences of magnetic susceptibility of as produced powder and a sample of hydrogenated powder during heating to 873 K were examined. The second sample of hydrogenated powder was first heated to 590 K then cooled to 293 K and again heated to 800 K with the same heating rate. After the second cooling to 293 K, the sample was reheated to 850 K. This heating-cooling procedure was repeated four times and magnetic susceptibility was recorded simultaneously. Each run, the powder was cooled to 293 K and heated to 873 K. During the fourth, fifth and sixth heat treatment, upon reaching the maximum temperature of 873 K, the powder was kept at this temperature for 15 minutes and cooled thereafter.
The electrical properties of the powder mixture were investigated using 40 mm x 1.2 mm x 0.5 mm samples obtained by exposing the powders to a pressure of 120 MPa. Electrical resistivity was measured by the four-point method. The measurements were made under argon atmosphere. The temperature dependence of electrical resistivity was recorded during the heating of hydrogenated powder with the rate of 10 K min-1.
Differential scanning calorimetry (DSC) thermograms were obtained using a Shimadzu DSC-50 system at a heating rate of 20 K min-1 under pure nitrogen flow.
3. Results and discussion
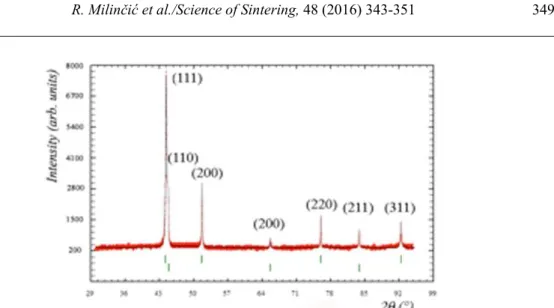
planes. The average crystallite size of iron was 320 nm and that of nickel 280 nm. The angle positions of the peaks in the diffraction pattern of the hydrogenated powder were the same as those of the as-prepared mixture, where the only difference was lower peak intensities and greater peak widths at half height. The average nanocrystal size of hydrogenated Fe and hydrogenated Ni was 20 nm and 15 nm, respectively.
Fig. 1. XRD pattern of the hydrogenated Ni80Fe20 powder mixture. Vertical lines represent positions of Bragg reflections: the first raw of lines corresponds to the position of the peaks for the FCC phase of the pure Ni, the second raw of lines to position of the peaks of the pure
Fe.
Hydrogenation causes the destruction of the crystal lattice and the formation of smaller crystal grains with a considerably greater minimal density of chaotically distributed dislocations and higher internal microstrains [32-34].
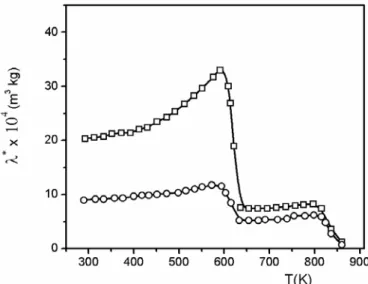
Fig. 2 shows the temperature dependence of the magnetic susceptibility of the pressed samples of as-produced and hydrogenated Ni80Fe20 powders.
Fig. 2. Temperature dependence of the magnetic susceptibility of ○ - as-produced powder, and □ – hydrogenated powder. Heating rate 20 K min-1.
hydrogenated powder is twice the magnetic susceptibility of the pressed as-prepared sample. Hydrogenation-induced microstructural changes cause alterations in the magnetic properties of the powder. The formation of smaller crystalline grains of the nickel and iron FCC phases leads to an increase in magnetic susceptibility. Smaller grains facilitate the orientation of some magnetic domains and also increase the mobility of walls of the already oriented domains [13, 17-20, 22, 24-30]. However, the higher density of chaotically distributed dislocations in the hydrogenated powder decreases the mobility of magnetic domain walls and hampers the orientation of these domains in the external magnetic field [13, 17-20, 22, 24-30]. The decrease in the average size of Ni and Fe FCC crystallites is considerably more effective in increasing the magnetic susceptibility of the powder compared to the effectiveness of increased density of chaotically distributed dislocations in decreasing the magnetic susceptibility. Therefore, hydrogenating the powder with a large grain size brings an increase in magnetic susceptibility.
Fig. 2 also shows that heating the powder to 580 K results in increased magnetic susceptibility due to structural relaxation. The increase in susceptibility is much higher for the hydrogenated powder since during structural relaxation the both phases of powder undergo a change to a higher degree of short-range order i.e. a greater decrease in the density of chaotically distributed dislocations and internal microstrains. The FCC-phase of hydrogenated powder has greater decrease in the density of chaotically distributed dislocations and internal microstrains than as produced powder. The abrupt decline in magnetic susceptibility when approaching the Curie temperature of nickel, in the temperature range 580-650 K, is the result of heat-induced reorientation of the magnetic domains in nickel. In the temperature range 650-790 K, the magnetic susceptibility slightly increases again due to the short-range structural ordering in the iron powder. At temperatures above 790°C, thermal energy allows reorientation of the magnetic domains in iron phase.
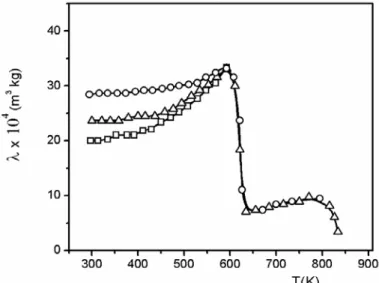
Fig. 3. Magnetic susceptibility of hydrogenated Ni80Fe20 powder as a function of temperature: □ - first heating to 590 K; ○ - second heating to 800 K, and ∆ – third heating to 850 K.
Heating rate 20 K min-1.
remains unchanged, which indicates that no substantial structural relaxation takes place in this temperature range. At temperatures ranging from 420 to 590 K, the magnetic susceptibility increases with increasing temperature, reaching its maximum at about 590 K. Upon heating to 590 K, the powder was cooled and an X-ray pattern was recorded. The X-ray pattern was identical to that of the hydrogenated, unannealed powder. This suggests that during heating to 590 K the powder does not undergo crystallization. The DSC thermogram presented in Fig. 5. also indicates that no amorphous phase crystallization takes place in the hydrogenated powder mixture during heating to 590 K.
Fig. 4. Magnetic susceptibility of hydrogenated Ni80Fe20 powder as a function of temperature:□ - fourth heating to 873 K; ○ - fifth heating to 873 K; ∆ - sixth heating to 873 K,
And ▽– seventh heating to 873 K. Heating rate 20 K min-1.
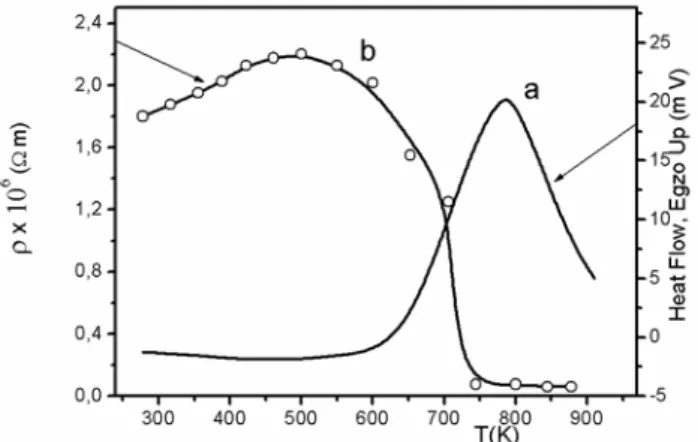
In the temperature range between 298 K and 420 K, the electrical resistivity of the pressed sample of the hydrogenated Ni80Fe20 powder increases linearly with increasing temperature (Fig. 5), indicating that no microstructural changes occur in this temperature range.
At temperatures starting from 420 K, as the temperature increases, electrical resistivity exhibits a lower rate of increase and reaches its maximum at 490K, Fig 5. With a further increase in temperature to 590 K, electrical resistivity decreases. This demonstrates that structural changes causing an increase in the electron density of states near the Fermi level occur in this temperature interval.
The plots presented in Figs. 3, 4, and 5 show that structural relaxation occurs in the powder mixture in the temperature range between 420 and 590°C.
Hydrogenation does not produce an ideal amorphous phase with a completely random distribution of spacings between adjacent atoms, but rather a phase with a larger or smaller degree of short-range ordering of atoms [29, 30]. Through the effect of thermal energy, during structural relaxation, both the amorphous and crystalline phases undergo short-range structural ordering. In the FCC phase, the density of chaotically distributed dislocations and internal microstrain values are decreased. With the thermal treatment, certain atoms located at higher energy levels cross energy barriers and reach lower energy levels. At these lower levels, their 3d and 4s orbitals overlap more effectively with the orbitals of neighboring atoms with the same symmetry properties, increasing in such a manner the values of the exchange integral and the electron density of states at the Fermi level [13, 17-20, 22, 24-30]. Also, the mean free path of electrons is increased. Then, the atoms arriving at lower energy levels adjoin the energetically most favorable magnetic domains. The lower density of chaotically distributed dislocations, upon short-range ordering, facilitates the mobility of magnetic domain walls and domain orientation in the external magnetic field [13, 17-20, 22, 24-30]. All these changes increase the magnetic susceptibility of the powder.
The increase in the electron density of states in the conduction band, the increase in the mean free path of electrons and the more uniform orientation of dipole moments of some nanoparticles induced by the short-range ordering reduce the temperature coefficient of electrical resistivity in the temperature range between 420 and 590 K [13, 17-20, 22, 24-31].
The magnetic susceptibility obtained during the third heating run in the temperature range 298-590 K has lower values than during the second heating run. In the temperature range 600-750 K, the electrical resistivity decreases abruptly (Fig. 5). These changes are due to the amorphous phase crystallization of the nickel powder. The crystallization of the nickel amorphous phase is indicated by the following facts: a) in the temperature range 600-900 K, the peak in the thermogram of the hydrogenated pure nickel powder is identical to that in the thermogram of the hydrogenated Ni-Fe powder mixture; b) during the third and fourth heating runs, magnetic susceptibility does not differ significantly in the temperature range of 650 to 850 K. This fact occurs since the magnetic properties of the mixture in this range are determined only by the iron powder properties. It is since because the temperature of the observed range is higher than the Curie temperature of nickel. And c) in the temperature range between 298 and 590 K, magnetic susceptibility is lower during the third heating run than during the second since the amorphous phase crystallization resulted in the formation of larger crystalline grains of nickel which are hampering the orientation of magnetic domains and reduce the mobility of their walls.
The diagrams in Fig. 4. show that: a) in the temperature ranges 298-590 K and 650-830 K, magnetic susceptibility is highest during the seventh annealing and lowest during the fourth annealing. This indicates that annealing at higher temperatures results in the formation of a solid solution of iron and nickel with magnetic susceptibility higher than that of pure iron and pure nickel. The emergence of wave forms in the temperature range 650-830 K on the curves obtained during the fifth, sixth and seventh heating runs suggests the existence of magnetic domains in the solid solution of iron and nickel of different thermal stability. This is due to the existence of crystals of the solid solution of iron and nickel of different chemical composition formed by a relatively slow diffusion of atoms of these metals during annealing.
Fig. 6. XRD pattern of the nickel-iron powder mixture Ni80Fe20 recorded after the seventh heat treatment. Vertical lines represent angle positions of Bragg reflections: the first raw of lines corresponds to the position of the peaks for the FCC phase of the solid solution of Fe in Ni,
the second line to position of the peaks of the pure Fe.
4. Conclusion
The hydrogenation of a crystalline Ni-Fe (80 wt.% Ni, 20 wt.% Fe) powder mixture leads to the formation of a mixture of nanocrystalline Fe and Ni powders with crystals of average size 10 nm and 15 nm, respectively, embedded in an amorphous matrix. The magnetic susceptibility of the hydrogenated nanocrystalline powder is 2.1 times higher than that of the as-produced crystalline powder. Heating in the temperature range 420-590 K induces structural relaxation in the powders involving short-range structural ordering and a decrease in the density of chaotically distributed dislocations and internal microstrain, resulting in the increased magnetic susceptibility and decreased electrical resistivity. With the thermal treatment, when approaching the Curie temperature of nickel, magnetic domains in nickel are reoriented in the temperature range 580-650 K. In iron, structural relaxation takes place over the temperature range 650-790 K, and heat-induced magnetic domain reorientation occurs in the range 790-850 K. The crystallization of the amorphous phase of nickel and its FCC crystalline grain growth takes place in the temperature range 620-873 K, and causes a decrease in the magnetic susceptibility of the nickel FCC phase and an abrupt decrease in the electrical resistivity of the pressed sample. After prolonged heating at 873 K, a notable amount of solid solution Ni-Fe was obtained. This solid solution had higher magnetic susceptibility than the starting unannealed mixture.
Acknowledgments
The authors acknowledge the financial support provided by the Ministry of Education and Science of the Republic of Serbia through Project Ref. No. 172057.
5. References
2. T. Dastagir, W. Xu, S. Sinka, H. Wu, Y. Cao, H. Yu, Appl. Phys. Lett. 97 (2010) 162 506.
3. T. O’Donnell, N. Wang, S. Kulkarni, R. Meere, F. M. F. Rhen, S. Roy, S. C. O’Mathuna, J. Magn. Mater. 322 (2010) 1690.
4. O. Song, C. A. Ballentine, R. C. O’Handley, Appl. Phys. Lett. 64 (1994) 2593. 5. C. Jiang, D. Xue, W. Sui, Thin Solid Films 519 (2011) 2527.
6. E. I. Cooper, C. Bonhote, J. Heidmann, Y. Hsu, P. Kern, J. W. Lam, M. Ramasubramanian, N. Robertson, L. T. Romanikiw, I. B. M. J. Res. Dew. 49 (2005) 103.
7. B. Koo, B. Joo, Surf. Coat. Technol. 205 (2010) 740.
8. T. Osaka, T. Asaki, J. Kowaji, T. Yokoshima, Electrochim. Acta 50 (2005) 4576. 9. B. K. Kuanr, R. Marson, S. R. Mishra, A. V. Kuanr, R. E. Camley, Z. J.
Celinski, J Appl. Phys. 105 (2009) 07A520.
10. J. Vernieres, J. F. Bobo, D. Prost, F. Issac, F. Boust, J. Appl. Phys. 109 (2011) 07A323.
11. M. Vronbei, Y. Zhuang, B. Rejaei, J. Burghartz, J. Magn. Magn. Mater. 258-259 (2003) 167.
12. M. Ueno, S. Tanoue, J. Vac. Sci. Technol. A 13 (1995) 2194.
13. Z. Vuković, P. Spasojević, M. Plazinić, J. Živanić, M. Spasojević, J. Optoelectron. Adv. Mater., 16, 985 (2014).
14. L. Ribić-Zelenović, M. Spasojević, A. Maričić, Mater. Chem. Phys., 115, 347 (2009).
15. M. Spasojević, L. Ribić-Zelenović, A. Maričić, Sci. Sinter., 43, 313, (2011). 16. M. Donten, H. Cesiulis, Z. Stojek, Electrochim. Acta, 45, 3389 (2000).
17. M. Spasojević, N. Ćirović, L. Ribić-Zelenović, P. Spasojević, A. Maričić, J. Electrochem. Soc. 161(10) D463-D469 (2014).
18. L. Ribić-Zelenović, M. Spasojević, A. Maričić, M. M. Ristić, Sci. Sinter., 41, 175 (2009).
19. F. He, J. Yang, T. Lei C. Gu, Appl. Surf. Sci, 253, 7591 (2007).
20. M. Spasojević, L. Ribić-Zelenović, A. Maričić, P. Spasojević, Powd. Techn., 254, 439 (2014).
21. S. J. Mun, M. S. Kim, T. H. Yim, J. H. Lee, T. Kang, J. Electrochem. Soc., 157, D 177 (2010).
22. M. Spasojević, L. Ribić-Zelenović, N. Ćirović, P. Spasojević, A. Maričić, Sci. Sinter., 44, 197 (2012).
23. L. Ribić-Zelenović, N. Ćirović, M. Spasojević, N. Mitrović, A. Maričić, V. Pavlović, Mater. Chem. Phys., 135, 212 (2012).
24. O. Pešić, M. Spasojević, B. Jordović, P. Spasojević, A. Maričić, Sci. Sinter. 46, 117 (2014).
25. L. Ribić-Zelenović, L. Rafailović, M. Spasojević, A. Maričić, Phys. B, 403, 2148 (2008).
26. G. Herzer, IEEE Trans. Magn., 25, 3327 (1989). 27. J. D. Bernal, Nature, 185, 68 (1960).
28. N. Ćirović, P. Spasojević, L. Ribić-Zelenović, P. Mašković, A. Maričić, M. Spasojević, Sci. Sinter., 48, 1, (2016).
29. K. E. Heusler, D. Huerta, J. Electrochem. Soc., 136, 65 (1989). 30. M. Donten, J. Solid State Electrochem., 3, 87 (1999).
31. K. Nouneh, I. V. Kittyk, R. Viennois, S. Benet, K. J. Plucinski, S. Charar, Z. Golacki, S. Paschen, J. Phys. D: Appl. Phys. 38, 965 (2005).
33. P. Sofronis et al., Hydrogen Effects on Material Behavior and Corrosion Deformation Interactions, ed. N.R. Moody et al. (Warrendale, PA: TMS, 2003), 537-548.
34. Ervin Tal-Gutelmacher, Dan Eliezer, The Journal of The Minerals, Metals, Materials Society, 57, 46-49 (2005).
_________________________________________________________________________
Са р а:Х 80 .% Ni 20 .% Fe ј
ј FCC FCC ђ ј
. Н 2.1
. З ј 420 590 K
ј ј ј ј
. Д ј ј ,
ј ј
580 680 К, ђ 790 850 К. К ј
FCC , ј ј ј
620 873 К ј FCC
. Д
873 К ђ ј
.
К учн р чи: , FCC , ,
© 2016 Authors. Published by the International Institute for the Science of Sintering. This article is an open access article distributed under the terms and conditions of the Creative Commons — Attribution 4.0 International license