www.atmos-chem-phys.org/acp/3/1807/
Chemistry
and Physics
Cirrus cloud occurrence as function of ambient relative humidity: a
comparison of observations obtained during the INCA experiment
J. Str¨om1, M. Seifert1, B. K¨archer2, J. Ovarlez3, A. Minikin2, J.-F. Gayet4, R. Krejci1, A. Petzold2, F. Auriol4, W. Haag2, R. Busen2, U. Schumann2, and H. C. Hansson1
1ITM, Air Pollution Laboratory, Stockholm University, Sweden 2DLR, Institut f¨ur Physik der Atmosph¨are, Oberpfaffenhofen, Germany 3LMD, Ecole Polytechnique, CNRS-IPSL, Palaiseau, France
4LAMP, Universit´e Blaise Pascal, Aubiere, France
Received: 24 March 2003 – Published in Atmos. Chem. Phys. Discuss.: 30 June 2003 Revised: 30 September 2003 – Accepted: 15 October 2003 – Published: 27 October 2003
Abstract. Based on in-situ observations performed during the Interhemispheric differences in cirrus properties from an-thropogenic emissions (INCA) experiment, we introduce and discuss the cloud presence fraction (CPF) defined as the ra-tio between the number of data points determined to rep-resent cloud at a given ambient relative humidity over ice (RHI) divided by the total number of data points at that value of RHI. The CPFs are measured with four different cloud probes. Within similar ranges of detected particle sizes and concentrations, it is shown that different cloud probes yield results that are in good agreement with each other. The CPFs taken at Southern Hemisphere (SH) and Northern Hemi-sphere (NH) midlatitudes differ from each other. Above ice saturation, clouds occurred more frequently during the NH campaign. Local minima in the CPF as a function of RHI are interpreted as a systematic underestimation of cloud pres-ence when cloud particles become invisible to cloud probes. Based on this interpretation, we find that clouds during the SH campaign formed preferentially at RHIs between 140 and 155%, whereas clouds in the NH campaign formed at RHIs somewhat below 130%. The data show that interstitial aerosol and ice particles coexist down to RHIs of 70–90%, demonstrating that the ability to distinguish between differ-ent particle types in cirrus conditions depends on the sensors used to probe the aerosol/cirrus system. Observed distribu-tions of cloud water content differ only slightly between the NH and SH campaigns and seem to be only weakly, if at all, affected by the freezing aerosols.
Correspondence to:J. Str¨om (johan@itm.su.se)
1 Introduction
There is a concern that anthropogenic emissions may change the environment in a way that it could influence the fre-quency of occurrence and microphysical properties of cir-rus clouds. An obvious anthropogenic modification of the cloud frequency of occurrence are contrails formed behind aircraft near the tropopause. Based on analyzed satellite data, Mannstein et al. (1999) and Meyer et al. (2002) deduced that linear persistent contrails cover about 0.5–0.7% of the sky at noon over Europe in the annual average. These results ex-emplify the possible regional effect by contrails (IPCC 1999, EC 2002).
Besides this direct contrail effect, observations indicate that indirect aerosol effects may influence the properties of high clouds as well (Str¨om and Ohlsson, 1998; Boucher, 1999; Kristensson et al., 2000). A pronounced indirect aerosol effect on cirrus is possible when at least two types of freezing aerosol particles compete during cloud formation (K¨archer and Lohmann, 2003): adding efficient ice nuclei to liquid aerosol particles can lead to a marked suppression of pristine ice crystal number densities, the magnitude of this effect depending on updraft speed, temperature, and number and freezing properties of the ice nuclei.
volves the detection of subtle but systematic differences be-tween the properties of clouds formed in a pristine environ-ment and those formed in a perturbed environenviron-ment. The pos-sible anthropogenic influence on warm clouds has been stud-ied extensively and covers a range of environmental condi-tions in both hemispheres. However, until recently all in-situ measurements of midlatitude cirrus had been performed in the Northern Hemisphere. With the project INCA (In-terhemispheric differences in cirrus properties from anthro-pogenic emissions) the first observations of cirrus properties in the Southern Hemisphere midlatitudes became available, allowing clouds that formed under comparable meteorolog-ical conditions in two very different regions of the world to be compared with each other with an identical set of in situ instruments.
Two aircraft campaigns were performed as part of INCA, one in the Southern Hemisphere (SH) and one in the North-ern Hemisphere (NH) midlatitudes. Here the abbreviations SH and NH are used to identify the different campaigns and do not refer to hemispherically averaged properties. The first campaign based in Punta Arenas, Chile (54◦S) was per-formed in March and April. The second campaign based in Prestwick, Scotland (55◦N) was performed in Septem-ber and OctoSeptem-ber. Hence, the campaigns were performed in equivalent seasons in the same year 2000. For more in-formation about the INCA experiment we refer to: http: //www.pa.op.dlr.de/inca/.
One of the first results published from INCA was a com-parison of distributions of relative humidity over ice (RHI) observed during the two campaigns (Ovarlez et al., 2002). Both data sets presented a maximum in the frequency distri-bution around 100%, but the distridistri-bution was skewed towards higher humidities in the SH data. In the present study, we in-vestigate whether differences in the distributions of RHI are related to differences in cirrus cloud properties by compar-ing the occurrence of clouds as a function of RHI observed during the two campaigns. For this purpose, we define cloud occurrence as the ratio between the number of in-cloud data points versus all data points at any given RHI and call this ratio the cloud presence fraction (CPF). A substantial part of the paper deals with the question of how to decide whether a data point represents cloudy or cloud-free air.
2 Methodology
Although a cloud is something known to everyone, it may sometimes be difficult or even impossible to provide a simple definition for when a cloud is actually present or not. What is the minimum crystal number density or horizontal and verti-cal extent necessary for an ensemble of hydrometeors to be called a cloud? Is a 1 m thick layer or a particle number den-sity of 1 m−3sufficient? We can raise similar questions for observable parameters obtained by in-situ or remote sensing
non-presence of a cloud is usually determined by the detec-tion limit of the particular sensor used to observe the cloud. What is interpreted as a cloud by one sensor might be inter-preted as cloud-free air by another.
2.1 Description of the cloud probes
In this study we will make use of four different cloud sen-sors to investigate the presence or non-presence of cirrus clouds as function of ambient relative humidity. These in-struments are the Counterflow Virtual Impactor (CVI), the PMS FSSP-300, the PMS 2D-probe, and the Polar Neph-elometer. The same instruments were used in both INCA campaigns, which permits a direct comparison of the obser-vations with respect to an unchanged payload configuration. The afomentioned cloud probes were mounted on the re-search aircraft Falcon operated by Deutsches Zentrum f¨ur Luft- und Raumfahrt (DLR). All probes have different ad-vantages and limitations and provide information about dif-ferent aspects of the cloud, as explained below. With the term “cloud particles” used hereafter we mean “particles mea-sured in the presence of cirrus clouds”.
The CVI (Ogren et al., 1985; Str¨om et al., 1994) has its inlet facing the direction of flight and operates by using an internal flow opposite the flight direction to prevent ambient air and small particles to enter the probe. In the upper tro-posphere and at typical Falcon airspeeds of∼180 m s−1, this lower cut-off is approximately 5µm aerodynamic diameter. Cloud particles with these and larger sizes are mostly ice crystals, especially at the high total number concentrations (>0.1 cm−3) typically found in young cirrus clouds. The crystals entering the CVI are evaporated and their residues are counted using condensation particle counters. A one-to-one correspondence between the number of residual particles and ice crystals is assumed, which is proven to be a valid as-sumption (Seifert et al., 2003b). The total particle number density captured by the CVI is an accurate measure of the to-tal number density of ice crysto-tals in young cirrus clouds. At 1 Hz data resolution, one count registered by the CVI pay-load corresponds to an ambient crystal number density of ∼0.0004 cm−3(CVI detection limit).
x
2
Relative humidity over water
100
Cloud presence fraction
1
x
1
Relative humidity over ice
100
Cloud presence fraction
1
x
3
x
2
x
1
x
3
a)
b)
Fig. 1.Schematic illustration of the cloud presence fraction as a function of the relative humidity for liquid clouds(a)and ice clouds(b). All
data points above X1are in-cloud data points. The point where clouds start to dissolve and where cloudy and non-cloudy air parcels coexist
is marked X2and the point where the cloud has completely disappeared is marked X3.
The PMS 2D-probe classifies the size of particles by the shadow they create when passing in front of an array of de-tectors illuminated by a laser. The particles are classified into 30 bins in the diameter range 25–800µm. Cloud particles in this size range are exclusively water ice crystals, based on their large condensed mass. Because such large ice crystals are usually not spherical, a number of assumptions are intro-duced to convert from raw data to size distributions (Gayet et al., 1993). Most of the cloud water content (CWC) is lo-cated in the size range of the 2D-probe. The ambient crystal number density corresponding to one count registered by the 2D-probe depends on the crystal size, but typically the min-imum detectable number density is of the order 10−6cm−3 (2D-probe detection limit).
The Polar Nephelometer measures the scattering phase function of an ensemble of cloud particles in the size range from a few µm to about 800µm diameter (Gayet et al., 1997), i.e., essentially ice crystals. A laser beam at a wave-length of 804 nm illuminates the ice crystals near the focal point of a paraboloidal mirror. The scattered light is de-tected by 44 photodiodes in angles from±3.49 to ±169◦. The direct measurement of the scattering phase function pro-vides the means to distinguish between solid and liquid (if present) phase hydrometeors and to calculate the extinction coefficient and asymmetry parameter (Auriol et al., 2001). The Polar Nephelometer provides an optical response (vol-ume extinction) that depends on the combined effect of ice crystal size and number density.
2.2 Relative humidity and cloud presence fraction
Relative humidity was measured using a cryogenic frost point mirror (Ovarlez and van Velthoven, 1997). The un-heated inlet, a modified Rosemount-Goodrich temperature housing, was located on the top of the fuselage. The relative
humidity is determined from the Sonntag saturation vapor pressure formula (Sonntag, 1994), using the air temperature data provided by the standard instrumentation on board the Falcon. The relative uncertainty in observed relative humid-ity is estimated to be better than 7% (2 standard deviations). The expected CPF as function of relative humidity over supercooled liquid water for warm clouds consisting of su-percooled water droplets is illustrated in Fig. 1a. Such clouds form and disappear at essentially the same relative humidity marked X1and X2. Actually, a small supersaturation,
typi-cally a fraction of a percent, is necessary to activate aerosol particles into cloud droplets. However, within measurement capabilities of relative humidity, the CPF can be approxi-mated as unity at and above water saturation and zero at hu-midities below. Solution droplets may be in equilibrium with ambient water vapor even at relative humidities well below 100%. These particles are not activated into cloud droplets in the traditional sense.
Ice clouds are more complicated than their liquid counter-parts since they may form at one RHI substantially (many tens of percent) above saturation and dissolve completely at much lower (few tens of percent) values below saturation; see Sect. 3. The rate at which water molecules are transferred between the different phases at cold temperatures is slower than in warm clouds, which is why a cirrus cloud can per-sist for some time in air subsaturated with respect to ice and give rise to their often fuzzy appearance especially around cloud edges. A possible scenario is illustrated in Fig. 1b. At some relative humidity over ice, X1, ice crystals appear
a)
b)
0 50 100 150
0.01 0.1
F
rac
ti
on of
in-c
loud data point
s
SH
RHI (%)
FSSP-300 CVI Model
0 50 100 150
0.01 0.1
F
rac
ti
on of in-c
lou dat
apoint
s
N
H
RHI (%)
FSSP-300 CVI Model
Fig. 2. Observed cloud presence fractions as a function of relative humidity over ice using similar detection thresholds for the two probes
(CVI: red curves, FSSP-300: black curves) with respect to particle size (>4µm) and number density (>0.3 cm−3). Data from the SH
campaign(a)and from the NH campaign(b). The blue curves are corresponding model results taken below ice saturation and exclusively
count ice crystals.
the presence or non-presence of the cloud and the CPF=1 at X1and humidities above. At X2(near ice saturation), CPF
is less than unity since this point represents a mixture be-tween air parcels that contain cloud particles and where the humidity is perhaps decreasing, and air parcels that have not yet formed a cloud and where the humidity might still be in-creasing. To the left of X2(below ice saturation), ice crystals
begin to evaporate. Once below saturation, all clouds will eventually have disappeared at some humidity X3. Because
of the slower evaporation processes in cold clouds the rela-tive humidity at X3is different from X2. The details about
X1, X2and X3for cirrus clouds are not well known.
3 Observations
Our study is limited to observations performed above 6 km altitude and temperatures below 235 K. Under these con-ditions, clouds will consist of ice crystals and interstitial aerosol particles (sometimes referred to as supercooled haze droplets), as liquid water droplets would freeze sponta-neously. Although the different cloud probes are based on different working principles and have different detection lim-its, as summarized in Sect. 2.1, it is interesting to compare the consistency between the probes for a subset of the data where there is an overlap in cloud detection. The FSSP-300 is able to detect clouds when particles are smaller than the aerodynamic cut-off of the CVI, but the CVI is able to detect clouds with a much lower particle number density than the FSSP-300 is capable of. If a subset of the FSSP-300 data is selected to emulate a CVI with respect to the size cut-off, and a subset of the CVI data is selected to emulate the FSSP-300
with respect to the number density detection limit, the two instruments should detect clouds with similar efficiency. 3.1 Transition between clouds and cloud-free air
Figure 2 shows observed CPFs as a function of RHI from both INCA campaigns (SH in Fig. 2a and NH in Fig. 2b) taken with the CVI (red curves) and the FSSP-300 (black curves). To enable a direct comparison, we have used sim-ilar detection thresholds for both instruments: particle size >4µm and particle concentration>0.3 cm−3. Given these thresholds, we expect the detected particles to be mostly ice crystals, as such high number densities of large aerosol parti-cles are hardly found in cirrus levels (K¨archer and Solomon, 1999). For example, in situ measurements over continental Europe revealed the presence of coarse-mode aerosol in the tropopause region, but only at low concentrations (Schr¨oder et al., 2002, their Fig. 3b). The measured CPFs show more structure than suggested by the schematic in Fig. 1b. We ob-serve a plateau region between 90–130% (NH) and 90–150% (SH), a transition region between 70–90%, and a dry region <70%.
a)
b)
0 20 40 60 80 100 120 140 160 180 0.0
0.2 0.4 0.6 0.8 1.0
F
rac
ti
on of
in-c
loud
dat
a point
s
SH
RHI(%)
PMS-2D 25 µm PMS-2D 100 µm Model
0 20 40 60 80 100 120 140 160 180 0.0
0.2 0.4 0.6 0.8 1.0
F
rac
ti
on of
in-c
loud
dat
a pint
s
NH
RHI (%)
PMS-2D 25 µm PMS-2D 100 µm Model
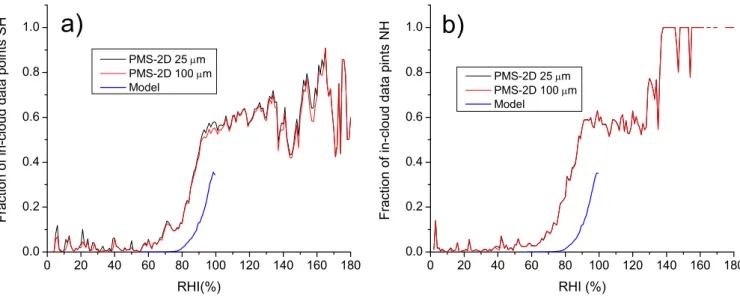
Fig. 3.Cloud presence fractions as a function of relative humidity over ice for different ice crystal size thresholds (black curves: 25µm; red
curves: 100µm) as measured by the PMS-2D probe (concentration threshold 10−6cm−3). Data from the SH campaign(a)and from the
NH campaign(b). Black and red curves in Fig. 5b are almost identical. The blue curves are corresponding model results taken below ice
saturation and exclusively count ice crystals>25µm and>10−6cm−3.
crystals in the ambient air. Although their working princi-ples are completely different, Fig. 2 proves that the two in-struments perform as expected within at least the overlapping range in particle number density and size.
In Fig. 3 the CPFs derived from the 2D-probe are plot-ted using two cloud presence size thresholds (25µm and 100µm, respectively), as obtained during the SH (Fig. 3a) and NH campaign (Fig. 3b). In each data set, the two curves are essentially on top of each other, indicating that whenever ice crystals larger than 25µm are present in the cloud, crys-tals of sizes larger than 100µm are present as well.
The CPF distributions shown in Fig. 3 share many fea-tures of those shown in Fig. 2. As for the CVI and FSSP-300 probes, we observe a plateau in CPF at RHI between about 90–140% and a rapid decrease of CPF around 80%. However, for RHI<70%, the CPFs drop almost to zero in the case of the 2D-probe, strongly indicating that ice crystals with sizes>25µm do not anymore exist under such subsat-urations, while there seem to be values of CPF>0 in the case of the CVI and FSSP-300 probes shown in Fig. 2, especially in the NH data set. We reiterate this issue later in Sect. 3.2.
In what follows, we compare the findings shown in Figs. 2 and 3 with model simulations described in full detail by Haag et al. (2003), whose principal goal is to infer freezing thresh-olds and nucleation modes from the observed distributions of RHI above ice saturation. Here, it is sufficient to note that the microphysical trajectory model roughly captures the typ-ical environmental conditions (temperatures, cooling rates, mesoscale wave amplitudes and frequencies) that prevailed during the NH and SH campaigns and uses a fairly detailed
microphysical scheme to predict the formation and disap-pearence of cirrus clouds. The prescribed aerosol freezing properties provide a consistent explanation of the SH data in terms of homogeneous freezing, and of the NH data in terms of homogeneous freezing competing with a small number of efficient ice nuclei (cases HOM and MIX0.001 of Haag et al. (2003), respectively).
We present model-derived CPFs computed from the dis-tributions of RHI inside and outside of cirrus clouds. The calculated CPFs do not include aerosol particles, in contrast to the observations that make no distinction between these two types of particles. They are plotted as blue curves in Figs. 2 and 3, using the same criteria to define cloud as in the observations with the CVI/FSSP-300 and 2D-probe, re-spectively. The model curves show the same characteristic transition regime as the measurements at roughly comparable RHIs (see below). The reason for the strong decrease of CPF in the model is that the evaporation of water molecules from the ice crystals is kinetically limited. The time needed to (al-most) completely evaporate water from ice crystals can be longer than the time in which air parcels experience (signif-icant) subsaturation due to warming, especially at low tem-peratures and in the presence of temperature oscillations.
Although the model curves are very similar for the SH and NH cases, they seem to be shifted to the right compared to the observations. We offer four explanations to this apparent discrepancy.
0 20 40 60 80 100 120 140 160 180 0.0
0.2 0.4 0.6 0.8 1.0
Fraction of in-cloud data points NH
RHI (%) 0.001 cm-3
0.003 0.01 0.03 0.1 0.3 1 3
0 20 40 60 80 100 120 140 160 180 0.0
0.2 0.4 0.6 0.8 1.0
Fraction of in-cloud data points SH
RHI (%) 0.001 cm-3
0.003 0.01 0.03 0.1 0.3 1 3
a)
b)
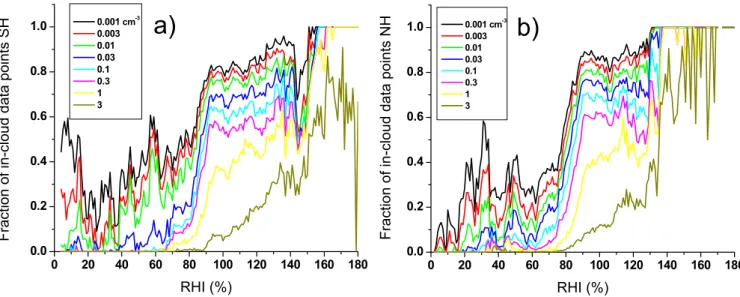
Fig. 4.Cloud presence fractions as a function of relative humidity over ice for different particle number density thresholds (color code given
in the legend) as measured by the CVI. Data from the SH campaign(a)and from the NH campaign(b).
those taken inside clouds. Hence, the shifts may in part be artifacts, because this ratio will not be exactly repro-duced by the model at any given RHI, and the model CPFs need to be re-scaled as a function of RHI in order to be directly comparable to the observations.
2. The physics of the ice-to-aerosol transition in the model is incomplete. In the current version of the code, we track the ice water mass and compare it with the equilib-rium water mass aerosol particles with the same average core (sulfuric acid) mass as contained in these crystals would have at the local thermodynamic conditions. If the ice water mass falls below that value, we remove the corresponding ice particles and reinitialize the aerosol size distribution. A single particle treatment and very small time steps would improve the calculation; more importantly, the chemistry of melting of the ice parti-cles and their chemical composition besides water is not known and does not justify a more detailed description. 3. Small-scale turbulent mixing and entrain-ment/detrainment processes may affect the evaporation time of small ice crystals but are not represented in the model.
4. The experimental concentration and size thresholds for cloud presence prescribed in the calculations may not be accurate, as we find that the modeled transition region is sensitive to changes in the concentration threshold. While above the points have no impact on the results pre-sented by Haag et al. (2003), they may at least in part help reconcile data and model results, but important uncertainties
remain concerning the evaporation kinetics of small ice crys-tals.
3.2 Variation of cloud detection thresholds
0 20 40 60 80 100 120 140 160 180 0.0
0.2 0.4 0.6 0.8 1.0
Fraction of in-clou
d
data points SH
RHI (%)
0.6-15.8 µm 0.7-15.8 0.9-15.8 1.1-15.8 3.1-15.8 3.7-15.8 6.4-15.8 8.5-15.8 12.7-15.8
0 20 40 60 80 100 120 140 160 180 0.0
0.2 0.4 0.6 0.8 1.0
Fraction of in-cloud data points NH
RHI (%)
0.6-15.8 µm 0.7-15.8 0.9-15.8 1.1-15.8 3.1-15.8 3.7-15.8 6.4-15.8 8.5-15.8 12.7-15.8
a)
b)
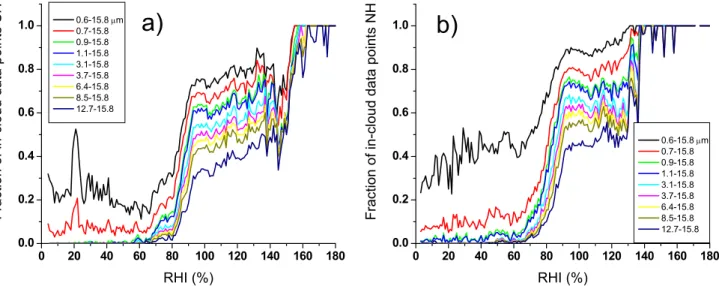
Fig. 5. Cloud presence fractions as a function of relative humidity over ice for different particle size thresholds (color code given in the
legend) as measured by the FSSP-300. Data from the SH campaign(a)and from the NH campaign(b).
We will use data from the CVI to study in more detail the presence or non-presence of clouds based on different num-ber density thresholds, and the FSSP-300 using different size thresholds. In Fig. 4 CPF is plotted versus RHI using dif-ferent number density thresholds from the CVI for the SH (Fig. 4a) and NH (Fig. 4b) campaign, respectively. For all but the highest threshold (3 cm−3) there is a sharp drop in CPF
between 70–90% RHI, marking the transition region between cloudy and cloud-free air, as motivated in Sect. 3.1.
In the plateau region between 90% and 130% (NH) or 150% (SH), the CPF increases with increasing sensitivity (decreasing concentration threshold) to measure cloud par-ticles which are essentially ice crystals given the lower size cut-off of the CVI. Note that the CPFs from both data sets become rather small for the highest concentration threshold (3 cm−3) and do not even reach unity at the highest RHI. This is explained by the fact that we now begin to miss most of the ice crystals, because the threshold of 3 cm−3is of the same order as the average total number of ice crystals observed in cirrus during both INCA campaigns (K¨archer and Str¨om, 2003).
In the dry region, RHI<70%, CPF is almost zero for con-centration thresholds>0.3 cm−3, indicating that cloud parti-cles (i.e., either aerosol or ice partiparti-cles) with sizes>5µm are not present with such high number densities. As discussed in Sect.3.1, it is not entirely clear from the data how far away from the transition region towards low RHI ice crystals may still exist (and form a “cloud”). To say at which RHI an ice crystal becomes an aerosol particle is difficult; at any rate, the fraction of aerosol particles will certainly increase with de-creasing RHI. Consequently, as we relax the threshold con-centration to values<0.3 cm−3, the CVI detects large aerosol particles down to very dry conditions in up to∼40% of all measurements at concentration thresholds<0.01 cm−3.
In Figs. 5a and b CPF is plotted using different size thresh-olds from the FSSP-300 for the SH and NH data set, re-spectively. In selecting the size thresholds, we have used the available size bin classifications and do not distinguish between different particles types, i.e., dry particles, haze droplets, or ice crystals.
The principal features of CPF are similar to Fig. 4. In particular, the transition region is located around 80% RHI, as before. However, given the detection limit of 0.2 cm−3, we are mostly detecting ice particles with the FSSP-300 when using the size thresholds>3.7–6.4µm. Using lower size cut-offs results in the enhanced detection of (interstitial) aerosol particles and ice crystals, and makes the interpretation of the curves as true cloud presence fractions more difficult.
A notable difference between the NH and SH data sets oc-curs in the dry region between the size thresholds 0.6µm and 0.7µm. During the NH campaign particles in the size range 0.6–0.7µm was present twice as often as during the SH cam-paign. This perhaps indicates a difference in the presence of ice nuclei between the two measurement locales or a differ-ence in evaporation kinetics.
3.3 Onset of freezing in cirrus clouds
In Fig. 6, cloud data points are defined as having an extinc-tion coefficient of 0.05 km−1 or larger as measured by the
0 20 40 60 80 100 120 140 160 180 0
20 40 60 80 100
Fraction of
in-cloud data points
RHI (%)
NH SH
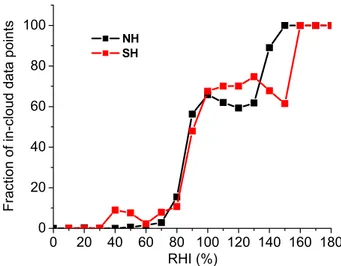
Fig. 6.Cloud presence fractions as a function of relative humidity
over ice measured by the Polar Nephelometer. If the probe, at a
given RHI, observes an extinction coefficient exceeding 0.05 km−1
during four consecutive seconds, the data point is considered a cloudy data point. This criterion roughly corresponds to particle
size and concentration thresholds of 5µm and 0.05–0.1 cm−3,
re-spectively, indicating that mostly ice crystals are detected. Only data during straight and level flight segments are included.
were calculated for each percent of RHI, the Polar Neph-elometer data are averages over 10% increments.
Values of CPF near zero in the dry region below 70% sup-port the notion that the Polar Nephelometer has exclusively probed ice crystals. (The origin of the hump at RHI between 40–50% in the SH data set is not known.) In contrast to what is expected from the schematic shown in Fig. 1b, however, the CPF curves in Fig. 6 do not increase monotonically to unity when RHI rises, but exhibit local minima centered at 120% (NH data) and 150% (SH data). This feature can also be traced in the data of the other probes presented in Figs. 2– 5, but the extent of the minimum depends on the threshold used to characterize in-cloud and out-of-cloud data points.
As the Polar Nephelometer detects ice crystals in cirrus when they return an extinction signal>0.05 km−1, a suffi-cient number of crystals must have nucleated and grown to certain sizes in order to produce such large extinction val-ues. The very first, freshly nucleated crystals are certainly not detectable by the Polar Nephelometer probe. When all ice crystals have formed at RHI>130% (NH) and >150% (SH), they grow and thereby reduce RHI and become de-tectable by the Polar Nephelometer when crossing again the RHI-regions containing the local minima. The same reason-ing can be applied to the other probes.
This provides an explanation for the distinct minima ob-served in the Polar Nephelometer data presented in Fig. 6. Thus, the interpretation of the local minimum in observed CPF above ice saturation is that it approximates the range in RHI where the onset of cloud formation occurs. The
compar-of nucleation was different during the respective campaigns. The study of Haag et al. (2003) investigates this difference in ice nucleation in cirrus in more detail by analyzing the distributions of RHI taken outside of and inside cloud with the help of microphysical model simulations.
3.4 Cloud water content
Figure 7a shows the observed cloud water contents derived from the sum of the CWC’s measured by the 2D-probe us-ing an empirical formulation (Gayet et al., 2002) to convert from size distribution to CWC, and the CWC derived from the FSSP-300 size distribution assuming spherical particles and using a particle mass density of 0.9 g cm−3. The ob-served distributions are normalized, which makes the areas under the curves equal to unity.
Both NH (black curve) and SH (red curve) distributions of CWC are rather similar and are skewed with a tail towards lower CWCs. The calculated geometric mean CWCs are 7.3 and 10.4 mg m−3 for the SH and NH data, respectively. The data points below 0.01 mg m−3are almost entirely data from the FSSP-300 when the 2D-probe did not register any crystals, hence aerosol particles and perhaps the smallest ice crystals contribute to such low CWCs. The water vapor avail-able to convert to CWC depends strongly on temperature, we therefore derive a similar CWC distribution taken in a nar-row temperature range between 225 and 227 K, as presented in Fig. 7b. The distributions in Figs. 7a and b essentially exhibit the same features, but the mode or maximum of the distributions for the more narrow temperature range is more defined.
The rather small differences in the distributions of CWC between the SH and NH campaigns along with the fact that the distributions of temperatures, updraft speeds, and total ice crystal concentrations were also quite similar suggests that existing differences in the freezing properties of aerosol particles between SH and NH data have hardly affected the CWC. Rather the CWCs appear to be mainly determined by dynamical factors such as the advection of water vapor con-trolling the availability of condensable water.
4 Conclusions
a)
b)
1E-4 1E-3 0.01 0.1 1 10 100 0.0
0.2 0.4 0.6 0.8 1.0
1E-4 1E-3 0.01 0.1 1 10 100 0.0
0.2 0.4 0.6 0.8 1.0
1E-4 1E-3 0.01 0.1 1 10 100 0.0
0.2 0.4 0.6 0.8 1.0
d
N
/dl
og C
W
C
(
norm
a
li
z
e
d)
CWC (mg m-3)
0.1 1 10 100
0.0 0.2 0.4 0.6 0.8 1.0 1.2 1.4 1.6 1.8 2.0
dN
/d
log
CWC (N
or
mali
z
e
d
)
CWC (mg m-3)
Fig. 7.Observed distributions of cloud water content (SH: red curves, NH: black curves). In(a)all temperatures below 235 K and relative
humidities between 95 and 105% RHI are used. In(b)the temperature only ranges between 225 and 227 K. The observed CWC is based on
the sum of the FSSP-300 and 2D-probe data. Note the different scaling of the CWC axes.
dissolves; and a dry particle region<70% where eventually all ice particles disappear.
The CPF derived from the Polar Nephelometer data ex-hibits a distinct local minimum between 140–155% RHI in the SH data set when plotted as a function of RHI. A less pro-nounced local minimum in CPF is also suggested in the NH data set between approximately 115–130% RHI. Our inter-pretation of these features is that they correspond to the pre-ferred ice nucleation thresholds during the respective cam-paigns. The SH threshold is consistent with homogeneous freezing, whereas the NH threshold indicates heterogeneous ice formation. A comprehensive analysis of this finding is presented in Haag et al. (2003).
Our data strongly support the notion that (interstitial) aerosols and cirrus clouds form a continuum system. As we have shown, how well we can experimentally distinguish be-tween ice crystals, haze droplets, and other aerosol particles as a function of RHI will largely depend on the sensors used to probe the aerosol/cirrus system. The CPFs describe “pure aerosol” below a poorly defined RHI<70%, but never really describe “pure cloud” inasmuch as interstitial aerosol parti-cles are not completely scavenged by the ice crystals during the cloud lifetime. The evaporation kinetics of small ice crys-tals and the haze particle properties above ice saturation are poorly constrained by observations and must remain under scrutiny to fully understand how cirrus clouds form and dis-appear in the atmosphere. In this regard, there is a need for a measurement device combining the size detection sensitivity of the FSSP-300 and the concentration detection sensitivity of the CVI, and for size-resolved in situ chemical characteri-zation of aerosol and ice particles.
Acknowledgements. This work was funded by the European Com-mission through the projects INCA and PARTS. It also contributes to the project “Particles and Cirrus Clouds” (PAZI) supported by the Helmholtz-Gemeinschaft Deutscher Forschungszentren (HGF). The Swedish Research Council is sponsoring this work by support-ing ITM in airborne aerosol and cirrus activities. We thank the en-tire INCA team for help in collecting the data.
References
Auriol, F., Gayet, J.-F., Febvre, G., Jourdan, O., Labonnotte, L., and Brogniez, G.: In situ observations of cirrus cloud scattering
phase function with 22◦and 46◦halos: Cloud field study on 19
February 1998, J. Atmos. Sci., 58, 3376–3390, 2000.
Baumgardner, D., Dye, J. E., Gandrud, B. W., and Knollenberg, R. G.: Interpretation of measurements made by the forward scat-tering spectrometer probe (FSSP-300) during the Airborne Arc-tic Stratospheric Expedition, J. Geophys. Res., 97, 8035–8046, 1992.
Borrmann, S., Luo, B. P., and Mishchenko, M.: Application of the T-matrix method to the measurement of aspherical (ellip-soidal) particles with forward scattering optical particle counters, J. Aerosol Sci., 31, 789–799, 2000.
Boucher, O.: Air traffic may increase cirrus cloudiness, Nature, 397, 30–31, 1999.
Chen, J.-P. and Crutzen, P. J.: Solute effects on the evaporation of ice particles, J. Geophys. Res., 99, 18 847–18 859, 1994. DeMott, P. J.: Laboratoty studies of cirrus cloud processes, in:
Cir-rus, edited by Lynch, D. K., et al., Oxford Univ. Press, New York, pp.102–135, 2002.
measurements obtained with six PMS 2D-C probes, J. Atmos. Ocean. Technol., 10, 180–194, 1993.
Gayet, J.-F., Cr´epel, O., Fournol, J. F., and Oshchepkov, S.: A new airborne Polar Nephelometer for the measurements of optical and microphysical cloud properties. Part I: Theoretical design, Ann. Geophys., 15, 451–459, 1997.
Gayet, J.-F., Auriol, F., Minikin, A., Str¨om, J., Seifert, M., Kre-jci, R., Petzold, A., Febvre, G., and Schumann,U.: Quantitative measurement of the microphysical and optical properties of cir-rus clouds with four different in situ probes: Evidence of small ice crystals, Geophys. Res. Lett., 29, 2230–2234, 2002. Haag, W., K¨archer, B., Str¨om, J., Minikin, A., Ovarlez, J.,
Lohmann, U., and Stohl, A.: Freezing thresholds and cirrus cloud formation mechanisms inferred from in situ measurements of rel-ative humidity, Atmos. Chem. Phys., 3, 1791–1806, 2003. Intergovernmental Panel on Climate Change (IPCC), 1999:
Avia-tion and the Global Atmosphere, edited by Penner, J. E., Lister, D. H., Griggs, D. J., Dokken, D. J., and McFarland, M., Cam-bridge Univ. Press, CamCam-bridge, UK, pp. 373, 1999.
Kristensson, A., Gayet, J.-F., Str¨om, J., and Auriol, F.: In situ ob-servations of a reduction in effective crystal diameter in cirrus clouds near flight corridors, Geophys. Res. Lett., 27, 681–684, 2000.
K¨archer, B. and Solomon, S.: On the composition and optical ex-tinction of particles in the tropopause region, J. Geophys. Res., 104, 27 441–27 459, 1999.
K¨archer, B. and Lohmann, U.: A parameterization of cirrus cloud formation: Heterogeneous freezing, J. Geophys. Res., 108, 4402, doi:10.1029/JD2002003220, 2003.
K¨archer, B. and Str¨om, J.: The roles of dynamical variability and aerosols in cirrus cloud formation, Atmos. Chem. Phys., 3, 823– 838, 2003.
Mannstein, M., Meyer, R., and Wendling, P.: Operational detection of contrails from NOAA-AVHRR-data, Int. J. Remote Sensing, 20, 1641–1660, 1999.
Meyer, R., Mannstein, H., Meerk¨otter, R., Schumann, U., and Wendling, P.: Regional radiative forcing by line-shaped con-trails derived from satellite data, J. Geophys. Res., 107, doi:10.1029/2001JD000426, 2002.
of clouds with a droplet to aerosol converter, Geophys. Res. Lett., 12, 121–124, 1985.
Ovarlez, J. and van Velthoven, P.: Comparison of water vapor mea-surements with data retrieved from ECMWF analyses during POLINAT experiment, J. Appl. Meteor., 105, 1329–1335, 1997. Ovarlez, J., van Velthoven, P., Sachse, G., Vay, S., Schlager, H., and Ovarlez, H.: Comparison of water vapor measurements from POLINAT 2 with ECMWF analyses in high-humidity conditions, J. Geophys. Res., 105, 3737–3744, 2000.
Ovarlez, J., Gayet, J.-F., Gierens, K., Str¨om, J., Ovarlez, H., Auriol, F., Busen, R., and Schumann, U.: Water vapour measurements inside cirrus clouds in Northern and Southern hemispheres dur-ing INCA, Geophys. Res. Lett., 29, 1813–1817, 2002.
Schr¨oder, F., K¨archer, B., Fiebig, M., and Petzold, A.:Aerosol states in the free troposphere at northern midlatitudes, J. Geophys. Res., 107, 8126, doi:10.1029/2000JD000194, 2002.
Seifert, M., Str¨om, J., Krejci, R., Minikin, A., Petzold, A., Gayet, J.-F., Schlager, H., Ziereis, H., Schumann, U. and Ovarlez, J.: Aerosol-cirrus interactions: A number based phenomenon at all?, Atmos. Chem. Phys., 3, in press, 2003a.
Seifert, M., Str¨om, J., Krejci, R., Minikin, A., Petzold, A., Gayet, J.-F., Schumann, U., and Ovarlez, J.: In situ observations of aerosol particles remaining from evaporated cirrus crystals: Comparing clean and polluted air masses, Atmos. Chem. Phys., 3, 10371049, 2003b.
Sonntag, D.: Advancements in the field of hygrometry, Meteorol. Z., 3, 51–66, 1994.
Str¨om, J., Heintzenberg, J., Noone, K. J., Noone, K. B., Ogren, J. A, Albers, F., and Quante, M.: Small crystals in cirrus clouds: their residue size distribution, cloud water content, and related cloud properties, J. Atmos. Res., 32, 125–141, 1994.