BGD
12, 7449–7490, 2015Detecting methane ebullition on thermokarst lake ice
P. R. Lindgren et al.
Title Page
Abstract Introduction
Conclusions References
Tables Figures
◭ ◮
◭ ◮
Back Close
Full Screen / Esc
Printer-friendly Version Interactive Discussion
Discussion
P
a
per
|
Discussion
P
a
per
|
Discussion
P
a
per
|
Discussion
P
a
per
|
Biogeosciences Discuss., 12, 7449–7490, 2015 www.biogeosciences-discuss.net/12/7449/2015/ doi:10.5194/bgd-12-7449-2015
© Author(s) 2015. CC Attribution 3.0 License.
This discussion paper is/has been under review for the journal Biogeosciences (BG). Please refer to the corresponding final paper in BG if available.
Detecting methane ebullition on
thermokarst lake ice using high
resolution optical aerial imagery
P. R. Lindgren1, G. Grosse2,1, K. M. Walter Anthony3, and F. J. Meyer1
1
Geophysical Institute, University of Alaska Fairbanks, USA
2
Alfred Wegener Institute Helmholtz Centre for Polar and Marine Research, Potsdam, Germany
3
Water and Environmental Research Center, University of Alaska Fairbanks, USA
Received: 31 March 2015 – Accepted: 20 April 2015 – Published: 20 May 2015
Correspondence to: P. R. Lindgren ([email protected])
BGD
12, 7449–7490, 2015Detecting methane ebullition on thermokarst lake ice
P. R. Lindgren et al.
Title Page
Abstract Introduction
Conclusions References
Tables Figures
◭ ◮
◭ ◮
Back Close
Full Screen / Esc
Printer-friendly Version Interactive Discussion
Discussion
P
a
per
|
Discussion
P
a
per
|
Discussion
P
a
per
|
Discussion
P
a
per
|
Abstract
Thermokarst lakes are important emitters of methane, a potent greenhouse gas. How-ever, accurate estimation of methane flux from thermokarst lakes is difficult due to their remoteness and observational challenges associated with the heterogeneous nature of ebullition (bubbling). We used multi-temporal high-resolution (9–11 cm) aerial images
5
of an interior Alaskan thermokarst lake, Goldstream Lake, acquired 2 and 4 days follow-ing freeze-up in 2011 and 2012, respectively, to characterize methane ebullition seeps and to estimate whole-lake ebullition. Bubbles impeded by the lake ice sheet form dis-tinct white patches as a function of bubbling rate vs. time as ice thickens. Our aerial imagery thus captured in a single snapshot the ebullition events that occurred before
10
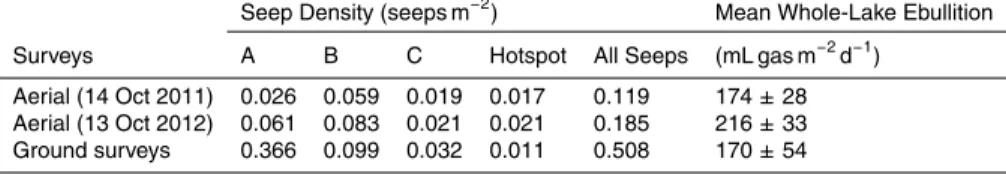
the image acquisition. Image analysis showed that low-flux A- and B-type seeps are as-sociated with low brightness patches and are statistically distinct from high-flux C-type and Hotspot seeps associated with high brightness patches. Mean whole-lake ebul-lition based on optical image analysis in combination with bubble-trap flux measure-ments was estimated to be 174±28 and 216±33 mL gas m−2d−1for the years 2011
15
and 2012, respectively. A large number of seeps demonstrated spatio-temporal stability over our two-year study period. A strong inverse exponential relationship (R2≥0.79)
was found between percent surface area of lake ice covered with bubble patches and distance from the active thermokarst lake margin. Our study shows that optical remote sensing is a powerful tool to map ebullition seeps on lake ice, to identify their relative
20
strength of ebullition and to assess their spatio-temporal variability.
1 Introduction
Soils in the northern permafrost region contain 1300–1370 Pg of organic carbon with an uncertainty range of 930–1690 Pg (Hugelius et al., 2014). A large amount of soil carbon in the Yedoma permafrost region (∼450 Pg) is found in thick Holocene deposits 25
BGD
12, 7449–7490, 2015Detecting methane ebullition on thermokarst lake ice
P. R. Lindgren et al.
Title Page
Abstract Introduction
Conclusions References
Tables Figures
◭ ◮
◭ ◮
Back Close
Full Screen / Esc
Printer-friendly Version Interactive Discussion
Discussion
P
a
per
|
Discussion
P
a
per
|
Discussion
P
a
per
|
Discussion
P
a
per
|
Pleistocene deposits thawed underneath lakes (Grosse et al., 2011; Walter Anthony et al., 2014). However, permafrost degradation can facilitate the transfer of this per-mafrost stored carbon to the atmosphere in the form of the greenhouse gases carbon dioxide (CO2) and methane (CH4), resulting in a positive feedback to global climate change (Zimov et al., 2006; Walter et al., 2006; Schuur et al., 2008; Koven et al.,
5
2011). One common and effective form of permafrost degradation involves formation and growth of thermokarst lakes (Grosse et al., 2013; Kokelj and Jorgenson, 2013), which tap into deep (up to 60 m) permafrost carbon pools (Zimov et al., 1997; Walter et al., 2008a).
Thermokarst lakes are a prominent landscape feature in the high northern latitudes
10
(Smith et al., 2007; Grosse et al., 2013). They are formed in closed depressions fol-lowing the thawing of ice-rich permafrost or melting of massive ice. Once initiated, the presence of a water body on permafrost serves as a positive feedback to permafrost degradation. Depending on the amount of excess ice content in permafrost, this pos-itive feedback accelerates the growth of thermokarst lakes in both lateral and vertical
15
directions (Jorgenson and Shur, 2007; Plug and West, 2009; Kokelj and Jorgenson, 2013). Over many years, taliks (thaw bulbs) of perennially thawed soil develop be-neath thermokarst lakes (Hinzman et al., 2005; West and Plug, 2008; Rowland et al., 2011) creating conditions favorable for year-round methane production through anaer-obic decomposition of organic matter by microbes (Zimov et al., 1997; Walter et al.,
20
2006, 2008a; Kessler et al., 2012). During lateral expansion, thermal erosion along the lake margin also releases both Holocene and Pleistocene organic matter from adja-cent soils into anaerobic lake bottoms further enhancing methanogenesis (Zimov et al., 1997; Walter Anthony et al., 2014).
Ebullition (bubbling) is considered the dominant pathway of methane release from
25
BGD
12, 7449–7490, 2015Detecting methane ebullition on thermokarst lake ice
P. R. Lindgren et al.
Title Page
Abstract Introduction
Conclusions References
Tables Figures
◭ ◮
◭ ◮
Back Close
Full Screen / Esc
Printer-friendly Version Interactive Discussion
Discussion
P
a
per
|
Discussion
P
a
per
|
Discussion
P
a
per
|
Discussion
P
a
per
|
winter, most bubbles emerging from the lake bed ascend through the water column and get trapped by ice as gas-pockets (Walter et al., 2008b; Greene et al., 2014). Ongo-ing ice growth can separate ice-trapped bubbles from an individual seep by thin films of ice, resulting in vertically oriented bubble columns in the ice. Walter et al. (2006) took advantage of this phenomenon to reveal locations and relative strength of
“point-5
sources” of methane seep ebullition across lake ice. They identified four major types of methane ebullition seeps based on ice bubble cluster morphology and they mea-sured daily mean ebullition rates (Fig. 1) (Walter Anthony and Anthony, 2013). It should be noted that seep class-specific ebullition rates reported represent the daily aver-age of thousands of flux measurements; however, bubbling within each class is highly
10
episodic, and bubbling rates of individual seeps are not constant over time (Walter Anthony et al., 2010; Walter Anthony and Anthony, 2013): (1) A-type seeps are char-acterized by isolated bubbles stacked in multiple vertical layers with less than 50 % of all gas volume merged in bubble clusters. A-type seeps have the lowest ebullition rate (22±4 mL gas d−1); (2) B-type seeps are dominated by laterally-merged bubbles 15
stacked in multiple layers (more than 50 % of all gas volume merged in a bubble clus-ter). The ebullition rate of this bubble type is 211±39 mL gas d−1; (3) C-type seeps,
associated with an ebullition rate of 1726±685 mL gas d−1, are characterized by
sin-gle large gas pockets (usually>40 cm in diameter) separated vertically by ice layers containing few or no bubbles; and (4) Hotspot seeps have the highest ebullition rate,
20
on average 7801±764 mL gas d−1. Due to upwelling of water associated with frequent
bubble streams, Hotspots generally appear as open-water holes in lake ice following freeze up. Usually a thin snow-ice film develops over Hotspots in winter, visually mask-ing them at the surface; however, ice blocks cut from the lake throughout winter and spring reveal that Hotspot bubbling maintains a large ice-free cavity throughout winter
25
(Greene et al., 2014).
associ-BGD
12, 7449–7490, 2015Detecting methane ebullition on thermokarst lake ice
P. R. Lindgren et al.
Title Page
Abstract Introduction
Conclusions References
Tables Figures
◭ ◮
◭ ◮
Back Close
Full Screen / Esc
Printer-friendly Version Interactive Discussion
Discussion
P
a
per
|
Discussion
P
a
per
|
Discussion
P
a
per
|
Discussion
P
a
per
|
ated with the logistics of fieldwork in remote locations as well as spatial and temporal heterogeneity of ebullition, accurate estimation of methane flux from thermokarst lakes is difficult (Casper et al., 2000; Bastviken et al., 2004; Wik et al., 2011). Most studies have been carried out using field measurements to understand the spatial and tempo-ral variability of methane ebullition. However, insufficient field data is a recurring issue
5
since it is difficult to sample the entire lake area, particularly when lakes have remote locations. This may lead to an unrealistic characterization of variability of ebullition bub-bles and a less accurate estimation of methane flux at a regional scale. Recently, Wal-ter Anthony and Anthony (2013) combined point-process modeling with field-measured data to understand the drivers of ebullition spatial variability in thermokarst lakes and
10
provided ways to reduce uncertainty in regional-scale lake ebullition estimates based on limited field data; nonetheless spatially-limited field sampling remains a hindrance to whole-lake ebullition quantification.
Remote sensing methods combined with field observations can help overcome some of the limitations that exist in a sole field-survey method. One of the major advantages
15
of remote sensing tools is that they may provide the possibility to map the entire popu-lation of methane ebullition bubbles on a lake. Moreover, remote sensing can overcome the logistical difficulties that exist in accessing methane-bubbling lakes in the remote regions of the Arctic and Subarctic. Previously, scientists who used remotely sensed images from synthetic aperture radar (SAR) sensors to study lake ice phenology
de-20
tected tiny (1–5 mm diameter) vertically-oriented tubular gas bubbles trapped in ice that form when dissolved gases are excluded during ice formation (Jeffries et al., 1994, 2005; Duguay et al., 2003). The presence of these sometimes densely-packed non-ebullition gas bubbles, which are usually ubiquitous across the lake if they occur in the ice at all (Boereboom et al., 2012), can have significant effect on spectral and SAR
25
BGD
12, 7449–7490, 2015Detecting methane ebullition on thermokarst lake ice
P. R. Lindgren et al.
Title Page
Abstract Introduction
Conclusions References
Tables Figures
◭ ◮
◭ ◮
Back Close
Full Screen / Esc
Printer-friendly Version Interactive Discussion
Discussion
P
a
per
|
Discussion
P
a
per
|
Discussion
P
a
per
|
Discussion
P
a
per
|
5 to>100 cm), are also detected with remote-sensing SAR sensors (Engram et al., 2012). Walter et al. (2008b) and Engram et al. (2012) demonstrated the potential appli-cation of SAR satellite imagery to estimate whole-lake ebullition from spatially-limited field measurements of ebullition along survey transects. These studies showed cor-relation of radar backscatter values with the percent surface area of lake ice covered
5
with bubbles and field-measured methane ebullition rates based on bubble-trap mea-surements from lakes. Additionally, Walter Anthony et al. (2012) used aerial surveys to identify, photograph, and map large (∼1 to>300 m2) bubbling-induced open-water holes in ice-covered lakes in Alaska associated with geologic methane seepage. Cou-pling aerial surveys with ground truth flux measurements and laboratory analyses, this
10
study showed that geologic methane seepage is not extensive, but it is important in some regions of Alaska underlain by leaky hydrocarbon reservoirs.
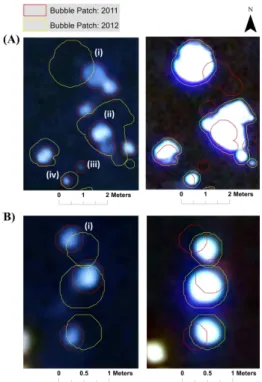
Since open holes in lake ice induced by bubbling are visually distinct, and since lower-flux ebullition bubble clusters trapped inside ice appear as bright white features that have a strong contrast against dark, bubble-free congelation ice (Fig. 1), there
15
is the potential and need to detect and quantify methane bubbles with optical re-mote sensing. In this study, we explored high-resolution optical rere-mote sensing im-ages to study methane ebullition at Goldstream Lake, an interior Alaska thermokarst lake (Fig. 1). We first mapped ebullition bubbles trapped in early winter lake ice in aerial images. We refer to the bubble features seen in our images as “bubble patches”
20
henceforth since the image resolution was not sufficient to fully resolve small individual bubbles (Fig. 1). Then we characterized imaged bubble patches based on field-based ebullition bubble seep data collected approximately 1–2 weeks after image acquisition in the fall of 2011 and 2012 and again in spring of the following year. We hypothesized that the brightness of bubble patches correlates with the strength of methane flux
as-25
BGD
12, 7449–7490, 2015Detecting methane ebullition on thermokarst lake ice
P. R. Lindgren et al.
Title Page
Abstract Introduction
Conclusions References
Tables Figures
◭ ◮
◭ ◮
Back Close
Full Screen / Esc
Printer-friendly Version Interactive Discussion
Discussion
P
a
per
|
Discussion
P
a
per
|
Discussion
P
a
per
|
Discussion
P
a
per
|
and analyzed spatio-temporal variability of seep occurrences by comparing imagery from different years.
2 Study site
Goldstream L. is an interior Alaska thermokarst lake covering an area of approximately 10 300 m2 with maximum and average depths of 2.9 and 1.6 m, respectively. The lake
5
formed in “yedoma-type” deposits of retransported late-Quaternary loess at the toe slope of Goldstream Valley near Fairbanks (Péwé, 1975; Kanevskiy et al., 2011; Walter Anthony and Anthony, 2013). Based on remotely-sensed aerial and satellite images, the lake partially drained between years 1949 and 1978 but has been expanding mainly along the eastern shore since then (Fig. 1f). This active thermokarst expansion is also
10
indicated by spruce trees leaning lake-ward along the eastern lake margin, and stand-ing dead trees submerged in the lake offshore of the eastern margin. The vegetation around the lake is dominated by black spruce and willow. Cattail (Typhaspp.) grows along some shallow margins of the lake. Water lilies (Nupharspp.) are also found in several locations on the northern and south-western parts of the lake.
15
Ice formation on Goldstream L. usually occurs between the end of September to mid-October, reaches maximum thickness by mid-March, and ice break up occurs around the end of April or early May. Vertically oriented layers of methane ebullition bubbles (Fig. 1), representing point-source seeps, are widespread in the lake ice particularly along the eastern margin (Walter Anthony and Anthony, 2013). Many Hotspot seeps
20
BGD
12, 7449–7490, 2015Detecting methane ebullition on thermokarst lake ice
P. R. Lindgren et al.
Title Page
Abstract Introduction
Conclusions References
Tables Figures
◭ ◮
◭ ◮
Back Close
Full Screen / Esc
Printer-friendly Version Interactive Discussion
Discussion
P
a
per
|
Discussion
P
a
per
|
Discussion
P
a
per
|
Discussion
P
a
per
|
3 Methods
3.1 Ground truth field data
We surveyed methane ebullition seep distribution on Goldstream L. using a survey-grade LEICA VIVA™real time kinematic Differential Global Positioning System (DGPS) with centimeter-accuracy in fall 2011 and 2012 as well as spring 2012 and 2013.
5
We surveyed the lake perimeter and measured several permanently installed refer-ence markers as Ground Control Points (GCPs) to perform geometric rectification of aerial images. We conducted detailed ebullition ice-bubble surveys in October 2011 two weeks after image acquisition. The surveys were performed within two large poly-gons that are identified in Fig. 1f: one about∼7 m from the eastern thermokarst shore 10
and a second near the center of the lake. The surveyed polygons in the east and cen-ter of the lake covered∼428 and ∼236 m2, respectively, and were reported in detail
in Walter Anthony and Anthony (2013) and Greene et al. (2014). In October 2012, we performed bubble surveys 6 days after image acquisition in three other polygons (total area∼200 m2) randomly distributed across the lake (Fig. 1f). We used the seep iden-15
tification method described by Walter Anthony et al. (2010), and included a fifth class of ebullition seeps which we have observed in Goldstream L. and numerous other pan-arctic lakes, called “Tiny-type”. Tiny-type seeps consist of ebullition bubbles (typically 3 to 10 mm diameter) that form large (several to tens of square meters), diffuse patches rather than clustering as tightly packed bubbles the way A, B, C and Hotspot seeps do.
20
Until recently, the Tiny-type seep class was only recorded in transect survey data but never assigned a mean daily flux value or included in whole-lake ebullition estimates due to a lack of associated flux data. Recent flux measurements made continuously year-round with submerged bubble traps on the Tiny-type seep class in Goldstream L. and other lakes suggest that flux from these seeps may also be important (Walter
An-25
BGD
12, 7449–7490, 2015Detecting methane ebullition on thermokarst lake ice
P. R. Lindgren et al.
Title Page
Abstract Introduction
Conclusions References
Tables Figures
◭ ◮
◭ ◮
Back Close
Full Screen / Esc
Printer-friendly Version Interactive Discussion
Discussion
P
a
per
|
Discussion
P
a
per
|
Discussion
P
a
per
|
Discussion
P
a
per
|
Goldstream L., but we do not estimate their contribution toward whole-lake ebullition flux.
While field-based estimations of A, B, and C-type seeps were limited to survey plots covering about 13 % of the lake are, the locations of Hotspot seeps were mapped across the whole lake using detailed DGPS surveys of open holes in October and
5
April 2011 and 2012. Hotspots were detected visually at these times of year as open-water holes in lake ice. In April 2013, we extracted several blocks of the full lake-ice column at seep locations to investigate the temporal ebullition patterns that developed throughout the winter season.
3.2 Remotely sensed high-resolution image acquisition 10
We scheduled low altitude, high-resolution aerial image acquisitions to map and char-acterize methane ebullition bubbles during a narrow time window in the early winter, when first ice had formed but was still snow-free. Images were acquired in nadir with a Navion L17a plane using a Nikon D300 camera system mounted in a bellyport on 14 October 2011 and 13 October 2012, two and four days following freeze-up,
respec-15
tively. Flight altitude for the acquisitions was ∼750 m a.s.l. in 2011 and ∼587 m a.s.l. in 2012. Image scale was 1 : 20 000 and 1 : 17 000, respectively for 2011 and 2012, which in turn corresponds to ground sampling distance (GSD) of 11 and 9 cm. Addi-tionally, we collected images of the snow-covered lake in fall 14 October 2012 using an Unmanned Aerial Vehicle (UAV) mounted with an Aptina MT9P031 board camera
20
to map ice-free Hotspot seep locations. The images were acquired from a flying height of approximately 230 m a.s.l., corresponding to an image scale 1 : 30 000 and GSD of 6 cm. All the images consisted of three visible bands: red, green and blue (RGB).
3.3 Mapping bubble patches in early winter snow-free lake ice images
We initially performed mosaicking of multiple images of Goldstream L. to construct
25
Pro-BGD
12, 7449–7490, 2015Detecting methane ebullition on thermokarst lake ice
P. R. Lindgren et al.
Title Page
Abstract Introduction
Conclusions References
Tables Figures
◭ ◮
◭ ◮
Back Close
Full Screen / Esc
Printer-friendly Version Interactive Discussion
Discussion
P
a
per
|
Discussion
P
a
per
|
Discussion
P
a
per
|
Discussion
P
a
per
|
fessional Software™ Version 0.9.0. We then performed geometric image rectification with DGPS-collected GCPs using a second polynomial bilinear transformation. Finally, for image enhancement we applied a feature linear transformation on all three visible spectral bands of the lake images using unstandardized Principal Component Analysis (PCA). Both geometric and spectral image transformations were performed in ENVI™
5
image processing software, Version 4.8.
Multi-spectral remote sensing data consists of high inter-band correlation and there-fore bands within a dataset carry redundant information (Rocchini et al., 2007). PCA transforms a set of correlated variables (original bands) into a set of linearly uncorre-lated orthogonal components (principal components) (Schowengerdt, 2007; Estronell
10
et al., 2013). It reduces the dimensionality of the data and outputs the maximum amount of information with a physical meaning from the original bands into the least number of principal components (Estronell et al., 2013). After transformation, the first principal component has the variables that account for the most variance in the dataset and each succeeding independent component in turn carries less and less of the
orig-15
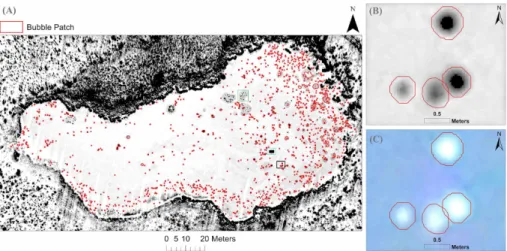
inal data variance. In our case, the first PC band (PC 1) carried the most variance (>98 %) attributing to bubble patches (Fig. 2). Visually, bubble patches on the lake ice appeared as dark patches in PC 1 band with low PC 1 grey values and were quite distinct from the surrounding lake ice.
We then applied a classification technique based on object-based image analysis
20
(OBIA) to semi-automatically identify and map methane ebullition bubble patches in the PCA-transformed images using eCognition Developer™ 8 (Lindgren et al., 2015). Our object-based classification method comprised of two steps: (1) image segmenta-tion, i.e. aggregation of homogenous image pixels based on their spatial and spectral homogeneity into meaningful clusters known as image objects, and (2) classification of
25
BGD
12, 7449–7490, 2015Detecting methane ebullition on thermokarst lake ice
P. R. Lindgren et al.
Title Page
Abstract Introduction
Conclusions References
Tables Figures
◭ ◮
◭ ◮
Back Close
Full Screen / Esc
Printer-friendly Version Interactive Discussion
Discussion
P
a
per
|
Discussion
P
a
per
|
Discussion
P
a
per
|
Discussion
P
a
per
|
associated with image objects in classification. For this, we first decomposed our scene into meaningful regions. We then organized them in a conceptual image object hier-archy creating a semantic network between different sized image objects; large-scale objects in the upper level called super objects and small-scale objects in the lower level called sub-objects (Supplement Fig. S1). For example, the lake area is a super-object
5
of different sub-objects associated with various lake ice characteristics (e.g. shadow, dark black ice) whereas areas of specific lake ice characteristics are super-objects of our final target feature, ebullition bubble patches. In each object level, image ob-jects within the boundary of super-obob-jects were altered and refined through merging and segmentation to form objects with 1 : n relationship between super- and
sub-10
object. At an early stage, we applied coarser image segmentation (i.e. broad scale segmentation) and classification to delineate and label coarser target regions. Then in the later stages, finer segmentation (i.e. fine scale segmentation) and classification was performed to delineate and label finer target regions. This approach of detecting image objects from coarser to finer scale has been described as an effective way to
15
classify images in OBIA (Blaschke et al., 2008).
Based on empirical performance tests, we used the first two PCA components (PC 1 and PC 2) to perform multi-resolution segmentation embedded in eCognition Developer™ software to create image objects (eCognition Developer 7 Reference, 2007a). The advantage of using multi-resolution segmentation is that it allows to create
20
objects of different scales while minimizing the heterogeneity within the resulting object at the given scale (Baatz and Schape, 2000). For example, we applied a large-scale factor to create objects of different lake ice characteristics and a small-scale factor to create bubble patch objects. We treated regions such as areas of lake ice charac-teristics independently to perform region-specific classification for the identification of
25
BGD
12, 7449–7490, 2015Detecting methane ebullition on thermokarst lake ice
P. R. Lindgren et al.
Title Page
Abstract Introduction
Conclusions References
Tables Figures
◭ ◮
◭ ◮
Back Close
Full Screen / Esc
Printer-friendly Version Interactive Discussion
Discussion
P
a
per
|
Discussion
P
a
per
|
Discussion
P
a
per
|
Discussion
P
a
per
|
7 Reference, 2007b) and morphological filters available in the eCognition Developer™ software.
The classification method performed very well in identifying bubble patches (Fig. 2) with an overall accuracy of 98 % when compared to manually identified bubble fea-tures in image segments that served as our ground truth sample data for classification
5
accuracy assessment.
Similarly, Hotspots that appeared dark against the snow-covered lake were mapped using a simple contrast and split segmentation technique in eCognition Developer™ (eCognition Developer 7 Reference, 2007a). This involved choosing a threshold value for the algorithm to maximize the contrast between Hotspots and snow-covered lake
10
pixels and separate them into dark objects (consisting of pixels below the threshold) and bright objects (consisting of pixels above the threshold).
3.4 Interpretation of image classification results
We extracted PC 1 grey values of individual ebullition bubble patches mapped in im-ages from the year 2011 and 2012. Bubbles patches are visually bright in natural or
15
true color composite (RGB composite) images but have low grey values in the PC 1 band (Fig. 2). A higher brightness of bubble patches in natural color images resulted in lower PC 1 grey values. We assessed the relationship of ebullition bubble patch PC 1 values with four distinct types of ebullition seeps that we identified during our field survey. We performed an analysis of variance (ANOVA) to test the null hypothesis that
20
the mean PC 1 values (and thus true bubble brightness via its inverse relationship with the PC 1) of four types of seeps are not significantly different. We proposed to apply a post-hoc Tukey’s Honestly Significant Test (HSD), if the null hypothesis was rejected, to identify significantly distinct seeps. We applied a supervised classifica-tion using a Maximum Likelihood Classifier (MLC) on the three original visible bands
25
BGD
12, 7449–7490, 2015Detecting methane ebullition on thermokarst lake ice
P. R. Lindgren et al.
Title Page
Abstract Introduction
Conclusions References
Tables Figures
◭ ◮
◭ ◮
Back Close
Full Screen / Esc
Printer-friendly Version Interactive Discussion
Discussion
P
a
per
|
Discussion
P
a
per
|
Discussion
P
a
per
|
Discussion
P
a
per
|
classes and each pixel in the image is then assigned to the class with the highest prob-ability (Mather, 2009). Training samples were collected randomly on the image at seep locations identified using field-collected DGPS data points. Since MLC was solely per-formed on spectral characteristics derived from the training samples, the classification results from MLC were further investigated to check the classification type and size of
5
the seep mapped within a bubble patch. Based on bubble morphology described by Walter Anthony et al. (2010) and our field observations, we further refined our classi-fication results by integrating size as an additional feature to more accurately assign bubble patches with a seep type. Similar to training sample collection, for accuracy assessment, field-collected seep location data served as our ground truth. Finally, we
10
estimated the seep density and mean whole-lake ebullition rate by assigning the mean long-term flux values for seep type provided by Walter Anthony and Anthony (2013) to our classified bubble patches.
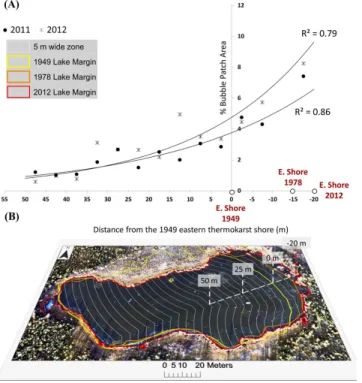
We further studied the spatial distribution of ebullition bubble patches as a function of distance from the eroding eastern thermokarst shore. For this, we divided the lake
15
area into multiple 5 m wide zones starting from the eastern eroding margin as mapped in a 1949 aerial image. Lake zones were created on both sides of the 1949 lake margin to cover the present day lake area. We calculated the percent of lake ice area covered with ebullition bubble patches for each zone and then analyzed its relationship to the distance from the eastern shore lines of the lake observed in 1949, 1978 and 2012.
20
We finally evaluated the multi-temporal (year 2011 and 2012) variability of ebullition bubble patches and assessed their regularities in space and time. We utilized a marked point process model to analyze spatial seep patterns in our multi-year bubble patch dataset derived from the images. Point process modeling was performed on a set of bubble patch centroids with their respective location and year information, which served
25
BGD
12, 7449–7490, 2015Detecting methane ebullition on thermokarst lake ice
P. R. Lindgren et al.
Title Page
Abstract Introduction
Conclusions References
Tables Figures
◭ ◮
◭ ◮
Back Close
Full Screen / Esc
Printer-friendly Version Interactive Discussion
Discussion
P
a
per
|
Discussion
P
a
per
|
Discussion
P
a
per
|
Discussion
P
a
per
|
generated a Multi-type Nearest Neighbor Distance Function derived from the locations of the bubbles mapped in the images usingGcrossfrom the spatstat statistical pack-age in R (Baddeley and Turner, 2005).Gcross first determines clustering parameters for the dataset in the first year. These clustering parameters are then used to model the expected number of the second year point given a certain distance from the first year
5
points if the second year point placement is random relative the first year point place-ment. Thus, theGcrossfunction allowed us to describe seep clustering on the lake and compare that with the theoretical value generated based on the assumption that seep locations are completely random. Based on the deviation between observed empiri-cal value and expected theoretiempiri-cal value estimated by the model, we determined the
10
stability of seep locations between 2011 and 2012. Similarly, we performed the Multi-type Nearest Neighbor Distance Function analysis usingGcrosson the field dataset of Hotspot locations collected in year 2011 and 2012 to check regularity of Hotspots.
We also considered that the centroid of a bubble patch, representing an ebullition bubble patch point location, could move from one year to another due to changes
15
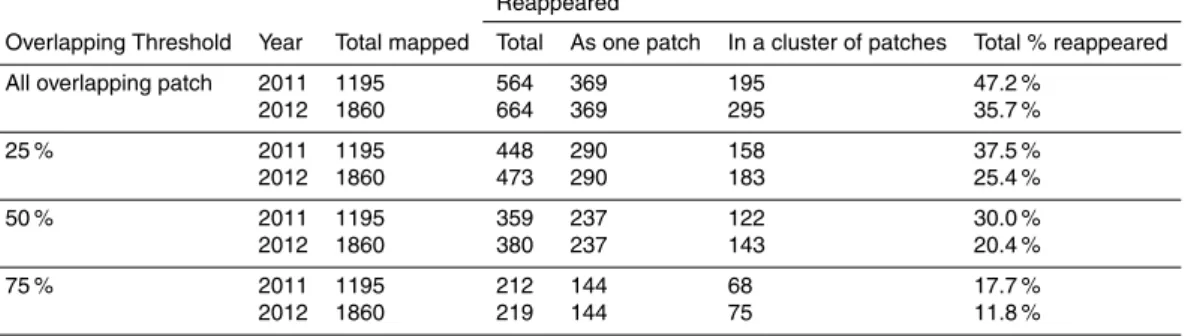
in the shape and size of a bubble patch or changes in bubble tube configuration in the sediment. We compared the overlap area between ebullition patches mapped in 2011 and 2012 images. If some area of a 2011 bubble patch appeared within the area of a 2012 bubble patch or vice versa, then we considered bubble patch to be stable in location (i.e. reappearing). We assumed that the overlapping bubble patches
20
originated from the same point source seep. We checked location stability among four classes of overlapping patches that were defined by setting thresholds on area overlap; “All overlapping bubble patches”, “More than 25 % area overlap”, “More than 50 % area overlap”, “More than 75 % area overlap”.
We used a map of ice-free Hotspots seeps derived from UAV images to compare
25
BGD
12, 7449–7490, 2015Detecting methane ebullition on thermokarst lake ice
P. R. Lindgren et al.
Title Page
Abstract Introduction
Conclusions References
Tables Figures
◭ ◮
◭ ◮
Back Close
Full Screen / Esc
Printer-friendly Version Interactive Discussion
Discussion
P
a
per
|
Discussion
P
a
per
|
Discussion
P
a
per
|
Discussion
P
a
per
|
4 Results and discussion
4.1 Characteristics of bubble patches in early winter lake ice imagery
4.1.1 Relationship between bubble patch brightness and field-measured methane flux
We found that PC 1 values of bubble patches negatively correlated with the strength
5
of field-measured methane flux of ebullition seeps (A, B, C and Hotspot seeps). Our ANOVA test rejected the null hypothesis suggesting significant distinction between mean PC 1 grey values of different seep types. Further post-hoc analysis using Tukey’s HSD test demonstrated that C- and A-type, Hotspot and A-type, Hotspot and B-type seeps are significantly distinct withpvalues<0.05 based on their mean PC 1 at a 95 %
10
confidence interval (Supplement Table S1). We thus conclude that higher flux seeps, Hotspot and C-type, are associated with brighter bubble patches (low PC 1 values) and lower flux seep types A and B are associated with less bright bubble patches (high PC 1 values).
An absolute discrimination of individual seep type was difficult to achieve due to
over-15
lapping brightness ranges between different seep types (Fig. 3). This is likely because ebullition is episodic with varying bubbling rates over time and because individual low-flux methane seeps were not resolved given spatial resolution of the image. A possible explanation for low true brightness (high PC 1 values) of some Hotspots is that fresh thin night-time ice temporarily covered some Hotspots on the image acquisition day,
20
allowing the formation of few small white gas bubbles while much of the remaining gas escaped through cracks in the thin ice, resulting in low true brightness for these high-flux seeps. We have observed this phenomenon on several occasions during our field visits in early winter and spring particularly on days when temperatures stayed low and Hotspots were covered with a few millimeters of ice with small bubbles beneath (Fig. 4);
25
snow-BGD
12, 7449–7490, 2015Detecting methane ebullition on thermokarst lake ice
P. R. Lindgren et al.
Title Page
Abstract Introduction
Conclusions References
Tables Figures
◭ ◮
◭ ◮
Back Close
Full Screen / Esc
Printer-friendly Version Interactive Discussion
Discussion
P
a
per
|
Discussion
P
a
per
|
Discussion
P
a
per
|
Discussion
P
a
per
|
free lake ice imagery due to spectral similarities between open water and clear black ice (Fig. 1).
We found that a large number of A-type seeps clustered together were not mapped as individual bubble patches but rather as a single large bubble patch. A-type seeps and high flux seeps that were close together were also mapped in a single feature
5
associated with a brighter bubble patch with low PC 1 values. Therefore, some A-type seeps showed low PC 1 values (high true brightness). Similar to A-type seeps, indi-vidual B-type seeps were also difficult to map. In a time series analysis of bubbling frequency by A- and B-type seeps, Walter Anthony et al. (2010) showed that bubbling from these shallow-sourced seeps is highly seasonal. Bubbling rates are high in
sum-10
mer when surface sediments are warmer, and low in winter when sediments cool down. Bubble traps left in place over these seep types year-round revealed that low-flux seeps can have periods of no bubbling for up to several months. Ice blocks harvested by us in spring over seeps marked as A-type seeps in October confirm this pattern (Supple-ment Fig. S2). It is very likely that A- and B-type seep conduits were present in the
15
sediments, but not actively bubbling during the two- and four-day periods after ice for-mation captured by the 2011 and 2012 imagery. Thus they did not appear under the given spatial resolution of the image and its specific acquisition time. Also, bubble traps placed over C-type seeps year round revealed that these seeps can also undergo long periods (weeks to months) of no bubbling, but when they bubble, the bubbling rates are
20
usually very high (Walter Anthony et al., 2010). This intermittent flux behavior probably contributed to some discrepancies in the relationship between bubble patch brightness derived from images that captured a snapshot of ebullition activity and methane flux values of seeps estimated from long-term field observations (Table 1).
In other parts of Goldstream L., especially along the eastern shore, we found large
25
BGD
12, 7449–7490, 2015Detecting methane ebullition on thermokarst lake ice
P. R. Lindgren et al.
Title Page
Abstract Introduction
Conclusions References
Tables Figures
◭ ◮
◭ ◮
Back Close
Full Screen / Esc
Printer-friendly Version Interactive Discussion
Discussion
P
a
per
|
Discussion
P
a
per
|
Discussion
P
a
per
|
Discussion
P
a
per
|
ice with some bright regular bubble spots (Fig. 4). Therefore, the brightness values corresponding to the surrounding Tiny-type seeps were assigned to other seeps, par-ticularly to low flux seeps that were within the Tiny-seep patch and had not expressed completely when the images were acquired.
4.1.2 Classification of bubble patches and estimation of whole-lake methane 5
flux
The overall MLC classification accuracy for differentiating seep types was ∼50 % for both 2011 and 2012 with better performance in the 2012 image with 55 % accuracy. The classifier performed better to identify the lowest flux seeps (A-type) and the highest flux seeps (Hotspot-type). B-type and C-type seeps showed high error of commission
10
mostly rising from the misidentification of seep A-type and Hotspots. C-type seeps had the largest error of omission since they were mostly misclassified as B-type seeps in 2011 and Hotspots in 2012.
Generally higher densities of A-type seeps (and also slightly in B- and C-type seeps) in ground surveys (Walter Anthony and Anthony, 2013; Greene et al., 2014) compared
15
to aerial images (Table 1) can be explained by the time in which observations were made and image resolution. Results reported in Walter Anthony and Anthony (2013) and Greene et al. (2014) are based on ground surveys conducted at Goldstream L. usually one to two weeks following freeze-up when ice was safe to walk on (Walter Anthony et al., 2010). Since our aerial surveys were conducted only 2–4 days
af-20
ter ice formation, and the frequency of bubbling events from A-type seeps is often weeks to months in winter, it is not surprising that the field surveys several weeks after ice formation capture an order of magnitude more A-type seep bubbles. Addition-ally, it is very likely that some active A-type seeps that occurred in very small patches were not distinct under the given resolution of the aerial images. Relatively more
fre-25
BGD
12, 7449–7490, 2015Detecting methane ebullition on thermokarst lake ice
P. R. Lindgren et al.
Title Page
Abstract Introduction
Conclusions References
Tables Figures
◭ ◮
◭ ◮
Back Close
Full Screen / Esc
Printer-friendly Version Interactive Discussion
Discussion
P
a
per
|
Discussion
P
a
per
|
Discussion
P
a
per
|
Discussion
P
a
per
|
a much higher barometric pressure drop preceding the aerial image acquisition in Oc-tober 2012 compared to OcOc-tober 2011. It is well established that ebullition is inversely related to changes in barometric pressure (Mattson and Likens, 1990; Fechner-Levy and Hemond, 1996; Scandella et al., 2011).
The comparison of Hotspot densities in optical images vs. ground surveys in Table 1
5
also shows the expected pattern. The ground-survey data of Hotspots reflects multiple years of whole-lake Hotspots surveys when ice is thick enough to safely walk on. When ice is very thin a few days after freeze up more open holes are present on the lake and classified as Hotspot seeps in aerial images. A week or more later many holes freeze over and will be classified as C-type seeps in ground surveys. This could have
10
also led to a high classification error for C-type seeps. The total density of C-type and Hotspot seeps combined remain consistent (∼0.04 seeps m−2) in both aerial and ground observations (Table 1). This also indicates that some of the seeps identified as Hotspots several days after freeze-up in aerial photos really become what we classify as C-type seeps (ice-sealed at the surface) within a week or more following freeze up.
15
We used the classification results to estimate seep density and a whole-lake ebul-lition rate. Our image-based analysis shows the whole-lake flux to be 174±28 and
216±33 mL gas m−2d−1for the year 2011 and 2012, respectively. The higher flux
es-timate in 2012 is due to the presence of a large number of bubble patches in 2012 (0.185 seeps m−2) compared to 2011 (0.119 seeps m−2) (Table 1). The field-based
es-20
timate of whole-lake ebullition for Goldstream L. using ice-bubble transect surveys (170±54 mL gas m−2d−1), was slightly at the low end of the estimates based on opti-cal imagery analysis from 2011 and 2012, respectively. It is conceivable that the field-based transect surveys might yield a lower flux than whole-lake seep analyses given that seeps are spatially rare, and field surveys often cover<1 % of the lake surface
25
BGD
12, 7449–7490, 2015Detecting methane ebullition on thermokarst lake ice
P. R. Lindgren et al.
Title Page
Abstract Introduction
Conclusions References
Tables Figures
◭ ◮
◭ ◮
Back Close
Full Screen / Esc
Printer-friendly Version Interactive Discussion
Discussion
P
a
per
|
Discussion
P
a
per
|
Discussion
P
a
per
|
Discussion
P
a
per
|
appear to be due to an overestimation of Hotspots in the early-acquisition date aerial image analysis.
4.2 Spatial and temporal characteristics of bubble patches on early winter lake ice
4.2.1 Spatial distribution of bubble patches in relation to thermokarst-lake 5
margin
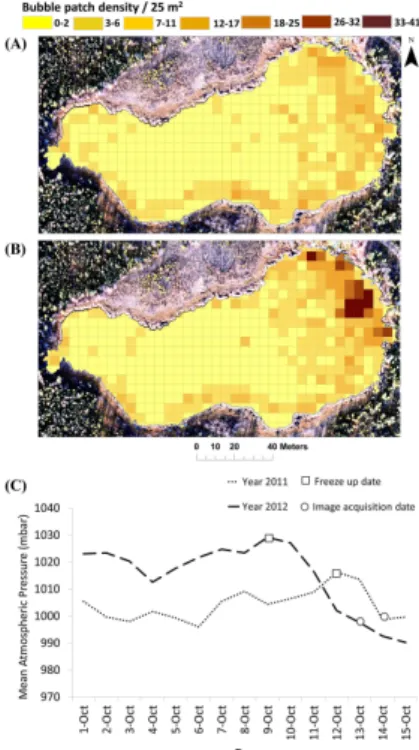
High methane production in response to thermokarst activity on the Goldstream L. is also evident from the distribution pattern of ebullition bubble patches at the eroding margins in different years. We found a strong inverse relationship (R2 values of 0.86 and 0.79 for the years 2011 and 2012, respectively) between ebullition bubble patch
10
area covering the lake ice and distance from the rapidly eroding eastern margin of the lake (Fig. 5). The percent surface area of lake ice covered with ebullition bubble patches ice decreased with distance from the active erosion margin. Thermo-erosion as well as talik growth on the expanding eastern shore release labile Pleistocene-aged organic matter as permafrost thaws, enhancing anaerobic microbial activity in the lake
15
and talik sediments, and leading to enhanced methane emissions along this shore (Brosius et al., 2012; Walter Anthony and Anthony, 2013). Holocene-aged carbon from vegetation and active layer soils is also eroded and additionally produced within the lake, further fueling microbial methane production (Walter Anthony et al., 2014). We observed fewer ebullition bubble patches in the center of the lake, which we interpret as
20
a sign that labile Pleistocene-aged organic carbon in the talik under this area has been largely depleted, and unlike at the edge along the active erosion margin, there is no significant additional accumulation of ancient labile carbon in the lake center (Brosius et al., 2012). Radiocarbon dating of bubble patches found in the lake center showed that these seeps originate from Holocene-aged and more recent organic matter that is
25
BGD
12, 7449–7490, 2015Detecting methane ebullition on thermokarst lake ice
P. R. Lindgren et al.
Title Page
Abstract Introduction
Conclusions References
Tables Figures
◭ ◮
◭ ◮
Back Close
Full Screen / Esc
Printer-friendly Version Interactive Discussion
Discussion
P
a
per
|
Discussion
P
a
per
|
Discussion
P
a
per
|
Discussion
P
a
per
|
eastern lake margin (Fig. 5), indicating that depletion of labile carbon progressed since these areas were included in the lake and the active thermo-erosion margin migrated eastward. This shows that optical remote sensing is a powerful tool to understand the spatial variability of methane ebullition on thermokarst lakes.
4.2.2 Multi-year comparison of bubble patch characteristics: 2011 and 2012 5
We observed four possible characteristics of bubble patch dynamics in our images (Fig. 6). (a) Bubble patches may move horizontally; (b) bubble patches don’t maintain the same morphology between years (e.g. single bubble patches re-appear in a cluster of multiple patches the next year or vice-versa); (c) bubble patches appear in an image in one year and not another; and (d) bubble patches maintain the location and shape
10
but patch size is different between the years. It is important to note that these obser-vations are made during the two very short windows of time 2–4 days after freeze-up. Our analysis does not take into account the changes in long-term bubble patch mor-phology. Hence, it is important to highlight that the characteristics of bubble patches are driven by the dynamics of bubble formation and transport, hydrostatic pressure,
15
and ice growth. Other changes in the characteristics of bubble patches could be be-cause of evolution of point sources or changes in point source conduits (bubble tubes) in the sediment (Walter et al., 2008a; Scandella et al., 2011). Atmospheric pressure dy-namics can also strongly impact bubbling over short time scales, resulting in different ice-bubble patterns one year from the next if insufficient time passes to allow all seeps
20
to be expressed in the lake ice cover. Field measurements have shown that ebulli-tion is inversely related to changes in hydrostatic pressure (Mattson and Likens, 1990; Varadharajan, 2009; Casper et al., 2000; Glaser et al., 2004; Tokida et al., 2007; Scan-della et al., 2011). A significant air pressure drop during the week preceding image acquisition in October 2012 may have allowed methane that previously accumulated
25
BGD
12, 7449–7490, 2015Detecting methane ebullition on thermokarst lake ice
P. R. Lindgren et al.
Title Page
Abstract Introduction
Conclusions References
Tables Figures
◭ ◮
◭ ◮
Back Close
Full Screen / Esc
Printer-friendly Version Interactive Discussion
Discussion
P
a
per
|
Discussion
P
a
per
|
Discussion
P
a
per
|
Discussion
P
a
per
|
enhance ebullition before the image was acquired. As a result, bubble patch density was 55 % higher in 2012 (0.185 m−2) 2012 compared to 2011 (0.119 m−2). Similarly, the estimated mean whole-lake ebullition was 24 % higher in 2012 compared to 2011. However, the general spatial distribution of bubble patches remained the same be-tween the two years: ebullition bubble patches were more concentrated towards the
5
eastern thermokarst lake shore.
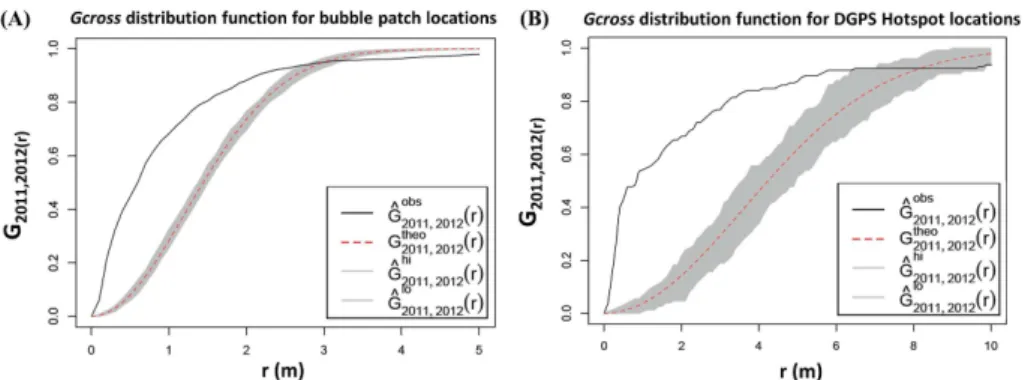
TheGcrossdistribution functions for marked bubble patch locations derived from im-ages and for Hotspot locations derived from DGPS field datasets agree on regularities of seep locations across time (Fig. 8). The deviation between the observed empirical value (black curve) and theoretical expected value assuming the points are completely
10
random (red curve) inGcross function, suggests that a large and statistically signifi-cant number of bubble patches and Hotspot seeps show spatial dependence between years 2011 and 2012 (Fig. 8). The empirical curves in both cases lie well above the gray shaded area, which is the 95 % critical confidence band for theoretical assumption of complete spatial randomness and independence. The plot for bubble patch distribution
15
function shows that a statistically significant number of second year bubble patch center points are less than 2 m away from the first year center points. The observed function for the DGPS Hotspot locations rises almost vertically over separation distances of 0– 1 m deviating away from the theoretical function. Therefore, we conclude that the seep locations are consistent between years 2011 and 2012. Based on our DGPS data, the
20
number of Hotspots was relatively stable among the various surveys with about 105 Hotspots for the whole lake as the average of various measurements during different years and spring and fall field seasons (Greene et al., 2014). UAV-based aerial images taken five days after ice formation when snow covered the lake also demonstrated close agreement with the Hotspot seep numbers and locations. We were able to
iden-25
tify 78 dark open-water holes in the white, snow-covered UAV lake image acquired in early winter of 2012. Among these 78 locations there was a total of about ∼95–100
BGD
12, 7449–7490, 2015Detecting methane ebullition on thermokarst lake ice
P. R. Lindgren et al.
Title Page
Abstract Introduction
Conclusions References
Tables Figures
◭ ◮
◭ ◮
Back Close
Full Screen / Esc
Printer-friendly Version Interactive Discussion
Discussion
P
a
per
|
Discussion
P
a
per
|
Discussion
P
a
per
|
Discussion
P
a
per
|
multiple, coalesced holes produced by Hotspot seeps of close proximity (Supplement Fig. S3).
When we compared the location of bubble patches in 2011 and 2012, we found that 47.2 % of total 1195 ebullition bubble patches mapped in 2011 reappeared in 2012, which is 35.7 % of total 1860 ebullition bubble patches mapped in 2012 (Table 2).
Us-5
ing thresholds of area overlap in our evaluation of seep location stability we found that 37.5, 30 and 17.7 % of bubble patches mapped in 2011 reappeared when we consid-ered bubble patches with “more than 25 % area overlap”, “more than 50 % overlap” and “more than 75 % area overlap”, respectively. We expect that if more time passed between the time of freeze-up and aerial image acquisition date we would see an even
10
higher percentage of seep location re-occurrences because more seeps would be ac-tively expressed.
We also observed a relationship between bubble patch brightness and location sta-bility of bubble patches. Very bright patches in 2012 seemed to appear at locations where bubble patches were already observed in 2011. Increased brightness in 2012
15
of re-occurring ebullition bubble patches could indicate locations of high flux seeps where methane was able to rise through the sediment even in relatively high hydro-static pressure conditions that we observed in October 2011. Based on our bubble patch classification results (Table 1), we also noticed that seep density of high-flux C-and Hotspot-type seeps is less variable during our study period compared to low-flux
A-20
and B-type seeps. However, long-term remote sensing and ground-based observations are required to further test our hypothesis.
The regularity of bubble patches observed despite the differences in atmospheric pressure conditions following the lake freeze-up events in 2011 and 2012 as well as the location stability of Hotspots indicates that a large number of point source
25
ebul-BGD
12, 7449–7490, 2015Detecting methane ebullition on thermokarst lake ice
P. R. Lindgren et al.
Title Page
Abstract Introduction
Conclusions References
Tables Figures
◭ ◮
◭ ◮
Back Close
Full Screen / Esc
Printer-friendly Version Interactive Discussion
Discussion
P
a
per
|
Discussion
P
a
per
|
Discussion
P
a
per
|
Discussion
P
a
per
|
lition dynamics for periods of up to 700 days. In Siberia one Hotspot seep location was marked and found stable for at least eight years (Walter Anthony et al., 2010).
5 Benefits and challenges of aerial image analysis for ebullition seep mapping
Our results show that ebullition bubble patches can be mapped to high precision in aerial imagery. But because ebullition is a temporally dynamic phenomenon, our
abil-5
ity to accurately identify the distinct seep type of bubble patches on a snapshot of ebullition activity during only 2 and 4 days since lake ice formation is limited. The mor-phology and distribution of bubbles can undergo significant changes in response to freeze/thaw cycles during winter (Jeffries et al., 2005). Furthermore, ebullition is highly controlled by the balance between atmospheric pressure and sediment strength
mak-10
ing it an episodic phenomenon (Varadharajan, 2009; Scandella et al., 2011). Ebullition is triggered following the falling of hydrostatic pressure or after a sufficient volume of gas is produced in the sediment that allows “bubble-tubes” or “gas conduits” in lake sediments to open or dilate (Scandella et al., 2011). Bubbles previously trapped in lake sediment then break out through these open “bubble-tubes” and rise up in the water
15
column. Moreover, microbial activity of methane producing bacteria is temperature de-pendent. As a result, seep ebullition slows down when the lake surface sediments cool down in winter and it increases as lake sediment warms up in summer (Walter An-thony and AnAn-thony, 2010). Therefore, discrepancies arise in estimates of the number of seeps and seep morphology derived from observations made at different times of
20
the ice cover season (Wik et al., 2011).
Ideally, optical image acquisition would occur at least several weeks following freeze-up of lakes to allow more time for seep expression in lake ice. Unfortunately, snow-free conditions several weeks after freeze-up is rare in many regions of the Arctic and early snow cover inhibits the mapping of bubble patches with optical data. Despite these
25
BGD
12, 7449–7490, 2015Detecting methane ebullition on thermokarst lake ice
P. R. Lindgren et al.
Title Page
Abstract Introduction
Conclusions References
Tables Figures
◭ ◮
◭ ◮
Back Close
Full Screen / Esc
Printer-friendly Version Interactive Discussion
Discussion
P
a
per
|
Discussion
P
a
per
|
Discussion
P
a
per
|
Discussion
P
a
per
|
snow cover allow to map and characterize bubble patches on the entire lake surface as well as assess their spatial distribution more accurately. We were able to differentiate high methane emitting seeps from low methane emitting seeps on the lake based on bubble patch brightness. Image-derived estimates of seep densities by class agreed with those of field-based survey methods, except for the understandable problems of
5
overestimating Hostspots and underestimating A-type seeps. We were able to diff er-entiate lake areas with high seep densities vs. low seep densities; this ability could be especially important on larger lakes that are harder to survey extensively by foot. Thus, our study shows that remote sensing methods have the potential to be very help-ful for improving understanding of ebullition spatial variability and microbial processing
10
of organic matter within an individual lake. Our results also imply a potential to ap-ply high resolution optical images at a regional scale to quantify relative methane flux from other lakes, which at a minimum should allow for classification of high-ebullition vs. low-ebullition lakes and their distribution in a region. It is important to note, that while image analysis is useful to comprehensive mapping of lake-ice bubbles, for
esti-15
mation of whole-lake methane emissions, this technique should be coupled with field measurements of bubble collection using bubble traps and laboratory measurements of methane concentration in bubbles.
Finally, a lake’s capacity to produce methane can tell us about the permafrost charac-teristics in the lake area. For example, yedoma-type thermokarst lakes such as
Gold-20
stream L., where large amount of labile carbon is readily available for microbes to decompose, emit more methane than non-yedoma-type thermokarst lakes (Walter An-thony and AnAn-thony, 2013; Sepulveda-Jáuregui et al., 2014). This differentiation could be used for identifying presence or absence of organic-rich permafrost deposits such as yedoma in the area and can be a useful supplement to surveying soil carbon pools
25
BGD
12, 7449–7490, 2015Detecting methane ebullition on thermokarst lake ice
P. R. Lindgren et al.
Title Page
Abstract Introduction
Conclusions References
Tables Figures
◭ ◮
◭ ◮
Back Close
Full Screen / Esc
Printer-friendly Version Interactive Discussion
Discussion
P
a
per
|
Discussion
P
a
per
|
Discussion
P
a
per
|
Discussion
P
a
per
|
6 Conclusions
It is important to understand the dynamics of methane ebullition from thermokarst lakes to estimate the amount of carbon release from thawing permafrost and evaluate its feedback to the global carbon cycle. Our study focusing on Goldstream L., Interior Alaska, shows that high-resolution optical remote sensing is a promising tool to map
5
the distribution of point source methane ebullition seeps across an entire thermokarst lake surface, a task that is difficult to achieve through field-based surveys alone.
Statistical analysis of mapped bubble patches allowed differentiation between low-flux (A- and B-type seeps) and high-low-flux (C-type seeps and Hotspots) methane ebul-lition seeps on the lake. Multi-temporal analysis of bubble patches mapped in 2011
10
and 2012 images indicated variability in ebullition seep densities on the lake. We ob-served more active ebullition (i.e. a higher density of seeps) in 2012 coinciding with low atmospheric pressure preceding the image acquisition while high-pressure condi-tion suppressed ebullicondi-tion activity in 2011. It is possible that the twice as long period of ice formation and bubble accumulation in 2012 (4 days) compared to 2011 (2 days) also
15
contributed to the observation of more seep activity in the early days following freeze-up in 2012. Our mean whole-lake ebullition estimates for 2011 (174±28 mL gas m−2d−1)
and 2012 (216±33 mL gas m−2d−1) using aerial image analysis of the whole lake were slightly higher than the estimate based on field surveys of only 13 % of the lake con-ducted over multiple years (170±54 mL gas m−2d−1). We found that aerial image anal-20
ysis of early-fall images tended to underestimate low-flux A-type seeps, but overesti-mated the density of Hotspots, leading to total higher flux estimates than field-based surveys. If more time were allotted between freeze-up and image acquisition (for in-stance the 1–3 weeks typically allowed for ground surveys), such that the infrequent bubbling of A’s could occur and a subset of open holes would freeze-over to be
rec-25
BGD
12, 7449–7490, 2015Detecting methane ebullition on thermokarst lake ice
P. R. Lindgren et al.
Title Page
Abstract Introduction
Conclusions References
Tables Figures
◭ ◮
◭ ◮
Back Close
Full Screen / Esc
Printer-friendly Version Interactive Discussion
Discussion
P
a
per
|
Discussion
P
a
per
|
Discussion
P
a
per
|
Discussion
P
a
per
|
A large and statistically significant number of seeps were stable over our study period despite the differences in atmospheric pressure and lake ice conditions only 2 and 4 days following freeze-up. The general spatial distribution of seeps was very consistent in both years with a strong inverse relationship between percent surface area of lake ice with bubble patches and distance from an actively eroding thermokarst lake margin
5
(R2=0.86 and R2=0. 79 for 2011 and 2012, respectively). These findings indicate lake expansion by thermokarst activity to be the dominating factor for high methane seep ebullition on Goldstream L.
Our study shows that remote sensing techniques can help overcome the shortcom-ings of a sole field-based method of methane survey, particularly by revealing the
lo-10
cation and relative sizes of high- and low-flux seepage zones within lakes. However, the timing of image acquisition is a critical and potentially limiting factor, with respect to both atmospheric pressure changes and snow/no-snow conditions during early lake freeze up. Our approach is applicable to other regions and will help to characterize methane ebullition emissions from seasonally ice-covered lakes, including thermokarst
15
and non-thermokarst lakes. Remotely sensed, multi-temporal spatial information allows identification of variables that control methane ebullition dynamics and spatial patterns to better estimate methane emission from thermokarst lakes. Such observations may also be used to indirectly characterize permafrost carbon storage since thermokarst lakes with greater numbers of high flux seeps adjacent to margins of thermokarst
ex-20
pansion likely indicate the presence of organic-rich permafrost deposits.
The Supplement related to this article is available online at doi:10.5194/bgd-12-7449-2015-supplement.
Author contributions. G. Grosse and K. M. Walter Anthony conceived this study. P. R. Lindgren developed the method, performed data analysis, and wrote the manuscript with significant input 25
BGD
12, 7449–7490, 2015Detecting methane ebullition on thermokarst lake ice
P. R. Lindgren et al.
Title Page
Abstract Introduction
Conclusions References
Tables Figures
◭ ◮
◭ ◮
Back Close
Full Screen / Esc
Printer-friendly Version Interactive Discussion
Discussion
P
a
per
|
Discussion
P
a
per
|
Discussion
P
a
per
|
Discussion
P
a
per
|
Acknowledgements. We thank A. Bondurant for harvesting ice blocks; P. Anthony for statistical coding; and A. Strohm, M. Engram and J. Lenz for assistance with other field work. We thank J. Cherry for aerial image acquisitions and B. Crevensten and G. Walker for UAV image ac-quisitions. This research was funded by NASA Carbon Cycle Science grant #NNX11AH20G. Additional support came from NSF # 1107892.
5
References
Baatz, M. and Schäpe, A.: Multiresolution segmentation – an optimization approach for high quality multi-scale image segmentation, in: Angewandte Geographische Informationsverar-beitung XII, Beiträge zum AGIT-Symposium Salzburg, Herbert Wichmann Verlag, Karlsruhe, 12–23, 2000.
10
Baddeley, A. and Turner, R.: Spatstat: an R package for analyzing spatial point patterns, J. Stat. Softw., 12, 1–42, available at: www.jstatsoft.org, 2005.
Bastviken, D.: Methane emissions from lakes: dependence of lake characteristics, two regional assessments, and a global estimate, Global Biogeochem. Cy., 18, 1–12, doi:10.1029/2004GB002238, 2004.
15
Bastviken, D., Tranvik, L. J., Downing, J. A., Crill, P. M., and Enrich-Prast, A.: Freshwater methane emissions offset the continental carbon sink, Science, 331, p. 50, 2011.
Bivand, R. S., Pembesma, E. J., and Gomez-Rubio, V.: Applied Spatial Data Analysis with R, Springer, New York, 2008.
Blaschke, T. and Strobl, J.: What’s wrong with pixels? Some recent developments interfacing 20
remote sensing and GIS, GIS – Zeitschrift für Geoinformationssysteme, 14, 12–17, 2001. Blaschke, T., Lang, S., and Hay, G. J.: Object Based Image Analysis: Spatial Concepts for
Knowledge-Driven Remote Sensing Applications, Springer-Verlag Berlin, Heidelberg, Ger-many, 2008.
Boereboom, T., Depoorter, M., Coppens, S., and Tison, J.-L.: Gas properties of winter lake 25
ice in Northern Sweden: implication for carbon gas release, Biogeosciences, 9, 827–838, doi:10.5194/bg-9-827-2012, 2012.