Cyclical convergence of Central and Eastern European
countries to the Euro area core.
New methodological approach
Ileana ALEXE The Bucharest University of Economic Studies [email protected] Oana Cristina POPOVICI The Bucharest University of Economic Studies [email protected]
Abstract.The current paper develops an analysis on the degree of business cycle convergence of the new member states of the EU towards the Euro area core (Germany, France, Italy, Belgium, Netherlands and Luxembourg) during 1996 – 2010.
Unlike the previous research, the study takes into consideration the similarity of cycles, and not their synchronization. Furthermore, from the methodological point of view, it explores the use of survey indicators in the analysis of the cycles, thus in addition to the traditional approach that employs the GDP. The results obtained through clusterization show that the degree of convergence towards Euro area core remains modest.
Keywords: cyclical convergence; business cycles; similarity of business cycles; Central and Eastern Europe; Euro area.
1. Introduction
The study of the economic convergence has received particular attention in the literature, especially within the European Union (EU) integration process. The research has focused on the issue of real convergence, which was defined by De Coevering (2003) as a two side process: on the one hand, the tendency to equalization of incomes and development levels, and, on the other hand, the tendency to attain a level of similarity between business cycles, more exactly the cyclical convergence on which the present paper focuses. The analysis of this type of convergence has become necessary in the context of the unique European currency and of the common monetary policy defined by the European Central Bank.
In the study of cyclical convergence, the majority of the empirical papers have concentrated exclusively on one property of the business cycles, namely synchronization. According to this property, the countries with strong links regarding the concordance and the correlations of business cycles should bear lower costs when joining a monetary union than those with less synchronized business cycles.
Even though it cannot be denied the fact that synchronization of business cycles is a relevant characteristic, it should be mentioned that this represents a necessary condition, but not sufficient in order to determine whether business cycles are similar enough with a view to assessing the costs of a monetary union. If the shape of the business cycles is different, a unique monetary policy applied to a monetary union would prove to be inadequate for all the participating countries.
For this reason, this research paper aims to study the similarity of business cycles, and not their degree of synchronization. The study focuses on countries of Central and Eastern Europe (CEE) which joined the EU in 2004, respectively 2007, and analyzes the degree of similarity of business cycles in these countries towards the core of the Euro area. While the papers conducted up to present employed the Gross Domestic Product (GDP) as a relevant indicator to evaluate the degree of similarity between business cycles, the present paper extends the research area by using indicators based on surveys rather than GDP. The time period of the analysis is between 1996 and 2010.
The article is organized into four sections, as follows: the synthesis of the literature is provided in Section 2, the proposed research methodology in Section 3, the results obtained in Section 4, and Section 5 concludes.
5
2. Literature review
Up until now, the similarity of business cycle characteristics among the European countries has not received the required scrutiny. The majority of the studies focused only on the description of the cycles. There are also authors such as Camacho, Perez and Saiz (2006) who study the similarity of business cycles and extend the analysis to the shape of the cycles. They provide at least four contributions to the literature: they provide a solid statistical framework to analyze the similarity of business cycle characteristics, by applying an adequate model for short data series; they study the business cycle characteristics of the new EU member states; they have a new statistical approach for the analysis and comparison of business cycles, by employing clusterization techniques of countries with similar characteristics of business cycles; and they are pioneers in terms of establishing a relationship between the distances in the business cycle characteristics of two countries and the distances in the synchronization degree. It is also interesting the fact that through clusterization the authors prove that there is not a single business cycle at the European level, in terms of business cycle similarity.
Based on the clusterization of countries according to the similarity of business cycle characteristics conducted by Camacho, Perez and Saiz (2006), Beyaert and Garcia-Solanes (2009) have explored the influence of business cycle phases from countries with similar business cycle characteristics on the real convergence between these countries. The results show that the convergence process is not uniform across the business cycles. In their analysis regarding the characteristics of business cycles, the authors employ the GDP usual indicator.
In the literature, there has also been a new approach to business cycles towards their analysis through the survey indicators. This approach aims to overcome the shortcomings of the GDP and industrial production indicators, traditionally employed for this purpose.
There are currently empirical studies in the literature that approach comparatively the business cycles, through usual statistical indicators and survey indicators. The major conclusion has supported the potential of these indicators to be employed in this type of analysis.
As compared to this literature background, the current research can contribute significantly. Firstly, unlike most of the studies until now, the paper focuses on the analysis of business cycle similarity and not on their synchronization, a broadly debated topic so far. Secondly, some new approaches are explored in terms of indicators that can be employed in the analysis of business cycles. More specifically, we take into account survey indicators, in this case the Economic Sentiment Indicator (ESI) computed by the European Commission. Thirdly, the degree of similarity between business cycle characteristics is assessed through clusterization, a method with limited applicability in this field so far.
3. Research methodology
The current study presents a quantitative analysis on the degree of the similarity of business cycles between CEE countries and Euro area core. We have included 16 EU countries in the study, 10 of them belonging to CEE group – and being referred to by EU-10 – (Romania, Bulgaria, Slovakia, Slovenia, Estonia, Lithuania, Latvia, Hungary, Czech Republic, Poland), and the other six being Euro area members. The latter ones make up the core of the Economic and Monetary Union (EMU): Germany, France, Italy, Belgium, Netherlands and Luxembourg. Their statute as members of the EMU core has been defined in many studies, among which the comprehensive analysis conducted by Kappler (2008).
The employed data concern the period 1996-2010.
The variable used in order to determine the similarity of business cycles is ESI. This is monthly published by the European Commission for each of the 27 member countries. ESI is an indicator made up of more confidence indicators: indicators regarding industry, services, consumption, constructions and retail trade. The highest share is given to the indicator regarding industry (40%), followed by services (30%), consumption (20%), constructions and retail trade (each with a 5% share). These confidence indicators are computed as arithmetic averages, seasonally adjusted, of answers obtained following the survey questions. The surveys have been harmonized.
7
publishes only monthly series of this indicator, in order to obtain quarterly data, we have computed the arithmetic averages of the values for each country.
The method applied for dating business cycles is based on the definition of inflexion points according to the methodology proposed by Bry and Boschan (1971):
maximum point at moment t = {yt-2 < yt, yt-1 < yt; yt > yt+1, yt > yt+2};
minimum point at moment t = { yt-2 > yt, yt-1 > yt; yt < yt+1, yt < yt+2}.
This methodology is also used by the National Bureau of Economic Research, which imposes more restrictions: the minimum duration of business cycles phases must be of six months, that is two quarters in case of quarterly data, and a complete cycle should have a minimum duration of 15 months, that is five quarters in case of quarterly data. If there is a situation in which two or more minimum or maximum points are very closed to each other, then we have chosen the lowest, respectively the highest among them.
After having dated the business cycles, in this stage of research, we have kept in the analysis only the amplitude. For each country included in the study we have computed an average amplitude, both for expansion and recession phases. Then, we have applied the hierarchical clusterization technique in the SPSS soft in order to identify the countries with similarities of business cycle characteristics during expansion and recession phases. By using the hierarchical clustering, we have been able to note very clearly the clusterization stages of countries and the size of the distances between them at every moment. In the Annexes 1 and 2 we have presented the corresponding dendograms for both economic expansion and recession phases.
After determining the final clusters, we have emphasized the countries within the EU-10 group that have joined countries in the Euro area core, having similar amplitudes of business cycles.
4. Findings of the paper
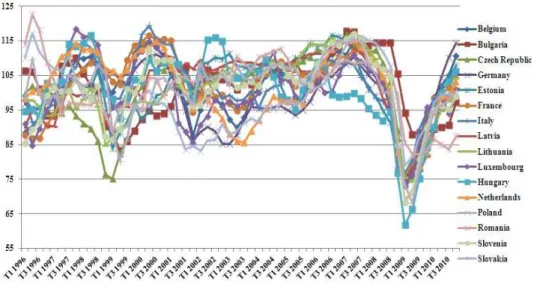
After having aggregated the monthly data of ESI, we can notice in the figure below the quarterly evolution for all the 16 European countries included in the study.
Source: Authors’ estimations.
Figure 1. Evolution of economic sentiment indicator, Q1 1996 – Q4 2010
Surprisingly, Romania is the country within EU-10 that has recorded a maximum quarterly value of ESI in Q2 1996, of 122.6 points, which points to an economic sentiment above average supported by the transition to the market economy and the progressive development of the private sector. According to the data of National Forecast Commission, the year 1996 has marked the moment when the private sector became a major sector that contributed to the GDP by 55%.
At the opposite side there is Hungary, which recorded a minim value of ESI in Q1 2009, of 61.7 points, that suggests an economic sentiment well below the average, due to the urgent liquidity needs of the country, despite the agreement concluded at the end of 2008 with the International Monetary Fund.
9
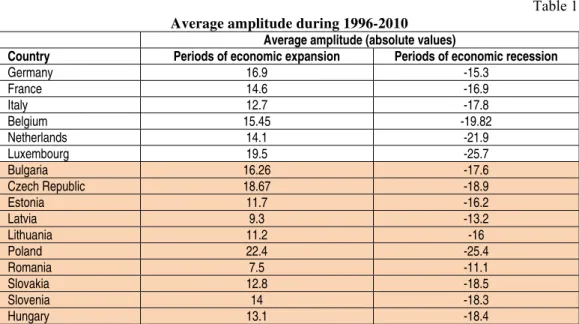
Table 1 Average amplitude during 1996-2010
Average amplitude (absolute values)
Country Periods of economic expansion Periods of economic recession
Germany 16.9 -15.3
France 14.6 -16.9
Italy 12.7 -17.8
Belgium 15.45 -19.82
Netherlands 14.1 -21.9
Luxembourg 19.5 -25.7
Bulgaria 16.26 -17.6
Czech Republic 18.67 -18.9
Estonia 11.7 -16.2
Latvia 9.3 -13.2
Lithuania 11.2 -16
Poland 22.4 -25.4
Romania 7.5 -11.1
Slovakia 12.8 -18.5
Slovenia 14 -18.3
Hungary 13.1 -18.4
Source: Authors’ estimations.
The comparative analysis of the two groups, the Euro area core and EU-10, emphasizes that Poland and Luxembourg have recorded the highest amplitudes during expansion periods, but also the most significant decreases during economic recession periods.
Within the group of CEE countries, Romania and Latvia display similar developments, with low values of the amplitude during the economic cycle phases. As regards Romania, it can be noticed that it recorded the lowest average amplitude during economic expansion periods from 1996 to 2010, by comparison to the countries included in the analysis. Also, as regards economic recession phases, Romania recorded the lowest average amplitude. This data could seem inconsistent to the GDP data, given the fact that during 2004-2008 Romania recorded a high growth period, and during the economic crisis the downfall was serious, but the data presented here are averages for the period 1996-2010.
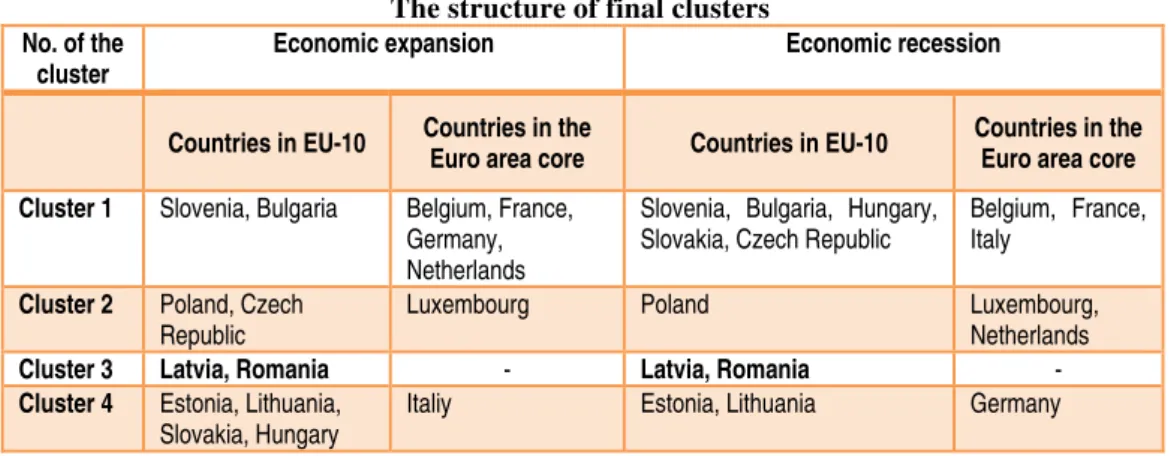
Table 2 The structure of final clusters
No. of the cluster
Economic expansion Economic recession
Countries in EU-10 Countries in the
Euro area core Countries in EU-10
Countries in the Euro area core
Cluster 1 Slovenia, Bulgaria Belgium, France, Germany, Netherlands
Slovenia, Bulgaria, Hungary, Slovakia, Czech Republic
Belgium, France, Italy
Cluster 2 Poland, Czech Republic
Luxembourg Poland Luxembourg,
Netherlands
Cluster 3 Latvia, Romania - Latvia, Romania -
Cluster 4 Estonia, Lithuania, Slovakia, Hungary
Italiy Estonia, Lithuania Germany
Source: Authors’ work.
The clusters highlight the lack of membership of Romania and Latvia to the Euro area core both during the economic expansion and recession phases. Hence, the average amplitude of business cycles in Romania and Latvia has remained different from that of the Euro area core, questioning the desirability of joining the Euro area in the near future.
Another important observation is that the different amplitudes of business cycles in the countries belonging to the Euro area core places them in different clusters, providing evidence for the absence of similarity of this characteristic even though all the six countries have a unique currency and monetary policy.
As regards the way of grouping of EU-10 countries with those belonging to Euro area core, there is a lack of stability taking into account the economic cycle phases. The only cluster that remains the same is that of Romania and Latvia, which is very distinct to the Euro area core.
The cluster which gathers the highest number of EU-10 countries is cluster number 1, corresponding to the economic recession phases. More exactly, the five countries Slovenia, Bulgaria, Hungary, Slovakia, and the Czech Republic display average amplitudes similar to Belgium, France and Italy in the recession periods.
5. Conclusions
In this stage of the research we have obtained a series of important results regarding the similarity of business cycle characteristics between Euro area and CEE countries.
unique, notable exception: Romania and Latvia. These countries form a distinct cluster during both expansion and recession phases.
Knowing that synchronization of business cycles is a necessary, but not sufficient condition for taking part in a monetary union, the study provides evidence that within the EU-10 group, the Euro area core, but also within these countries as a whole, there are still remarkable differences of business cycle characteristics, which may generate costs for the members of the monetary union.
Acknowledgements
This work was cofinanced from the European Social Fund through Sectoral Operational Programme Human Resources Development 2007-2013, project number POSDRU/107/1.5/S/77213 „Ph.D. for a career in interdisciplinary economic research at the European standards”.
References
Beyaert, A., Garcia-Solanes, J. (2009). “Short run fluctuations and long run convergence: a TAR Panel Unit Root Approach”, http://www.um.es/c/document_library/get_file?uuid= b2827b3a-d12e-4138-b372-0cc581f16373&groupId=807682
Bry, G., Boschan, C. (1971). “Cyclical Analysis of Time Series: selected procedures and computer programs”, New York, NBER
Camacho, M., Perez-Quiros, G., Saiz, L. (2006). “Do European business cycles look like one?”, Bank of Spain Working Paper, No. 0518
van de Coevering, C. (2003). “Structural convergence and monetary integration in Europe”, Bank of Netherlands, Monetary and Economic Policy Department, MEB Series No. 2003-20
Gayer, C., Weiss, P. (2006). “Convergence of Business Cycles in the Euro Area: Further Evidence from Survey Data”, EU Workshop on recent developments in Business and Consumer Surveys, Brussels, European Commission
Kappler, M. (2008). “Study on economic integration and business cycle synchronization. Final Report”, Project for the European Commission, http://ec.europa.eu/dgs/policy_advisers/ publications/docs/final_report_study_zew.pdf
*** European Commission, Economic and Financial Affairs, “Business and consumer surveys”,
http://ec.europa.eu/economy_finance/db_indicators/surveys/index_en.htm , http://ec.europa.eu/economy_finance/db_indicators/surveys/documents/userguide_en.pdf
Annex 1 – Hierarchical clustering during expansion phases
Source: SPSS, authors’ work.
Annex 2 – Hierarchical clustering during recession phases