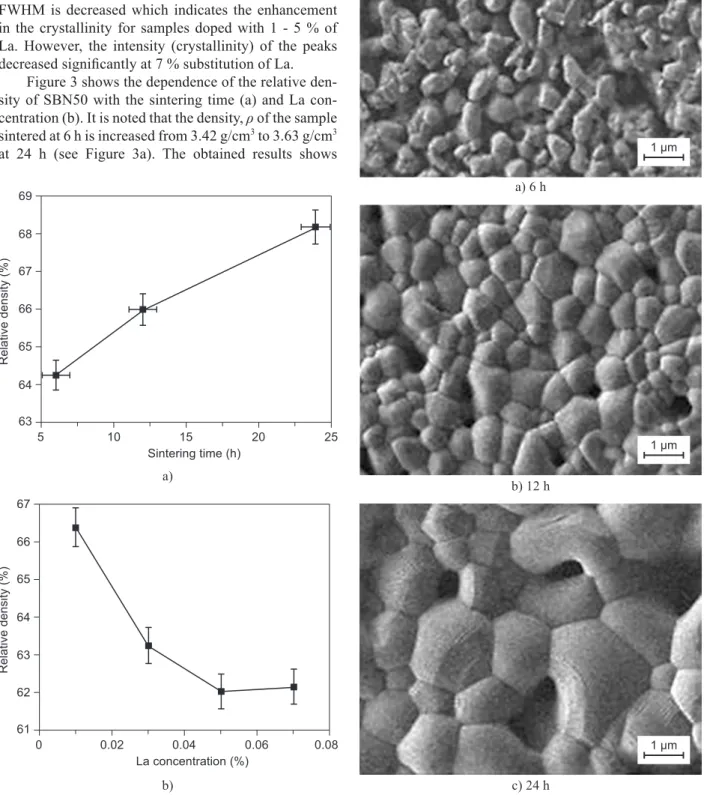
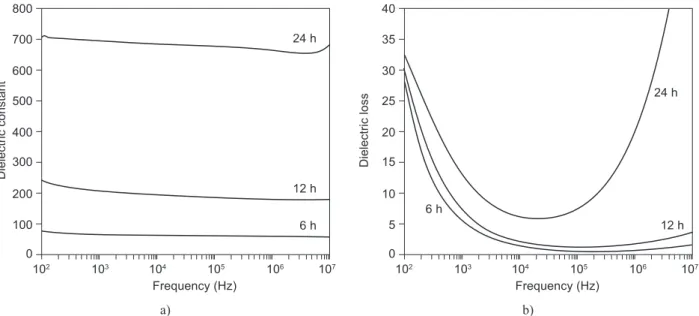
STRUCTURAL AND DIELECTRIC STUDIES ON Sr0.5-3y/2LayBa0.5Nb2O6 CERAMIC SYSTEMS WITH VARIED SINTERING TIME AND La CONCENTRATION
Texto
Imagem


Documentos relacionados
The dielectric properties such as dielectric constant, the dielectric loss and AC conductivity of the Pr 2 O 5 doped borate glass were studied in the diferent frequencies
The dielectric constant and the dielectric loss of the pellets of CeO 2 nanoparticles in disk form were studied at different temperature using a HIOKI 3532-50 LCR HITESTER in
In this study, the complex dielectric constant (the real part of permittivity and dielectric loss tangent) and microwave properties (such as: relection coeicient,
The discontinuities are represented by the absence of the polyethylene dielectric, and the dielectric constant is set at 1.0006 (air) and the loss tangent is zero. The
On the other hand, the dielectric losses ( e ”) show an increase with both iller concentration and frequency. This behavior is more accentuated for the mass fractions above
The inluences of dysprosium-doped fraction on the grain size and dielectric properties of barium titanate ceramic, including dielectric constant and breakdown electric ield
The capacitance and dielectric loss values for individual tran- sitions at different time intervals are noted at each crystalliza- tion temperature, and the corresponding data
Figure 5 is a 3D response surface plot showing the effect of methanol concentration and time (Figure 5a) and the effect of temperature and methanol concentration (Figure 5b) on
